Special notes of this burst
Image
Pre-slew 15.0-350.0 keV image (Event data)
#   RAcent    DECcent   POSerr    Theta     Phi              Peak Cts       SNR   Name
  169.5983   -20.0508   0.0055    31.3215   154.6746         2.6738483     35.027 TRIG_00526351

Foreground time interval of the image:
 -4.572  14.901 (delta_t =  19.473 [sec])
Background time interval of the image:
-239.800  -4.572 (delta_t = 235.228 [sec])
Lightcurves
Notes:
- 1) The mask-weighted light curves are using the flight position.
- 2) Multiple plots of different time binning/intervals are shown to cover all scenarios of short/long GRBs, rate/image triggers, and real/false positives.
- 3) For all the mask-weighted lightcurves, the y-axis units are counts/sec/det where a det is 0.4 x 0.4 = 0.16 sq cm.
- 4) The verticle lines correspond to following: green dotted lines are T50 interval, black dotted lines are T90 interval, blue solid line(s) is a spacecraft slew start time, and orange solid line(s) is a spacecraft slew end time.
- 5) Time of each bin is in the middle of the bin.
1 s binning
From T0-310 s to T0+310 s

From T100_start - 20 s to T100_end + 30 s
Full time interval

64 ms binning
Full time interval

From T100_start to T100_end
From T0-5 sec to T0+5 sec
16 ms binning
From T100_start-5 s to T100_start+5 s

Blue+Cyan dotted lines: Time interval of the scaled map
From 0.000000 to 1.024000
8 ms binning
From T100_start-3 s to T100_start+3 s
Blue+Cyan dotted lines: Time interval of the scaled map
From 0.000000 to 1.024000
2 ms binning
From T100_start-1 s to T100_start+1 s

Blue+Cyan dotted lines: Time interval of the scaled map
From 0.000000 to 1.024000
SN=5 or 10 sec. binning (whichever binning is satisfied first)

SN=5 or 10 sec. binning (T < 200 sec)

Quad-rate summed light curves (from T0-300s to T0+1000s)
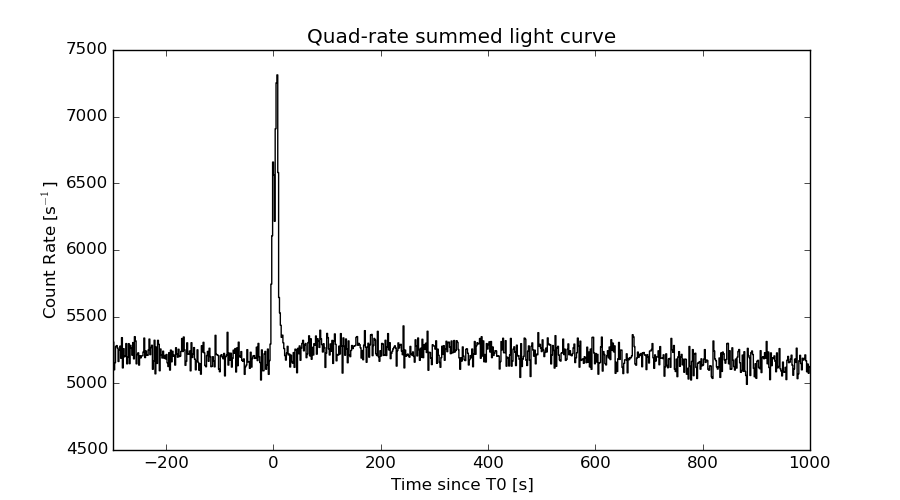
The mask-weighted light curves based on cleaned DPHs

Spectral Evolution

Spectra
Notes:
- 1) The fitting includes the systematic errors.
- 2) When the burst includes telescope slew time periods, the fitting uses an average response file made from multiple 5-s response files through out the slew time plus single time preiod for the non-slew times, and weighted by the total counts in the corresponding time period using addrmf. An average response file is needed becuase a spectral fit using the pre-slew DRM will introduce some errors in both a spectral shape and a normalization if the PHA file contains a lot of the slew/post-slew time interval.
- 3) For fits to more complicated models (e.g. a power-law over a cutoff power-law), the BAT team has decided to require a chi-square improvement of more than 6 for each extra dof.
Time averaged spectrum fit using the average DRM
Power-law model
Time interval is from   -4.572 sec. to   16.528 sec.

Spectral model in power-law:
------------------------------------------------------------
Parameters  : value       lower 90%   higher 90%
Photon index: 1.36422     ( -0.0764958   0.0762877 )
Norm@50keV  : 8.97358E-03    ( -0.000389481   0.000389453 )
------------------------------------------------------------
#Fit statistic : Chi-Squared =          62.41 using 59 PHA bins.
# Reduced chi-squared =          1.095 for     57 degrees of freedom
# Null hypothesis probability =   2.900982e-01

Photon flux (15-150 keV)    in 21.1 sec: 1.08427 ( -0.0495348  0.0496209 ) ph/cm2/s
Energy fluence (15-150 keV)             : 1.84345e-06 ( -8.66929e-08  8.69293e-08 ) ergs/cm2
Cutoff power-law model

Time interval is from   -4.572 sec. to   16.528 sec.
Spectral model in the cutoff power-law:
------------------------------------------------------------
Parameters  : value       lower 90%   higher 90%
Photon index: 0.988895     ( -0.315956   0.295386 )
Epeak [keV] : 144.267      ( -42.8158 290.416 )
Norm@50keV  : 1.35311E-02    ( -0.00364923   0.00538972 )
------------------------------------------------------------
#Fit statistic : Chi-Squared =          57.60 using 59 PHA bins.
# Reduced chi-squared =          1.029 for     56 degrees of freedom
# Null hypothesis probability =   4.156178e-01

Photon flux (15-150 keV)    in 21.1 sec: 1.06391 ( -0.05187  0.05194 ) ph/cm2/s
Energy fluence (15-150 keV)             : 1.80183e-06 ( -9.40701e-08  9.35511e-08 ) ergs/cm2
Band function

Time interval is from   -4.572 sec. to   16.528 sec.

Spectral model in the Band function:
------------------------------------------------------------
Parameters  : value       lower 90%   higher 90%
alpha       : 1.09055   ( -1.34969   -0.376217 )
beta        : -1.49345    ( -0.133611   0.115219 )
Epeak [keV] : 39.6410      ( -9.55143 32.7779 )
Norm@50keV   : 0.358501    ( -0.382593   113.921 )
------------------------------------------------------------
#Fit statistic : Chi-Squared =          53.75 using 59 PHA bins.
# Reduced chi-squared =         0.9772 for     55 degrees of freedom
# Null hypothesis probability =   5.225454e-01

Photon flux (15-150 keV)    in 21.1 sec:  (    ) ph/cm2/s
Energy fluence (15-150 keV)             : 0 ( 0  0 ) ergs/cm2
Single BB

Spectral model blackbody:
------------------------------------------------------------
Parameters  : value    Lower 90%  Upper 90%
kT [keV]    : 17.3691  (  )
R^2/D10^2   : 7.58392E-02  (   )
(R is the radius in km and D10 is the distance to the source in units of 10 kpc)
------------------------------------------------------------
#Fit statistic : Chi-Squared =         159.38 using 59 PHA bins.
# Reduced chi-squared =         2.7962 for     57 degrees of freedom
# Null hypothesis probability =   1.259048e-11

Energy  Fluence     90% Error
[keV]   [erg/cm2]   [erg/cm2]
15- 25  9.772e-08   9.147e-09
25- 50  4.398e-07   2.806e-08
50-150  9.536e-07   7.512e-08
15-150  1.491e-06   7.744e-08
Thermal bremsstrahlung (OTTB)
Spectral model: thermal bremsstrahlung
------------------------------------------------------------
Parameters  : value         Lower 90%    Upper 90%
kT [keV]    : 200.000       (      )
Norm        : 4.52690       (-0.197366     0.197328)
------------------------------------------------------------
#Fit statistic : Chi-Squared =          76.58 using 59 PHA bins.
# Reduced chi-squared =          1.344 for     57 degrees of freedom
# Null hypothesis probability =   4.281759e-02

Energy  Fluence     90% Error
[keV]   [erg/cm2]   [erg/cm2]
15- 25  2.378e-07   1.171e-08
25- 50  4.575e-07   2.374e-08
50-150  1.003e-06   5.454e-08
15-150  1.699e-06   8.324e-08
Double BB

Spectral model: bbodyrad<1> + bbodyrad<2>
------------------------------------------------------------
Parameters  : value         Lower 90%    Upper 90%
kT1 [keV]   : 7.77961        (-1.03176      1.16749)
R1^2/D10^2  : 0.708262        (-0.252325      0.423788)
kT2 [keV]   : 29.0594        (-3.72563      5.54854)
R2^2/D10^2  : 1.06268E-02    (-0.00478618   0.00672202)
------------------------------------------------------------
#Fit statistic : Chi-Squared =          51.24 using 59 PHA bins.
# Reduced chi-squared =         0.9317 for     55 degrees of freedom
# Null hypothesis probability =   6.189556e-01

Energy  Fluence     90% Error
[keV]   [erg/cm2]   [erg/cm2]
15- 25  1.903e-07   3.201e-08
25- 50  4.506e-07   6.277e-08
50-150  1.173e-06   2.093e-07
15-150  1.814e-06   2.220e-07
Peak spectrum fit
Power-law model

Time interval is from    7.508 sec. to    8.508 sec.

Spectral model in power-law:
------------------------------------------------------------
Parameters  : value       lower 90%   higher 90%
Photon index: 1.14586     ( -0.156256   0.153172 )
Norm@50keV  : 2.04087E-02    ( -0.00195164   0.00195081 )
------------------------------------------------------------
#Fit statistic : Chi-Squared =          67.36 using 59 PHA bins.
# Reduced chi-squared =          1.182 for     57 degrees of freedom
# Null hypothesis probability =   1.639036e-01

Photon flux (15-150 keV)    in 1 sec: 2.37891 ( -0.234154  0.234648 ) ph/cm2/s
Energy fluence (15-150 keV)             : 2.10359e-07 ( -2.16698e-08  2.17829e-08 ) ergs/cm2
Cutoff power-law model

Time interval is from    7.508 sec. to    8.508 sec.
Spectral model in the cutoff power-law:
------------------------------------------------------------
Parameters  : value       lower 90%   higher 90%
Photon index: 0.133644     ( -0.804405   0.678354 )
Epeak [keV] : 99.6982      ( -22.9194 88.7358 )
Norm@50keV  : 6.13120E-02    ( -0.031364   0.0788955 )
------------------------------------------------------------
#Fit statistic : Chi-Squared =          60.41 using 59 PHA bins.
# Reduced chi-squared =          1.079 for     56 degrees of freedom
# Null hypothesis probability =   3.196285e-01

Photon flux (15-150 keV)    in 1 sec: 2.29945 ( -0.24105  0.24113 ) ph/cm2/s
Energy fluence (15-150 keV)             : 1.99409e-07 ( -2.3393e-08  2.3409e-08 ) ergs/cm2
Band function

Time interval is from    7.508 sec. to    8.508 sec.

Spectral model in the Band function:
------------------------------------------------------------
Parameters  : value       lower 90%   higher 90%
alpha       : 4.88885   ( -7.31711   -4.88885 )
beta        : -1.37420    ( -0.274696   0.203925 )
Epeak [keV] : 33.7574      ( -6.22656 6.36822 )
Norm@50keV   : 247.771    ( -23.321   1131.53 )
------------------------------------------------------------
#Fit statistic : Chi-Squared =          59.49 using 59 PHA bins.
# Reduced chi-squared =          1.082 for     55 degrees of freedom
# Null hypothesis probability =   3.156771e-01

Photon flux (15-150 keV)    in 1 sec:  (    ) ph/cm2/s
Energy fluence (15-150 keV)             : 0 ( 0  0 ) ergs/cm2
Single BB
Spectral model blackbody:
------------------------------------------------------------
Parameters  : value    Lower 90%  Upper 90%
kT [keV]    : 19.1242  (-2.07537  2.40012)
R^2/D10^2   : 0.133088  (-0.0432663   0.0619716)
(R is the radius in km and D10 is the distance to the source in units of 10 kpc)
------------------------------------------------------------
#Fit statistic : Chi-Squared =          69.06 using 59 PHA bins.
# Reduced chi-squared =          1.212 for     57 degrees of freedom
# Null hypothesis probability =   1.313042e-01

Energy  Fluence     90% Error
[keV]   [erg/cm2]   [erg/cm2]
15- 25  9.545e-09   2.065e-09
25- 50  4.612e-08   6.845e-09
50-150  1.241e-07   2.051e-08
15-150  1.798e-07   2.335e-08
Thermal bremsstrahlung (OTTB)
Spectral model: thermal bremsstrahlung
------------------------------------------------------------
Parameters  : value         Lower 90%    Upper 90%
kT [keV]    : 200.000       (      )
Norm        : 9.87572       (-0.96697     0.966895)
------------------------------------------------------------
#Fit statistic : Chi-Squared =          82.50 using 59 PHA bins.
# Reduced chi-squared =          1.447 for     57 degrees of freedom
# Null hypothesis probability =   1.523900e-02

Energy  Fluence     90% Error
[keV]   [erg/cm2]   [erg/cm2]
15- 25  2.459e-08   3.400e-09
25- 50  4.729e-08   2.565e-08
50-150  1.037e-07   5.407e-08
15-150  1.756e-07   6.591e-08
Double BB

Spectral model: bbodyrad<1> + bbodyrad<2>
------------------------------------------------------------
Parameters  : value         Lower 90%    Upper 90%
kT1 [keV]   : 8.30262        (-3.06904      6.04185)
R1^2/D10^2  : 0.856022        (-0.599186      2.59242)
kT2 [keV]   : 25.8591        (-5.36656      41.1274)
R2^2/D10^2  : 4.05310E-02    (-0.038791   0.0563464)
------------------------------------------------------------
#Fit statistic : Chi-Squared =          59.37 using 59 PHA bins.
# Reduced chi-squared =          1.079 for     55 degrees of freedom
# Null hypothesis probability =   3.194917e-01

Energy  Fluence     90% Error
[keV]   [erg/cm2]   [erg/cm2]
15- 25  1.558e-08   8.336e-09
25- 50  4.710e-08   2.430e-08
50-150  1.376e-07   7.395e-08
15-150  2.003e-07   1.049e-07
Pre-slew spectrum (Pre-slew PHA with pre-slew DRM)
Power-law model
Spectral model in power-law:
------------------------------------------------------------
Parameters  : value       lower 90%   higher 90%
Photon index: 1.33632     ( -0.0764931   0.0762115 )
Norm@50keV  : 9.47901E-03    ( -0.000408661   0.000408659 )
------------------------------------------------------------
#Fit statistic : Chi-Squared =          60.43 using 59 PHA bins.
# Reduced chi-squared =          1.060 for     57 degrees of freedom
# Null hypothesis probability =   3.530224e-01

Photon flux (15-150 keV)    in 19.47 sec: 1.13879 ( -0.0518647  0.0519581 ) ph/cm2/s
Energy fluence (15-150 keV)             : 1.80812e-06 ( -8.43199e-08  8.45374e-08 ) ergs/cm2
Cutoff power-law model
Spectral model in the cutoff power-law:
------------------------------------------------------------
Parameters  : value       lower 90%   higher 90%
Photon index: 1.02658     ( -0.310699   0.290644 )
Epeak [keV] : 170.273      ( -59.2595 1105.71 )
Norm@50keV  : 1.32594E-02    ( -0.00347967   0.00511516 )
------------------------------------------------------------
#Fit statistic : Chi-Squared =          57.10 using 59 PHA bins.
# Reduced chi-squared =          1.020 for     56 degrees of freedom
# Null hypothesis probability =   4.341701e-01

Photon flux (15-150 keV)    in 19.47 sec: 1.12101 ( -0.05431  0.05437 ) ph/cm2/s
Energy fluence (15-150 keV)             : 1.77584e-06 ( -9.08451e-08  9.04323e-08 ) ergs/cm2
Band function

Spectral model in the Band function:
------------------------------------------------------------
Parameters  : value       lower 90%   higher 90%
alpha       : 1.11640   ( -1.2583   -0.0836261 )
beta        : -1.44946    ( -0.132585   0.113068 )
Epeak [keV] : 39.3419      ( -10.4597 61.5669 )
Norm@50keV   : 0.390123    ( -0.37943   138.834 )
------------------------------------------------------------
#Fit statistic : Chi-Squared =          53.95 using 59 PHA bins.
# Reduced chi-squared =         0.9808 for     55 degrees of freedom
# Null hypothesis probability =   5.149412e-01

Photon flux (15-150 keV)    in 19.47 sec:  (    ) ph/cm2/s
Energy fluence (15-150 keV)             : 0 ( 0  0 ) ergs/cm2
S(25-50 keV) vs. S(50-100 keV) plot

S(25-50 keV)  = 4.25e-07
S(50-100 keV) = 6.61e-07
T90 vs. Hardness ratio plot
T90                                   = 14.8079999685287 sec.
Hardness ratio (energy fluence ratio) = 1.55529
Color vs. Color plot
Count Ratio  (25-50 keV) / (15-25 keV) = 1.73443
Count Ratio (50-100 keV) / (15-25 keV) = 1.46293
Mask shadow pattern
IMX = -5.500395652468303E-01, IMY = -2.603010638826990E-01
TIME vs. PHA plot around the trigger time
Blue+Cyan dotted lines: Time interval of the scaled map
From 0.000000 to 1.024000
TIME vs. DetID plot around the trigger time
Blue+Cyan dotted lines: Time interval of the scaled map
From 0.000000 to 1.024000
100 us light curve (15-350 keV)

Blue+Cyan dotted lines: Time interval of the scaled map
From 0.000000 to 1.024000
Spacecraft aspect plot

Bright source in the pre-burst/pre-slew/post-slew images
Pre-burst image of 15-350 keV band
Time interval of the image:
-239.800000 -4.572000

# RAcent  DECcent POSerr Theta    Phi  PeakCts   SNR AngSep     Name
#  [deg]    [deg]    ['] [deg]  [deg]                   [']
135.5230 -40.5710   23.6  55.3 -165.4   0.3209   0.5    1.0	Vela X-1
179.2594 -35.6535    2.6  49.0  151.3   3.0364   4.4 ------	UNKNOWN
166.1244 -42.4753    2.4  52.6  166.4   3.6187   4.8 ------	UNKNOWN
125.9360 -38.5098    3.5  57.9 -156.8   3.9294   3.3 ------	UNKNOWN
127.2195  54.8976    3.0  52.0  -31.4   2.2410   3.9 ------	UNKNOWN
Pre-slew background subtracted image of 15-350 keV band
Time interval of the image:
-4.572000 14.900590

# RAcent  DECcent POSerr Theta    Phi  PeakCts   SNR AngSep     Name
#  [deg]    [deg]    ['] [deg]  [deg]                   [']
135.5215 -40.4889   15.5  55.2 -165.4  -0.1471  -0.7    4.0	Vela X-1
169.5984 -20.0508    0.3  31.3  154.7   2.6734  34.9 ------	UNKNOWN
118.6325  -2.0577    2.0  43.0 -111.9   1.1261   5.7 ------	UNKNOWN
Post-slew image of 15-350 keV band
Time interval of the image:
74.100600 962.313100

# RAcent  DECcent POSerr Theta    Phi  PeakCts   SNR AngSep     Name
#  [deg]    [deg]    ['] [deg]  [deg]                   [']
135.6112 -40.4126  153.9  35.4 -166.2   0.0243   0.1    9.3	Vela X-1
170.2906 -60.5816    5.2  40.5  146.0   1.4839   2.2    2.6	Cen X-3
186.6506 -62.7696   69.8  44.3  135.4  -0.1845  -0.2    0.2	GX 301-2
128.9995 -43.1839    1.5  41.0 -167.2   3.1447   7.8 ------	UNKNOWN
105.2056 -38.2555    3.8  57.9 -156.8   5.5015   3.0 ------	UNKNOWN
Plot creation:
Fri Jun 12 01:07:40 EDT 2015