Click here for the BAT GCN circular template
Image
Pre-slew 15.0-350.0 keV image (Event data)

#   RAcent    DECcent   POSerr    Theta     Phi              Peak Cts       SNR   Name
  245.1941     3.5383   0.0187    37.4716   -36.5709         1.2662129     10.261 TRIG_00528443

Foreground time interval of the image:
-20.052  35.781 (delta_t =  55.833 [sec])
Background time interval of the image:
-239.320 -20.052 (delta_t = 219.268 [sec])
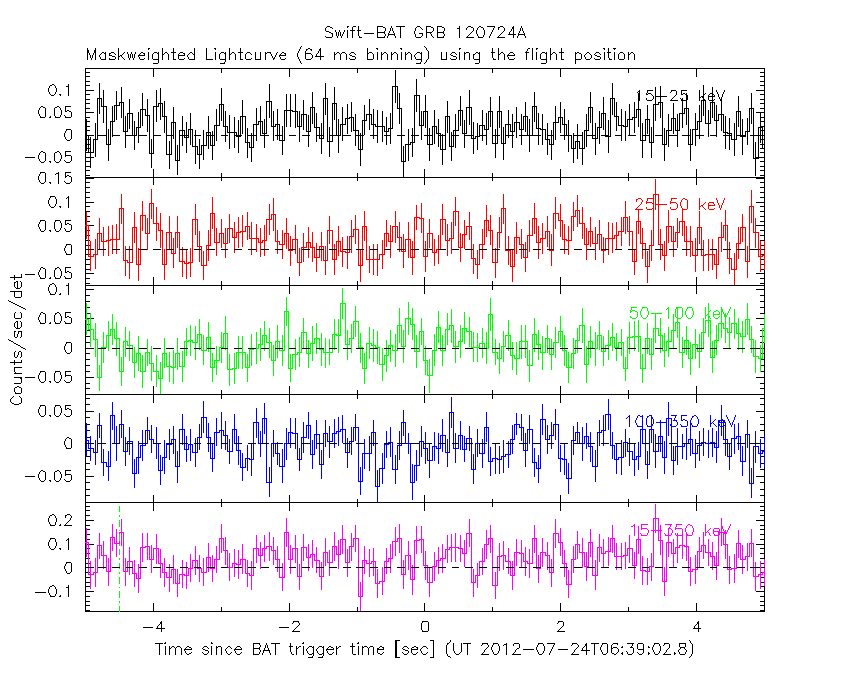
Lightcurves
Notes:
- 1) The mask-weighted light curves are using the flight position.
- 2) Multiple plots of different time binning/intervals are shown to cover all scenarios of short/long GRBs, rate/image triggers, and real/false positives.
- 3) For all the mask-weighted lightcurves, the y-axis units are counts/sec/det where a det is 0.4 x 0.4 = 0.16 sq cm.
- 4) The verticle lines correspond to following: green dotted lines are T50 interval, black dotted lines are T90 interval, blue solid line(s) is a spacecraft slew start time, and orange solid line(s) is a spacecraft slew end time.
- 5) Time of each bin is in the middle of the bin.
1 s binning
From T0-310 s to T0+310 s

From T100_start - 20 s to T100_end + 30 s

Full time interval

64 ms binning
Full time interval

From T100_start to T100_end

From T0-5 sec to T0+5 sec
16 ms binning
From T100_start-5 s to T100_start+5 s

Blue+Cyan dotted lines: Time interval of the scaled map
From 0.000000 to 4.096000
8 ms binning
From T100_start-3 s to T100_start+3 s

Blue+Cyan dotted lines: Time interval of the scaled map
From 0.000000 to 4.096000
2 ms binning
From T100_start-1 s to T100_start+1 s

Blue+Cyan dotted lines: Time interval of the scaled map
From 0.000000 to 4.096000
SN=5 or 10 sec. binning (whichever binning is satisfied first)

SN=5 or 10 sec. binning (T < 200 sec)

Quad-rate summed light curves (from T0-300s to T0+1000s)

The mask-weighted light curves based on cleaned DPHs

Spectral Evolution

Spectra
Notes:
- 1) The fitting includes the systematic errors.
- 2) When the burst includes telescope slew time periods, the fitting uses an average response file made from multiple 5-s response files through out the slew time plus single time preiod for the non-slew times, and weighted by the total counts in the corresponding time period using addrmf. An average response file is needed becuase a spectral fit using the pre-slew DRM will introduce some errors in both a spectral shape and a normalization if the PHA file contains a lot of the slew/post-slew time interval.
- 3) For fits to more complicated models (e.g. a power-law over a cutoff power-law), the BAT team has decided to require a chi-square improvement of more than 6 for each extra dof.
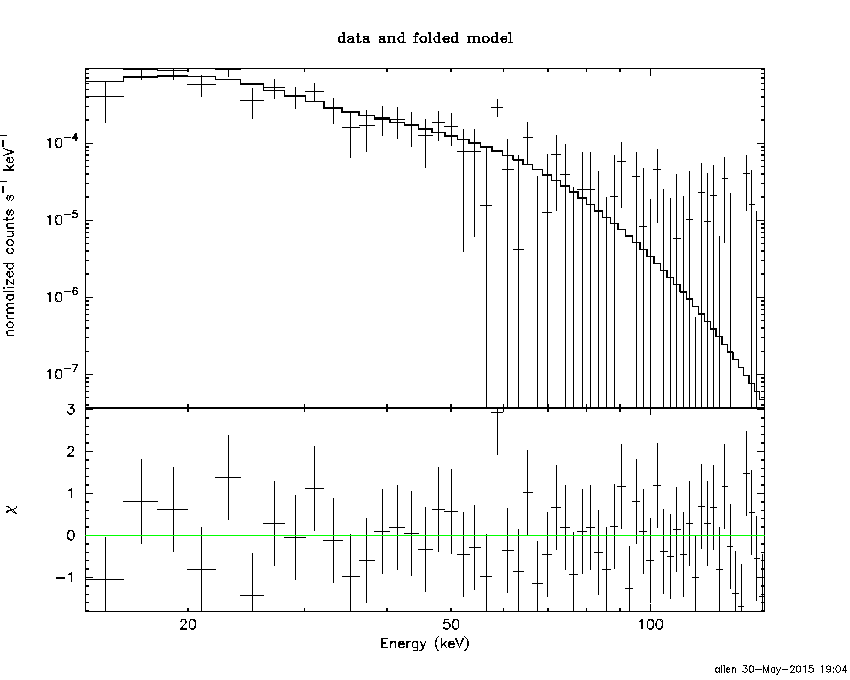
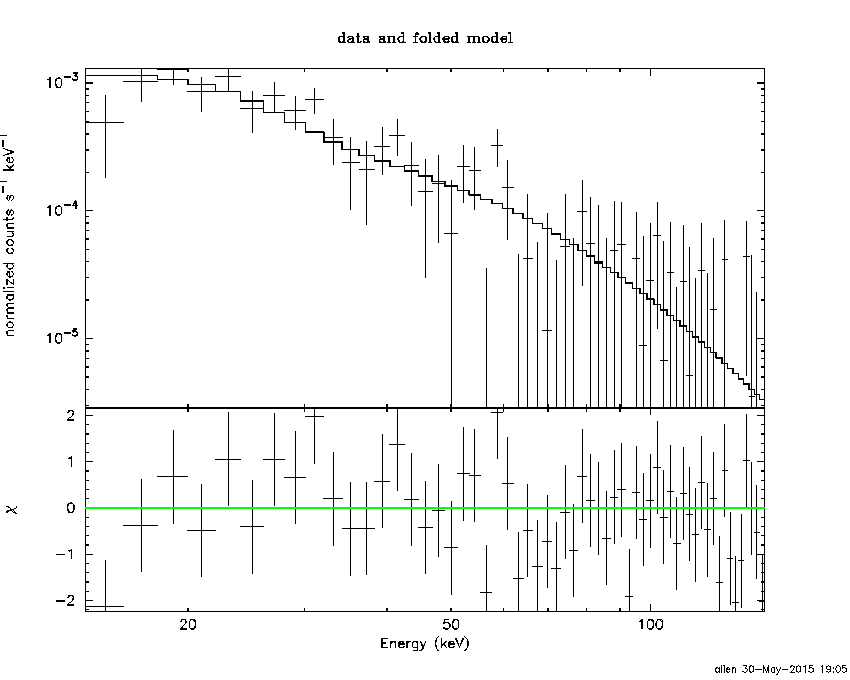
Time averaged spectrum fit using the average DRM
Power-law model

Time interval is from  -20.052 sec. to   78.580 sec.

Spectral model in power-law:
------------------------------------------------------------
Parameters  : value       lower 90%   higher 90%
Photon index: 2.43087     ( -0.24791   0.27029 )
Norm@50keV  : 8.25811E-04    ( -0.000161259   0.00015979 )
------------------------------------------------------------
#Fit statistic : Chi-Squared =          52.12 using 59 PHA bins.
# Reduced chi-squared =         0.9144 for     57 degrees of freedom
# Null hypothesis probability =   6.583683e-01

Photon flux (15-150 keV)    in 98.63 sec: 0.155601 ( -0.0202699  0.0202761 ) ph/cm2/s
Energy fluence (15-150 keV)             : 8.00254e-07 ( -1.21553e-07  1.2537e-07 ) ergs/cm2
Cutoff power-law model

Time interval is from  -20.052 sec. to   78.580 sec.
Spectral model in the cutoff power-law:
------------------------------------------------------------
Parameters  : value       lower 90%   higher 90%
Photon index: 0.746961     ( -1.68606   1.05642 )
Epeak [keV] : 26.7278      ( -25.6719 7.49815 )
Norm@50keV  : 9.45777E-03    ( -0.00945711   0.10851 )
------------------------------------------------------------
#Fit statistic : Chi-Squared =          46.25 using 59 PHA bins.
# Reduced chi-squared =         0.8259 for     56 degrees of freedom
# Null hypothesis probability =   8.204758e-01

Photon flux (15-150 keV)    in 98.63 sec: 0.149246 ( -0.020449  0.020549 ) ph/cm2/s
Energy fluence (15-150 keV)             : 7.07324e-07 ( -1.13521e-07  1.28946e-07 ) ergs/cm2
Band function

Time interval is from  -20.052 sec. to   78.580 sec.

Spectral model in the Band function:
------------------------------------------------------------
Parameters  : value       lower 90%   higher 90%
alpha       : -0.747343   ( -1.29888   1.30096 )
beta        : -10.0000    ( 10   20 )
Epeak [keV] : 26.7195      ( -10.8005 7.51528 )
Norm@50keV   : 9.45312E-03    ( -0.00945311   0.108739 )
------------------------------------------------------------
#Fit statistic : Chi-Squared =          46.25 using 59 PHA bins.
# Reduced chi-squared =         0.8409 for     55 degrees of freedom
# Null hypothesis probability =   7.935740e-01

Photon flux (15-150 keV)    in 98.63 sec: 0.150123 ( 6.84988  -0.021437 ) ph/cm2/s
Energy fluence (15-150 keV)             : 7.05863e-07 ( -7.05173e-07  -1.12968e-07 ) ergs/cm2
Single BB

Spectral model blackbody:
------------------------------------------------------------
Parameters  : value    Lower 90%  Upper 90%
kT [keV]    : 7.80812  (-1.04916  1.19256)
R^2/D10^2   : 0.189277  (-0.0842661   0.155597)
(R is the radius in km and D10 is the distance to the source in units of 10 kpc)
------------------------------------------------------------
#Fit statistic : Chi-Squared =          51.23 using 59 PHA bins.
# Reduced chi-squared =         0.8987 for     57 degrees of freedom
# Null hypothesis probability =   6.904416e-01

Energy  Fluence     90% Error
[keV]   [erg/cm2]   [erg/cm2]
15- 25  2.020e-07   4.631e-08
25- 50  3.388e-07   6.963e-08
50-150  8.208e-08   3.530e-08
15-150  6.229e-07   1.205e-07
Thermal bremsstrahlung (OTTB)

Spectral model: thermal bremsstrahlung
------------------------------------------------------------
Parameters  : value         Lower 90%    Upper 90%
kT [keV]    : 34.4754       (-8.71863      12.9175)
Norm        : 1.12847       (-0.261886     0.356233)
------------------------------------------------------------
#Fit statistic : Chi-Squared =          46.77 using 59 PHA bins.
# Reduced chi-squared =         0.8205 for     57 degrees of freedom
# Null hypothesis probability =   8.312408e-01

Energy  Fluence     90% Error
[keV]   [erg/cm2]   [erg/cm2]
15- 25  2.416e-07   4.123e-08
25- 50  2.969e-07   5.070e-08
50-150  1.936e-07   8.109e-08
15-150  7.321e-07   1.282e-07
Double BB
Spectral model: bbodyrad<1> + bbodyrad<2>
------------------------------------------------------------
Parameters  : value         Lower 90%    Upper 90%
kT1 [keV]   : 4.66132        (-2.1049      2.3968)
R1^2/D10^2  : 0.928210        (-0.69212      10.601)
kT2 [keV]   : 11.4921        (-5.09339      10.4532)
R2^2/D10^2  : 2.59286E-02    (-0.0249451   0.108537)
------------------------------------------------------------
#Fit statistic : Chi-Squared =          45.64 using 59 PHA bins.
# Reduced chi-squared =         0.8299 for     55 degrees of freedom
# Null hypothesis probability =   8.116546e-01

Energy  Fluence     90% Error
[keV]   [erg/cm2]   [erg/cm2]
15- 25  2.378e-07   1.260e-07
25- 50  3.036e-07   1.546e-07
50-150  1.663e-07   1.013e-07
15-150  7.078e-07   3.626e-07
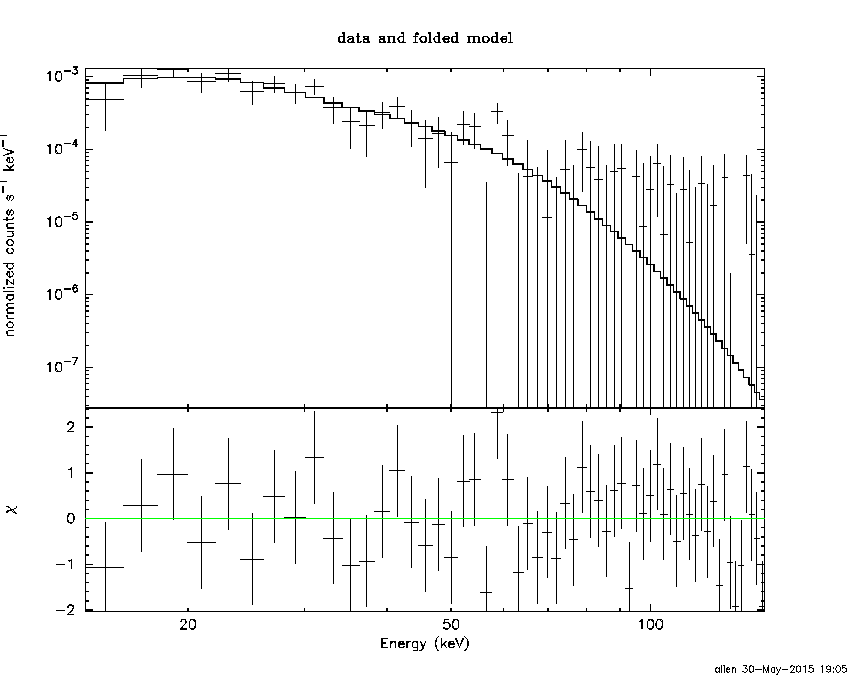
Peak spectrum fit
Power-law model

Time interval is from    7.560 sec. to    8.560 sec.

Spectral model in power-law:
------------------------------------------------------------
Parameters  : value       lower 90%   higher 90%
Photon index: 2.01899     ( -0.454128   0.490746 )
Norm@50keV  : 4.74929E-03    ( -0.0015872   0.00155544 )
------------------------------------------------------------
#Fit statistic : Chi-Squared =          43.95 using 59 PHA bins.
# Reduced chi-squared =         0.7711 for     57 degrees of freedom
# Null hypothesis probability =   8.972684e-01

Photon flux (15-150 keV)    in 1 sec: 0.718865 ( -0.210722  0.211867 ) ph/cm2/s
Energy fluence (15-150 keV)             : 4.38133e-08 ( -1.36538e-08  1.41319e-08 ) ergs/cm2
Cutoff power-law model
Time interval is from    7.560 sec. to    8.560 sec.
Spectral model in the cutoff power-law:
------------------------------------------------------------
Parameters  : value       lower 90%   higher 90%
Photon index: -1.20507     ( -4.88105   2.57132 )
Epeak [keV] : 39.2935      ( -10.241 13.4521 )
Norm@50keV  : 0.379555    ( -0.479827   390.631 )
------------------------------------------------------------
#Fit statistic : Chi-Squared =          38.95 using 59 PHA bins.
# Reduced chi-squared =         0.6955 for     56 degrees of freedom
# Null hypothesis probability =   9.596648e-01

Photon flux (15-150 keV)    in 1 sec: 0.669373 ( -0.204747  0.210783 ) ph/cm2/s
Energy fluence (15-150 keV)             : 3.65554e-08 ( -1.10858e-08  1.30247e-08 ) ergs/cm2
Band function

Time interval is from    7.560 sec. to    8.560 sec.

Spectral model in the Band function:
------------------------------------------------------------
Parameters  : value       lower 90%   higher 90%
alpha       : 4.98691   ( -6.28204   -4.98691 )
beta        : -2.90310    ( 2.9031   0.849561 )
Epeak [keV] : 31.0943      ( -7.86034 8.6193 )
Norm@50keV   : 222.062    ( -59.7333   1223.84 )
------------------------------------------------------------
#Fit statistic : Chi-Squared =          38.86 using 59 PHA bins.
# Reduced chi-squared =         0.7066 for     55 degrees of freedom
# Null hypothesis probability =   9.511627e-01

Photon flux (15-150 keV)    in 1 sec:  (    ) ph/cm2/s
Energy fluence (15-150 keV)             : 0 ( 0  0 ) ergs/cm2
Single BB
Spectral model blackbody:
------------------------------------------------------------
Parameters  : value    Lower 90%  Upper 90%
kT [keV]    : 10.0773  (-2.22236  2.93632)
R^2/D10^2   : 0.359093  (-0.232705   0.603941)
(R is the radius in km and D10 is the distance to the source in units of 10 kpc)
------------------------------------------------------------
#Fit statistic : Chi-Squared =          38.99 using 59 PHA bins.
# Reduced chi-squared =         0.6841 for     57 degrees of freedom
# Null hypothesis probability =   9.672567e-01

Energy  Fluence     90% Error
[keV]   [erg/cm2]   [erg/cm2]
15- 25  7.446e-09   4.598e-09
25- 50  1.871e-08   1.091e-08
50-150  9.987e-09   6.242e-09
15-150  3.615e-08   1.756e-08
Thermal bremsstrahlung (OTTB)

Spectral model: thermal bremsstrahlung
------------------------------------------------------------
Parameters  : value         Lower 90%    Upper 90%
kT [keV]    : 57.0329       (-26.1099      82.0856)
Norm        : 4.01442       (-1.53357     2.27806)
------------------------------------------------------------
#Fit statistic : Chi-Squared =          41.62 using 59 PHA bins.
# Reduced chi-squared =         0.7301 for     57 degrees of freedom
# Null hypothesis probability =   9.372113e-01

Energy  Fluence     90% Error
[keV]   [erg/cm2]   [erg/cm2]
15- 25  1.000e-08   4.770e-09
25- 50  1.498e-08   8.044e-09
50-150  1.633e-08   1.167e-08
15-150  4.132e-08   2.085e-08
Double BB

Spectral model: bbodyrad<1> + bbodyrad<2>
------------------------------------------------------------
Parameters  : value         Lower 90%    Upper 90%
kT1 [keV]   : 7.87723        (-7.8384      -7.8384)
R1^2/D10^2  : 0.374028        (-0.368899      -0.368899)
kT2 [keV]   : 11.7139        (-11.589      -11.589)
R2^2/D10^2  : 0.127364    (-0.169735   -0.169735)
------------------------------------------------------------
#Fit statistic : Chi-Squared =          38.95 using 59 PHA bins.
# Reduced chi-squared =         0.7082 for     55 degrees of freedom
# Null hypothesis probability =   9.501120e-01

Energy  Fluence     90% Error
[keV]   [erg/cm2]   [erg/cm2]
15- 25  7.835e-09   3.300e-07
25- 50  1.834e-08   2.502e-06
50-150  1.092e-08   2.619e-05
15-150  3.709e-08   4.045e-05
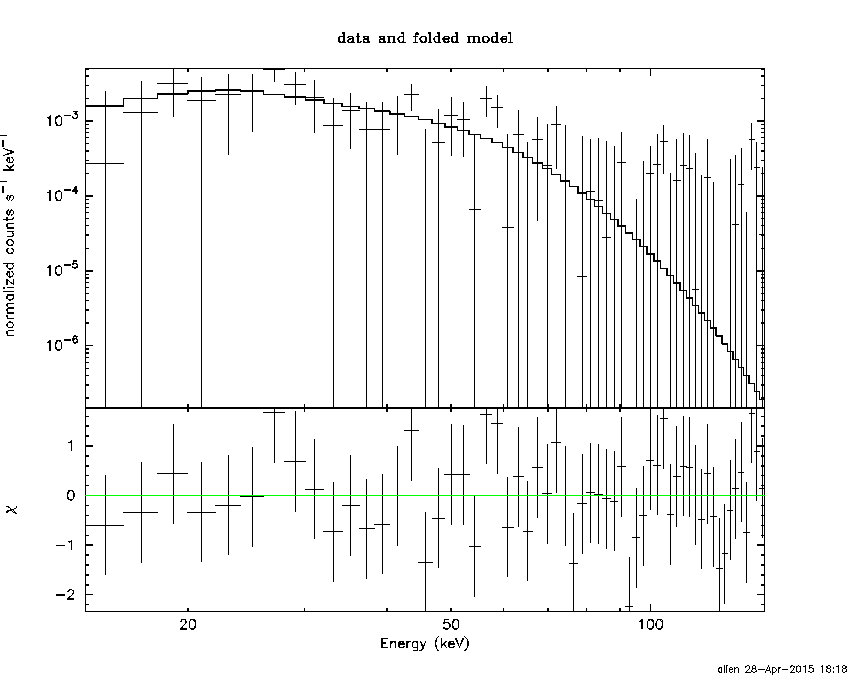
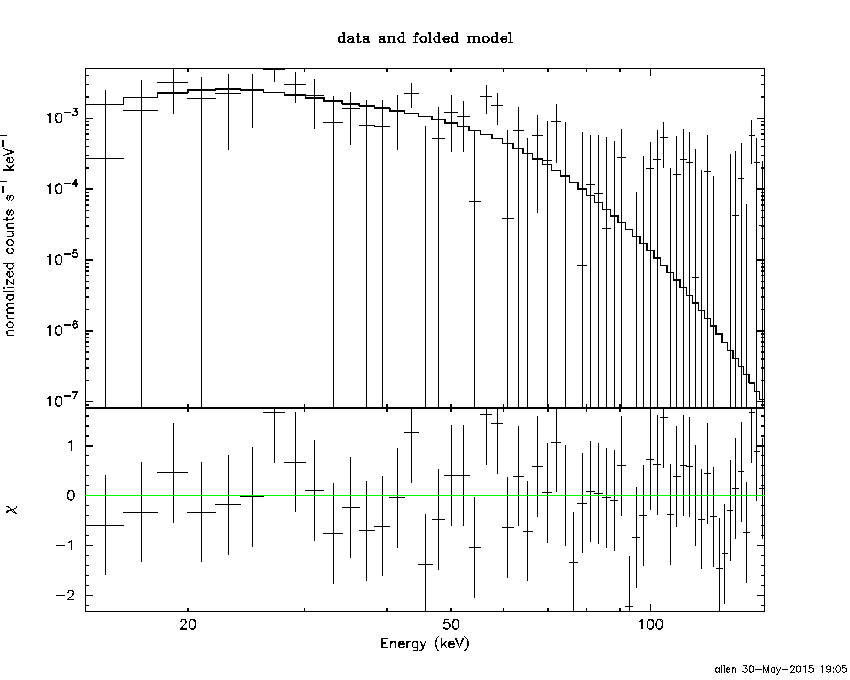
Pre-slew spectrum (Pre-slew PHA with pre-slew DRM)
Power-law model
Spectral model in power-law:
------------------------------------------------------------
Parameters  : value       lower 90%   higher 90%
Photon index: 2.43863     ( -0.251359   0.273664 )
Norm@50keV  : 1.13551E-03    ( -0.000227249   0.000225942 )
------------------------------------------------------------
#Fit statistic : Chi-Squared =          54.75 using 59 PHA bins.
# Reduced chi-squared =         0.9605 for     57 degrees of freedom
# Null hypothesis probability =   5.600831e-01

Photon flux (15-150 keV)    in 55.83 sec: 0.214946 ( -0.0289857  0.0289951 ) ph/cm2/s
Energy fluence (15-150 keV)             : 6.24017e-07 ( -9.75451e-08  1.00671e-07 ) ergs/cm2
Cutoff power-law model
Spectral model in the cutoff power-law:
------------------------------------------------------------
Parameters  : value       lower 90%   higher 90%
Photon index: 9.74036E-02     ( -2.36417   1.57415 )
Epeak [keV] : 27.7979      ( -12.8174 5.57426 )
Norm@50keV  : 3.66130E-02    ( -0.040981   1.4792 )
------------------------------------------------------------
#Fit statistic : Chi-Squared =          46.72 using 59 PHA bins.
# Reduced chi-squared =         0.8343 for     56 degrees of freedom
# Null hypothesis probability =   8.069263e-01

Photon flux (15-150 keV)    in 55.83 sec: 0.204235 ( -0.029121  0.029303 ) ph/cm2/s
Energy fluence (15-150 keV)             : 5.29533e-07 ( -8.64656e-08  1.00693e-07 ) ergs/cm2
Band function

Spectral model in the Band function:
------------------------------------------------------------
Parameters  : value       lower 90%   higher 90%
alpha       : 2.38236   ( -5.3251   -3.75227 )
beta        : -3.21182    ( -4.4942   0.620288 )
Epeak [keV] : 26.1628      ( -5.18147 7.47809 )
Norm@50keV   : 2.67603    ( -2.67313   105.715 )
------------------------------------------------------------
#Fit statistic : Chi-Squared =          46.33 using 59 PHA bins.
# Reduced chi-squared =         0.8424 for     55 degrees of freedom
# Null hypothesis probability =   7.909404e-01

Photon flux (15-150 keV)    in 55.83 sec:  (    ) ph/cm2/s
Energy fluence (15-150 keV)             : 5.66708e-07 ( -5.66317e-07  -1.1474e-07 ) ergs/cm2
S(25-50 keV) vs. S(50-100 keV) plot

S(25-50 keV)  = 2.63e-07
S(50-100 keV) = 1.95e-07
T90 vs. Hardness ratio plot
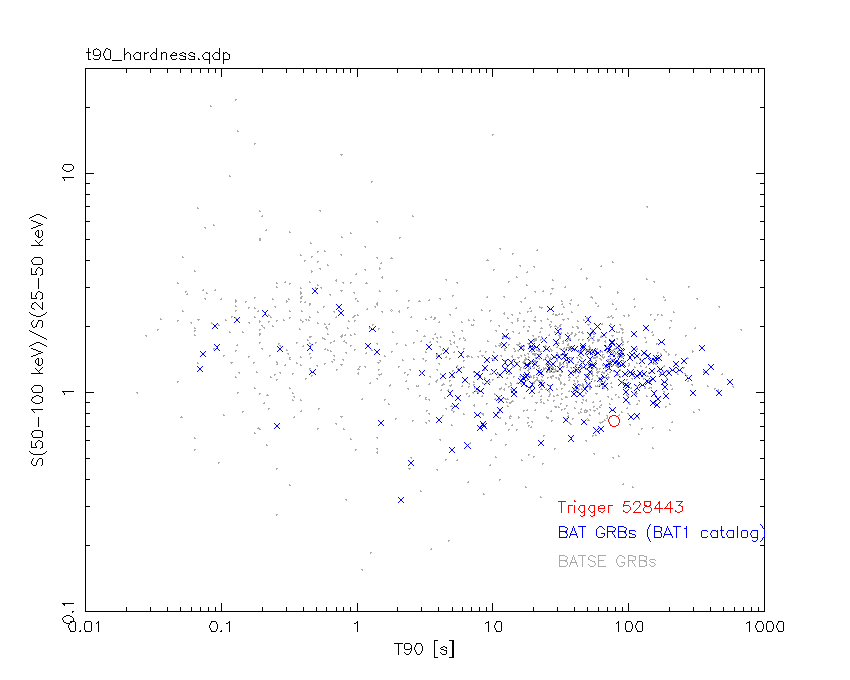
T90                                   = 77.9239999651909 sec.
Hardness ratio (energy fluence ratio) = 0.741445
Color vs. Color plot

Count Ratio  (25-50 keV) / (15-25 keV) = 0.842815
Count Ratio (50-100 keV) / (15-25 keV) = 0.251026
Mask shadow pattern

IMX = 6.156228488082388E-01, IMY = 4.567163788541667E-01
TIME vs. PHA plot around the trigger time

Blue+Cyan dotted lines: Time interval of the scaled map
From 0.000000 to 4.096000
TIME vs. DetID plot around the trigger time

Blue+Cyan dotted lines: Time interval of the scaled map
From 0.000000 to 4.096000
100 us light curve (15-350 keV)
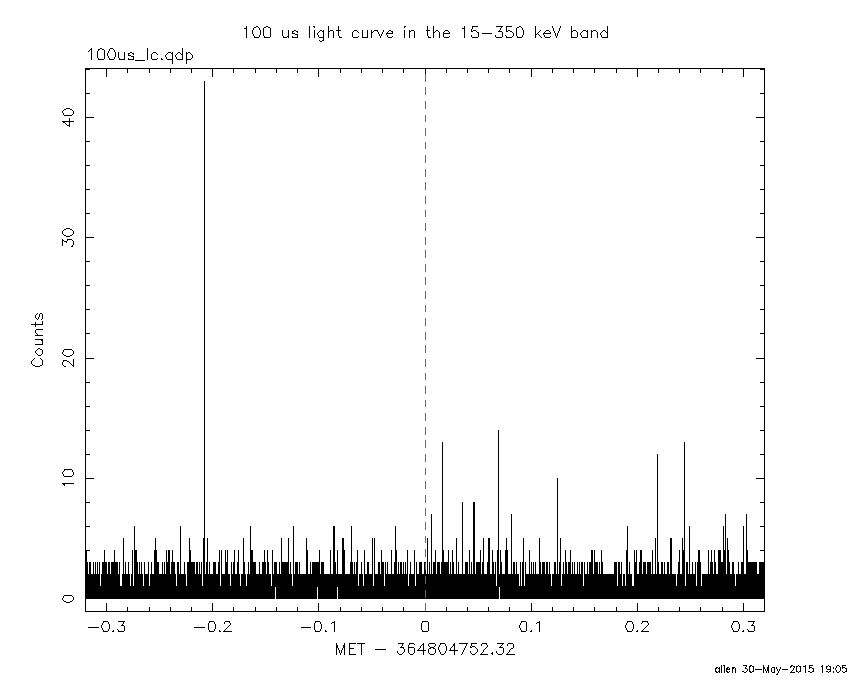
Blue+Cyan dotted lines: Time interval of the scaled map
From 0.000000 to 4.096000
Spacecraft aspect plot

Bright source in the pre-burst/pre-slew/post-slew images
Pre-burst image of 15-350 keV band
Time interval of the image:
-239.320000 -20.052000

# RAcent  DECcent POSerr Theta    Phi  PeakCts   SNR AngSep     Name
#  [deg]    [deg]    ['] [deg]  [deg]                   [']
244.9660 -15.6378    0.4  24.5  -64.7   6.7828  31.0    0.8	Sco X-1
255.9892 -37.8593    1.5  15.7 -136.3   1.3008   7.9    0.9	4U 1700-377
256.4318 -36.3586    3.4  14.4 -133.0   0.5671   3.3    3.9	GX 349+2
262.9629 -24.7535    4.1   5.3  -70.0   0.4997   2.8    2.6	GX 1+4
264.9389 -44.3839    5.9  18.3 -167.6   0.3373   2.0    9.3	4U 1735-44
268.3019  -1.4217    4.2  24.9    3.4   0.5185   2.8    4.4	SW J1753.5-0127
270.1093 -24.9446  133.3   1.9   49.2   0.0148   0.1   12.5	GX 5-1
270.1504 -25.9050    0.0   1.5   77.9  -0.1776  -1.0   12.7	GRS 1758-258
274.0485 -14.1079    2.9  13.2   27.8   0.7219   4.0    5.0	GX 17+2
275.9152 -30.2659    6.6   7.6  127.3   0.2994   1.7    6.1	H1820-303
285.2081 -25.0369   42.8  15.0   92.9  -0.0478  -0.3   11.7	HT1900.1-2455
288.7795  10.9451    1.7  42.1   34.4   2.6972   6.8    1.1	GRS 1915+105
263.0780 -33.8371    4.7   8.9 -144.8   0.4377   2.5    4.4	GX 354-0
298.4104   9.2218    2.9  45.8   47.3   2.9596   4.0 ------	UNKNOWN
291.0058  19.6462    3.1  50.9   31.7   3.8516   3.8 ------	UNKNOWN
265.7048 -28.4091    2.8   3.3 -125.7   0.6758   4.1 ------	UNKNOWN
260.3105  26.3055    2.6  53.2   -5.2   2.1859   4.5 ------	UNKNOWN
Pre-slew background subtracted image of 15-350 keV band
Time interval of the image:
-20.052000 35.780600

# RAcent  DECcent POSerr Theta    Phi  PeakCts   SNR AngSep     Name
#  [deg]    [deg]    ['] [deg]  [deg]                   [']
244.8327 -15.5767    3.7  24.6  -64.8  -0.3239  -3.1    9.3	Sco X-1
255.9956 -37.8434    3.5  15.7 -136.3   0.2599   3.3    0.4	4U 1700-377
256.6152 -36.5646   18.1  14.4 -134.0   0.0488   0.6   12.1	GX 349+2
262.8396 -24.6007    0.0   5.5  -68.9  -0.1235  -1.6   12.7	GX 1+4
264.5862 -44.5646   10.2  18.5 -166.9   0.0872   1.1    9.6	4U 1735-44
268.4923  -1.2943    0.0  25.0    3.8  -0.1523  -1.7   12.1	SW J1753.5-0127
270.3975 -24.9201   12.1   2.1   53.7  -0.0728  -1.0   11.4	GX 5-1
270.2249 -25.7696    7.3   1.6   73.8   0.1239   1.6    4.5	GRS 1758-258
273.8741 -14.1981    5.2  13.1   27.3   0.1742   2.2   12.4	GX 17+2
275.7315 -30.2392    0.0   7.4  127.7   0.0231   0.3   12.6	H1820-303
284.9231 -25.0149    6.5  14.8   92.6  -0.1550  -1.8    8.4	HT1900.1-2455
288.9694  10.8054    0.0  42.1   34.8  -0.0208  -0.1   13.1	GRS 1915+105
263.0177 -33.7638   10.2   8.9 -144.3   0.0873   1.1    4.5	GX 354-0
271.0477 -50.2120    2.4  24.0 -179.8   0.3820   4.9 ------	UNKNOWN
264.1968  19.5757    2.3  46.1   -1.7   0.7610   5.0 ------	UNKNOWN
258.0443 -53.1768    2.2  28.0 -162.4   0.4386   5.4 ------	UNKNOWN
245.1941   3.5383    1.1  37.5  -36.6   1.2663  10.3 ------	UNKNOWN
242.8152   0.9756    1.8  36.9  -42.3   0.7824   6.5 ------	UNKNOWN
Post-slew image of 15-350 keV band
Time interval of the image:
97.780590 962.728400

# RAcent  DECcent POSerr Theta    Phi  PeakCts   SNR AngSep     Name
#  [deg]    [deg]    ['] [deg]  [deg]                   [']
244.9852 -15.6416    0.2  19.2  156.4  31.8344  62.1    0.3	Sco X-1
254.5075  35.1567    0.0  32.8  -10.2  -0.1806  -0.3   11.4	Her X-1
255.9883 -37.8285    2.2  42.5  143.1   8.8252   5.1    0.9	4U 1700-377
256.3629 -36.5279    9.8  41.4  142.1   1.9383   1.2    7.2	GX 349+2
263.1001 -24.9026   13.4  33.3  125.2  -0.8674  -0.9   10.6	GX 1+4
268.4212  -1.5009    3.7  23.7   77.5   1.9064   3.1    4.3	SW J1753.5-0127
270.0849 -25.1572    2.9  37.5  116.9  -5.2694  -4.0   11.8	GX 5-1
270.4513 -25.7480    6.8  38.1  117.2   2.4448   1.7    8.0	GRS 1758-258
274.0146 -13.9992    8.3  33.5   97.8   1.6389   1.4    2.3	GX 17+2
288.8161  10.9225    2.7  43.8   53.5   9.5818   4.3    1.7	GRS 1915+105
262.8571 -33.7674   23.5  40.8  133.0  -0.8672  -0.5    7.7	GX 354-0
273.6295  33.2088    3.2  39.8   14.1   2.9171   3.6 ------	UNKNOWN
261.3945  17.5403    2.7  21.2   23.0   2.1898   4.2 ------	UNKNOWN
217.4596 -43.4626    2.8  53.2 -179.4   7.1211   4.1 ------	UNKNOWN
210.8660   4.8138    2.4  34.3 -110.9   4.9028   4.8 ------	UNKNOWN
245.2197  62.4531    3.3  58.9  -24.3  14.9835   3.6 ------	UNKNOWN
198.6456  -8.3761    3.3  48.0 -128.9   9.4021   3.5 ------	UNKNOWN
Plot creation:
Sat May 30 19:06:16 EDT 2015