Special notes of this burst
Image
Pre-slew 15.0-350.0 keV image (Event data)

#   RAcent    DECcent   POSerr    Theta     Phi              Peak Cts       SNR   Name
   44.8327    13.7620   0.0076    32.3021   -45.9966         2.7447121     25.421 TRIG_00529486

Foreground time interval of the image:
-35.680  15.981 (delta_t =  51.661 [sec])
Background time interval of the image:
-239.120 -35.680 (delta_t = 203.440 [sec])
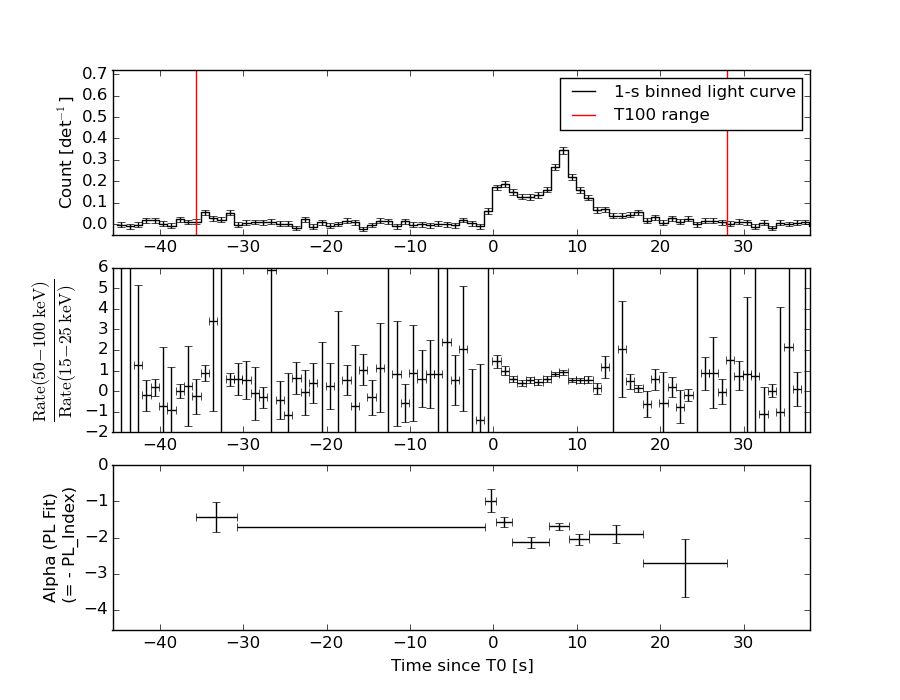
Lightcurves
Notes:
- 1) The mask-weighted light curves are using the flight position.
- 2) Multiple plots of different time binning/intervals are shown to cover all scenarios of short/long GRBs, rate/image triggers, and real/false positives.
- 3) For all the mask-weighted lightcurves, the y-axis units are counts/sec/det where a det is 0.4 x 0.4 = 0.16 sq cm.
- 4) The verticle lines correspond to following: green dotted lines are T50 interval, black dotted lines are T90 interval, blue solid line(s) is a spacecraft slew start time, and orange solid line(s) is a spacecraft slew end time.
- 5) Time of each bin is in the middle of the bin.
1 s binning
From T0-310 s to T0+310 s

From T100_start - 20 s to T100_end + 30 s

Full time interval

64 ms binning
Full time interval
From T100_start to T100_end

From T0-5 sec to T0+5 sec

16 ms binning
From T100_start-5 s to T100_start+5 s
Blue+Cyan dotted lines: Time interval of the scaled map
From 0.000000 to 1.024000
8 ms binning
From T100_start-3 s to T100_start+3 s

Blue+Cyan dotted lines: Time interval of the scaled map
From 0.000000 to 1.024000
2 ms binning
From T100_start-1 s to T100_start+1 s

Blue+Cyan dotted lines: Time interval of the scaled map
From 0.000000 to 1.024000
SN=5 or 10 sec. binning (whichever binning is satisfied first)

SN=5 or 10 sec. binning (T < 200 sec)
Quad-rate summed light curves (from T0-300s to T0+1000s)

The mask-weighted light curves based on cleaned DPHs

Spectral Evolution
Spectra
Notes:
- 1) The fitting includes the systematic errors.
- 2) When the burst includes telescope slew time periods, the fitting uses an average response file made from multiple 5-s response files through out the slew time plus single time preiod for the non-slew times, and weighted by the total counts in the corresponding time period using addrmf. An average response file is needed becuase a spectral fit using the pre-slew DRM will introduce some errors in both a spectral shape and a normalization if the PHA file contains a lot of the slew/post-slew time interval.
- 3) For fits to more complicated models (e.g. a power-law over a cutoff power-law), the BAT team has decided to require a chi-square improvement of more than 6 for each extra dof.
Time averaged spectrum fit using the average DRM
Power-law model
Time interval is from  -35.680 sec. to   27.952 sec.

Spectral model in power-law:
------------------------------------------------------------
Parameters  : value       lower 90%   higher 90%
Photon index: 1.84527     ( -0.100588   0.102385 )
Norm@50keV  : 2.96943E-03    ( -0.000181775   0.000180288 )
------------------------------------------------------------
#Fit statistic : Chi-Squared =          58.68 using 59 PHA bins.
# Reduced chi-squared =          1.030 for     57 degrees of freedom
# Null hypothesis probability =   4.135033e-01

Photon flux (15-150 keV)    in 63.63 sec: 0.416585 ( -0.0235833  0.0236209 ) ph/cm2/s
Energy fluence (15-150 keV)             : 1.73742e-06 ( -1.06739e-07  1.07469e-07 ) ergs/cm2
Cutoff power-law model

Time interval is from  -35.680 sec. to   27.952 sec.
Spectral model in the cutoff power-law:
------------------------------------------------------------
Parameters  : value       lower 90%   higher 90%
Photon index: 1.21810     ( -0.497494   0.441783 )
Epeak [keV] : 57.2574      ( -9.44075 29.9469 )
Norm@50keV  : 6.42760E-03    ( -0.00265521   0.00534249 )
------------------------------------------------------------
#Fit statistic : Chi-Squared =          52.57 using 59 PHA bins.
# Reduced chi-squared =         0.9388 for     56 degrees of freedom
# Null hypothesis probability =   6.054401e-01

Photon flux (15-150 keV)    in 63.63 sec: 0.402845 ( -0.025452  0.025398 ) ph/cm2/s
Energy fluence (15-150 keV)             : 1.64277e-06 ( -1.24002e-07  1.2537e-07 ) ergs/cm2
Band function
Time interval is from  -35.680 sec. to   27.952 sec.

Spectral model in the Band function:
------------------------------------------------------------
Parameters  : value       lower 90%   higher 90%
alpha       : -1.04201   ( -0.533932   0.764739 )
beta        : -2.28341    ( 2.29121   0.331257 )
Epeak [keV] : 51.7047      ( -11.3707 22.8276 )
Norm@50keV   : 8.22800E-03    ( -0.00469064   0.0154216 )
------------------------------------------------------------
#Fit statistic : Chi-Squared =          51.56 using 59 PHA bins.
# Reduced chi-squared =         0.9374 for     55 degrees of freedom
# Null hypothesis probability =   6.069394e-01

Photon flux (15-150 keV)    in 63.63 sec:  (    ) ph/cm2/s
Energy fluence (15-150 keV)             : 1.64956e-06 ( -1.64912e-06  -1.19701e-07 ) ergs/cm2
Single BB
Spectral model blackbody:
------------------------------------------------------------
Parameters  : value    Lower 90%  Upper 90%
kT [keV]    : 11.9450  (-0.739757  0.793129)
R^2/D10^2   : 9.95643E-02  (-0.0214671   0.0271884)
(R is the radius in km and D10 is the distance to the source in units of 10 kpc)
------------------------------------------------------------
#Fit statistic : Chi-Squared =         102.35 using 59 PHA bins.
# Reduced chi-squared =         1.7956 for     57 degrees of freedom
# Null hypothesis probability =   2.148199e-04

Energy  Fluence     90% Error
[keV]   [erg/cm2]   [erg/cm2]
15- 25  1.911e-07   1.982e-08
25- 50  5.982e-07   4.193e-08
50-150  5.116e-07   6.576e-08
15-150  1.301e-06   8.749e-08
Thermal bremsstrahlung (OTTB)
Spectral model: thermal bremsstrahlung
------------------------------------------------------------
Parameters  : value         Lower 90%    Upper 90%
kT [keV]    : 92.5818       (-16.618      23.1532)
Norm        : 1.86437       (-0.151812     0.169694)
------------------------------------------------------------
#Fit statistic : Chi-Squared =          52.63 using 59 PHA bins.
# Reduced chi-squared =         0.9233 for     57 degrees of freedom
# Null hypothesis probability =   6.397010e-01

Energy  Fluence     90% Error
[keV]   [erg/cm2]   [erg/cm2]
15- 25  3.098e-07   3.169e-08
25- 50  5.271e-07   3.315e-08
50-150  8.166e-07   2.491e-07
15-150  1.654e-06   2.558e-07
Double BB

Spectral model: bbodyrad<1> + bbodyrad<2>
------------------------------------------------------------
Parameters  : value         Lower 90%    Upper 90%
kT1 [keV]   : 4.72202        (-1.14284      2.16975)
R1^2/D10^2  : 1.78429        (-1.29584      4.26242)
kT2 [keV]   : 16.0464        (-2.00105      4.78602)
R2^2/D10^2  : 2.75210E-02    (-0.0187497   0.0237836)
------------------------------------------------------------
#Fit statistic : Chi-Squared =          57.75 using 59 PHA bins.
# Reduced chi-squared =          1.050 for     55 degrees of freedom
# Null hypothesis probability =   3.739888e-01

Energy  Fluence     90% Error
[keV]   [erg/cm2]   [erg/cm2]
15- 25  3.116e-07   1.134e-07
25- 50  5.166e-07   9.614e-08
50-150  7.119e-07   1.230e-07
15-150  1.540e-06   2.669e-07
Peak spectrum fit
Power-law model
Time interval is from    7.940 sec. to    8.940 sec.

Spectral model in power-law:
------------------------------------------------------------
Parameters  : value       lower 90%   higher 90%
Photon index: 1.65906     ( -0.122207   0.124378 )
Norm@50keV  : 2.31435E-02    ( -0.00175725   0.00174509 )
------------------------------------------------------------
#Fit statistic : Chi-Squared =          60.78 using 59 PHA bins.
# Reduced chi-squared =          1.066 for     57 degrees of freedom
# Null hypothesis probability =   3.412683e-01

Photon flux (15-150 keV)    in 1 sec: 3.03106 ( -0.221184  0.221416 ) ph/cm2/s
Energy fluence (15-150 keV)             : 2.15047e-07 ( -1.72213e-08  1.73419e-08 ) ergs/cm2
Cutoff power-law model

Time interval is from    7.940 sec. to    8.940 sec.
Spectral model in the cutoff power-law:
------------------------------------------------------------
Parameters  : value       lower 90%   higher 90%
Photon index: 1.19407     ( -0.531044   0.469511 )
Epeak [keV] : 84.0566      ( -23.3221 915.148 )
Norm@50keV  : 4.04226E-02    ( -0.0170437   0.0353324 )
------------------------------------------------------------
#Fit statistic : Chi-Squared =          57.91 using 59 PHA bins.
# Reduced chi-squared =          1.034 for     56 degrees of freedom
# Null hypothesis probability =   4.045862e-01

Photon flux (15-150 keV)    in 1 sec: 2.97621 ( -0.22798  0.22796 ) ph/cm2/s
Energy fluence (15-150 keV)             : 2.08238e-07 ( -1.8867e-08  1.8795e-08 ) ergs/cm2
Band function

Time interval is from    7.940 sec. to    8.940 sec.

Spectral model in the Band function:
------------------------------------------------------------
Parameters  : value       lower 90%   higher 90%
alpha       : -1.19384   ( -0.3426   0.525644 )
beta        : -10.0000    ( 10   3.55271e-15 )
Epeak [keV] : 84.0299      ( -19.9379 1290.38 )
Norm@50keV   : 4.04280E-02    ( -0.0170579   0.035335 )
------------------------------------------------------------
#Fit statistic : Chi-Squared =          57.91 using 59 PHA bins.
# Reduced chi-squared =          1.053 for     55 degrees of freedom
# Null hypothesis probability =   3.683524e-01

Photon flux (15-150 keV)    in 1 sec: 2.97216 ( 4.02784  -0.22383 ) ph/cm2/s
Energy fluence (15-150 keV)             : 2.08174e-07 ( -2.08167e-07  -1.8312e-08 ) ergs/cm2
Single BB
Spectral model blackbody:
------------------------------------------------------------
Parameters  : value    Lower 90%  Upper 90%
kT [keV]    : 12.8072  (-1.12911  1.27791)
R^2/D10^2   : 0.588000  (-0.1725   0.236174)
(R is the radius in km and D10 is the distance to the source in units of 10 kpc)
------------------------------------------------------------
#Fit statistic : Chi-Squared =          98.63 using 59 PHA bins.
# Reduced chi-squared =          1.730 for     57 degrees of freedom
# Null hypothesis probability =   5.179914e-04

Energy  Fluence     90% Error
[keV]   [erg/cm2]   [erg/cm2]
15- 25  2.046e-08   2.645e-09
25- 50  6.932e-08   6.220e-09
50-150  7.125e-08   1.162e-08
15-150  1.610e-07   1.350e-08
Thermal bremsstrahlung (OTTB)
Spectral model: thermal bremsstrahlung
------------------------------------------------------------
Parameters  : value         Lower 90%    Upper 90%
kT [keV]    : 150.192       (-43.3008      -149.063)
Norm        : 12.4963       (-1.00646     1.24118)
------------------------------------------------------------
#Fit statistic : Chi-Squared =          57.97 using 59 PHA bins.
# Reduced chi-squared =          1.017 for     57 degrees of freedom
# Null hypothesis probability =   4.392643e-01

Energy  Fluence     90% Error
[keV]   [erg/cm2]   [erg/cm2]
15- 25  3.209e-08   3.140e-09
25- 50  5.949e-08   1.144e-08
50-150  1.175e-07   4.711e-08
15-150  2.091e-07   6.095e-08
Double BB

Spectral model: bbodyrad<1> + bbodyrad<2>
------------------------------------------------------------
Parameters  : value         Lower 90%    Upper 90%
kT1 [keV]   : 8.07061        (-1.36324      1.39239)
R1^2/D10^2  : 2.23775        (-0.89067      1.81447)
kT2 [keV]   : 29.2936        (-6.82042      13.2901)
R2^2/D10^2  : 2.05994E-02    (-0.0146498   0.0351688)
------------------------------------------------------------
#Fit statistic : Chi-Squared =          55.22 using 59 PHA bins.
# Reduced chi-squared =          1.004 for     55 degrees of freedom
# Null hypothesis probability =   4.663484e-01

Energy  Fluence     90% Error
[keV]   [erg/cm2]   [erg/cm2]
15- 25  2.933e-08   6.785e-09
25- 50  6.428e-08   1.333e-08
50-150  1.176e-07   5.383e-08
15-150  2.112e-07   6.977e-08
Pre-slew spectrum (Pre-slew PHA with pre-slew DRM)
Power-law model
Spectral model in power-law:
------------------------------------------------------------
Parameters  : value       lower 90%   higher 90%
Photon index: 1.77534     ( -0.0961446   0.0975465 )
Norm@50keV  : 3.41589E-03    ( -0.000200817   0.000199546 )
------------------------------------------------------------
#Fit statistic : Chi-Squared =          71.93 using 59 PHA bins.
# Reduced chi-squared =          1.262 for     57 degrees of freedom
# Null hypothesis probability =   8.791885e-02

Photon flux (15-150 keV)    in 51.66 sec: 0.466276 ( -0.0259598  0.0260005 ) ph/cm2/s
Energy fluence (15-150 keV)             : 1.62618e-06 ( -9.80156e-08  9.86153e-08 ) ergs/cm2
Cutoff power-law model
Spectral model in the cutoff power-law:
------------------------------------------------------------
Parameters  : value       lower 90%   higher 90%
Photon index: 0.954961     ( -0.500322   0.44503 )
Epeak [keV] : 59.1546      ( -8.15411 18.1345 )
Norm@50keV  : 9.30103E-03    ( -0.00384499   0.00770242 )
------------------------------------------------------------
#Fit statistic : Chi-Squared =          61.16 using 59 PHA bins.
# Reduced chi-squared =          1.092 for     56 degrees of freedom
# Null hypothesis probability =   2.960565e-01

Photon flux (15-150 keV)    in 51.66 sec: 0.447301 ( -0.02784  0.027805 ) ph/cm2/s
Energy fluence (15-150 keV)             : 1.51643e-06 ( -1.12014e-07  1.13575e-07 ) ergs/cm2
Band function

Spectral model in the Band function:
------------------------------------------------------------
Parameters  : value       lower 90%   higher 90%
alpha       : -0.725416   ( -0.572315   0.763318 )
beta        : -2.33762    ( 2.3481   0.356536 )
Epeak [keV] : 53.0792      ( -10.0181 17.1194 )
Norm@50keV   : 1.28360E-02    ( -0.00647253   0.0238926 )
------------------------------------------------------------
#Fit statistic : Chi-Squared =          59.93 using 59 PHA bins.
# Reduced chi-squared =          1.090 for     55 degrees of freedom
# Null hypothesis probability =   3.014343e-01

Photon flux (15-150 keV)    in 51.66 sec:  (    ) ph/cm2/s
Energy fluence (15-150 keV)             : 1.52813e-06 ( -1.52777e-06  -1.09152e-07 ) ergs/cm2
S(25-50 keV) vs. S(50-100 keV) plot

S(25-50 keV)  = 4.97e-07
S(50-100 keV) = 5.54e-07
T90 vs. Hardness ratio plot

T90                                   = 50.2880000472069 sec.
Hardness ratio (energy fluence ratio) = 1.11469
Color vs. Color plot

Count Ratio  (25-50 keV) / (15-25 keV) = 1.24243
Count Ratio (50-100 keV) / (15-25 keV) = 0.704864
Mask shadow pattern

IMX = 4.392073192457991E-01, IMY = 4.547580763038182E-01
TIME vs. PHA plot around the trigger time

Blue+Cyan dotted lines: Time interval of the scaled map
From 0.000000 to 1.024000
TIME vs. DetID plot around the trigger time

Blue+Cyan dotted lines: Time interval of the scaled map
From 0.000000 to 1.024000
100 us light curve (15-350 keV)

Blue+Cyan dotted lines: Time interval of the scaled map
From 0.000000 to 1.024000
Spacecraft aspect plot
Bright source in the pre-burst/pre-slew/post-slew images
Pre-burst image of 15-350 keV band
Time interval of the image:
-239.120000 -35.680000

# RAcent  DECcent POSerr Theta    Phi  PeakCts   SNR AngSep     Name
#  [deg]    [deg]    ['] [deg]  [deg]                   [']
326.3360  38.3329   27.1  42.0  157.3   0.1313   0.4    7.8	Cyg X-2
331.1518  50.3189    2.7  42.3  175.9   0.9857   4.3 ------	UNKNOWN
 45.8008 -17.2387    2.9  51.6   -8.4   1.3067   4.1 ------	UNKNOWN
Pre-slew background subtracted image of 15-350 keV band
Time interval of the image:
-35.680000 15.980590

# RAcent  DECcent POSerr Theta    Phi  PeakCts   SNR AngSep     Name
#  [deg]    [deg]    ['] [deg]  [deg]                   [']
326.2827  38.1698    9.9  42.0  157.1   0.1642   1.2   10.5	Cyg X-2
350.0969  10.1989    1.8  24.2   97.7   0.6013   6.4 ------	UNKNOWN
 49.3809 -21.2437    2.6  56.8   -8.3   1.3935   4.4 ------	UNKNOWN
 44.8327  13.7620    0.5  32.3  -46.0   2.7446  25.4 ------	UNKNOWN
 35.7111  39.7690    2.2  26.6 -102.1   0.5136   5.3 ------	UNKNOWN
Post-slew image of 15-350 keV band
Time interval of the image:
68.580590 879.380600

# RAcent  DECcent POSerr Theta    Phi  PeakCts   SNR AngSep     Name
#  [deg]    [deg]    ['] [deg]  [deg]                   [']
 83.6279  22.0115    0.5  37.7  -91.4  33.1795  24.7    0.3	Crab
 14.3382  12.9831    2.7  29.7  109.1   2.8728   4.3 ------	UNKNOWN
 39.9335   0.8464    3.0  13.8   37.9   1.3505   3.8 ------	UNKNOWN
 57.5995 -40.2271    2.5  55.3    5.1   7.2840   4.6 ------	UNKNOWN
 58.4875 -41.5812    3.1  56.7    4.7   7.1237   3.7 ------	UNKNOWN
 36.3700  41.1525    2.3  28.4 -176.6   2.0023   4.9 ------	UNKNOWN
 77.5823 -14.2171    2.7  42.8  -33.6   2.7597   4.2 ------	UNKNOWN
Plot creation:
Sat May 30 18:59:04 EDT 2015