Special notes of this burst
Image
Pre-slew 15.0-350.0 keV image (Event data)

#   RAcent    DECcent   POSerr    Theta     Phi              Peak Cts       SNR   Name
  257.1795   -22.7234   0.0100    15.7422     9.0098         1.4662310     19.241 TRIG_00530581

Foreground time interval of the image:
-14.200  22.184 (delta_t =  36.384 [sec])
Background time interval of the image:
-87.347 -14.200 (delta_t =  73.147 [sec])
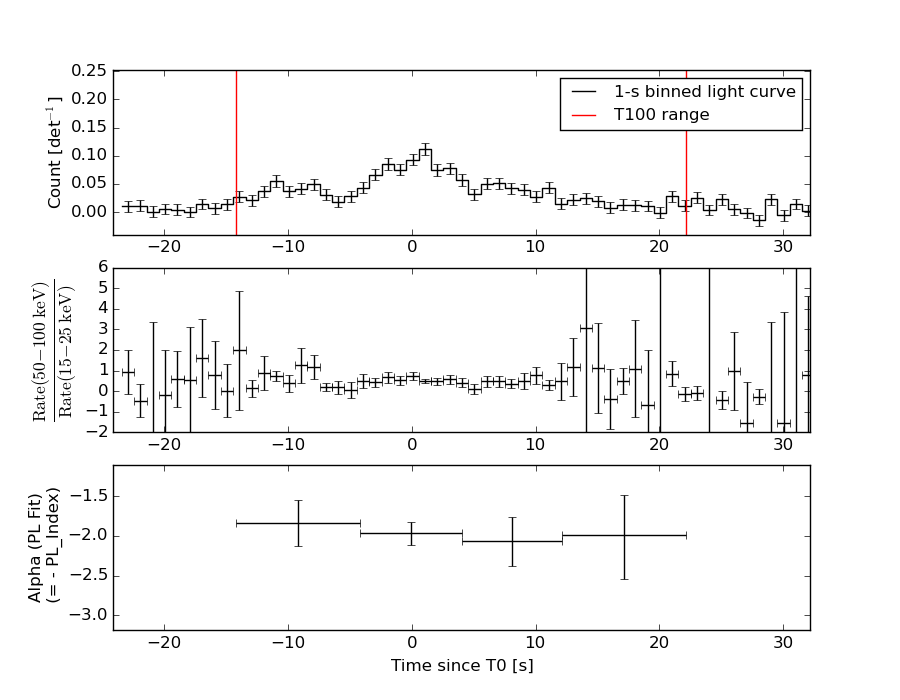
Lightcurves
Notes:
- 1) The mask-weighted light curves are using the flight position.
- 2) Multiple plots of different time binning/intervals are shown to cover all scenarios of short/long GRBs, rate/image triggers, and real/false positives.
- 3) For all the mask-weighted lightcurves, the y-axis units are counts/sec/det where a det is 0.4 x 0.4 = 0.16 sq cm.
- 4) The verticle lines correspond to following: green dotted lines are T50 interval, black dotted lines are T90 interval, blue solid line(s) is a spacecraft slew start time, and orange solid line(s) is a spacecraft slew end time.
- 5) Time of each bin is in the middle of the bin.
1 s binning
From T0-310 s to T0+310 s

From T100_start - 20 s to T100_end + 30 s
Full time interval
64 ms binning
Full time interval

From T100_start to T100_end
From T0-5 sec to T0+5 sec

16 ms binning
From T100_start-5 s to T100_start+5 s

Blue+Cyan dotted lines: Time interval of the scaled map
From 0.000000 to 1.024000
8 ms binning
From T100_start-3 s to T100_start+3 s

Blue+Cyan dotted lines: Time interval of the scaled map
From 0.000000 to 1.024000
2 ms binning
From T100_start-1 s to T100_start+1 s

Blue+Cyan dotted lines: Time interval of the scaled map
From 0.000000 to 1.024000
SN=5 or 10 sec. binning (whichever binning is satisfied first)
SN=5 or 10 sec. binning (T < 200 sec)

Quad-rate summed light curves (from T0-300s to T0+1000s)
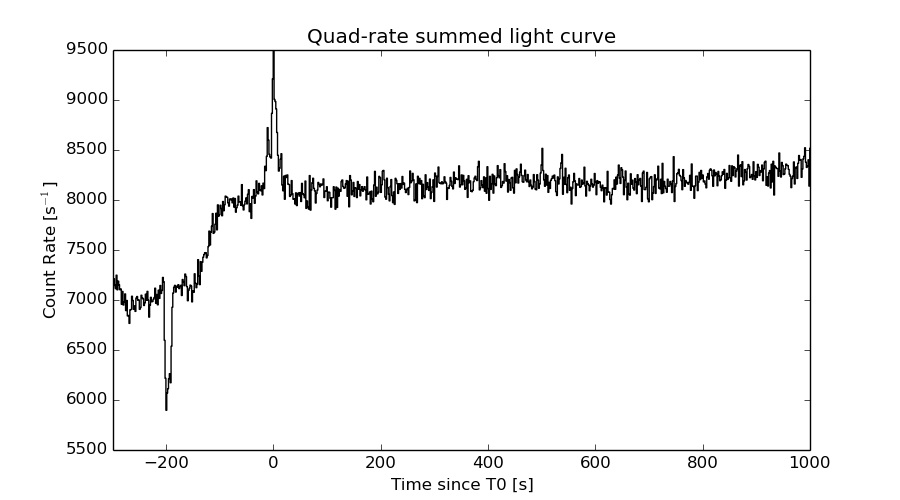
The mask-weighted light curves based on cleaned DPHs

Spectral Evolution
Spectra
Notes:
- 1) The fitting includes the systematic errors.
- 2) When the burst includes telescope slew time periods, the fitting uses an average response file made from multiple 5-s response files through out the slew time plus single time preiod for the non-slew times, and weighted by the total counts in the corresponding time period using addrmf. An average response file is needed becuase a spectral fit using the pre-slew DRM will introduce some errors in both a spectral shape and a normalization if the PHA file contains a lot of the slew/post-slew time interval.
- 3) For fits to more complicated models (e.g. a power-law over a cutoff power-law), the BAT team has decided to require a chi-square improvement of more than 6 for each extra dof.
Time averaged spectrum fit using the average DRM
Power-law model

Time interval is from  -14.200 sec. to   22.184 sec.

Spectral model in power-law:
------------------------------------------------------------
Parameters  : value       lower 90%   higher 90%
Photon index: 1.95746     ( -0.133917   0.136902 )
Norm@50keV  : 2.24746E-03    ( -0.000183531   0.000180831 )
------------------------------------------------------------
#Fit statistic : Chi-Squared =          51.54 using 59 PHA bins.
# Reduced chi-squared =         0.9042 for     57 degrees of freedom
# Null hypothesis probability =   6.793818e-01

Photon flux (15-150 keV)    in 36.38 sec: 0.330693 ( -0.0232016  0.0232541 ) ph/cm2/s
Energy fluence (15-150 keV)             : 7.52615e-07 ( -5.88443e-08  5.95184e-08 ) ergs/cm2
Cutoff power-law model

Time interval is from  -14.200 sec. to   22.184 sec.
Spectral model in the cutoff power-law:
------------------------------------------------------------
Parameters  : value       lower 90%   higher 90%
Photon index: 1.95350     ( -0.494957   0.382185 )
Epeak [keV] : 502.300      (   )
Norm@50keV  : 2.25918E-03    (     )
------------------------------------------------------------
#Fit statistic : Chi-Squared =          51.54 using 59 PHA bins.
# Reduced chi-squared =         0.9203 for     56 degrees of freedom
# Null hypothesis probability =   6.442758e-01

Photon flux (15-150 keV)    in 36.38 sec: 0.330593 ( -0.024143  0.023117 ) ph/cm2/s
Energy fluence (15-150 keV)             : 7.52488e-07 ( -7.03116e-08  5.87901e-08 ) ergs/cm2
Band function

Time interval is from  -14.200 sec. to   22.184 sec.

Spectral model in the Band function:
------------------------------------------------------------
Parameters  : value       lower 90%   higher 90%
alpha       : 4.93878   ( -14.6987   -4.93878 )
beta        : -2.03535    ( -0.160275   0.151288 )
Epeak [keV] : 20.9525      ( -7.48448 3.1949 )
Norm@50keV   : 997.455    ( -67.898   7024.58 )
------------------------------------------------------------
#Fit statistic : Chi-Squared =          48.35 using 59 PHA bins.
# Reduced chi-squared =         0.8792 for     55 degrees of freedom
# Null hypothesis probability =   7.246865e-01

Photon flux (15-150 keV)    in 36.38 sec:  (    ) ph/cm2/s
Energy fluence (15-150 keV)             : 0 ( 0  0 ) ergs/cm2
Single BB

Spectral model blackbody:
------------------------------------------------------------
Parameters  : value    Lower 90%  Upper 90%
kT [keV]    : 10.2007  (  )
R^2/D10^2   : 0.134973  (   )
(R is the radius in km and D10 is the distance to the source in units of 10 kpc)
------------------------------------------------------------
#Fit statistic : Chi-Squared =         114.11 using 59 PHA bins.
# Reduced chi-squared =         2.0019 for     57 degrees of freedom
# Null hypothesis probability =   1.082845e-05

Energy  Fluence     90% Error
[keV]   [erg/cm2]   [erg/cm2]
15- 25  1.047e-07   1.457e-08
25- 50  2.677e-07   2.161e-08
50-150  1.480e-07   2.756e-08
15-150  5.205e-07   4.638e-08
Thermal bremsstrahlung (OTTB)

Spectral model: thermal bremsstrahlung
------------------------------------------------------------
Parameters  : value         Lower 90%    Upper 90%
kT [keV]    : 75.7003       (-16.3954      24.488)
Norm        : 1.55240       (-0.177733     0.210119)
------------------------------------------------------------
#Fit statistic : Chi-Squared =          55.86 using 59 PHA bins.
# Reduced chi-squared =         0.9800 for     57 degrees of freedom
# Null hypothesis probability =   5.179352e-01

Energy  Fluence     90% Error
[keV]   [erg/cm2]   [erg/cm2]
15- 25  1.460e-07   1.475e-08
25- 50  2.370e-07   1.730e-08
50-150  3.221e-07   5.701e-08
15-150  7.051e-07   6.476e-08
Double BB

Spectral model: bbodyrad<1> + bbodyrad<2>
------------------------------------------------------------
Parameters  : value         Lower 90%    Upper 90%
kT1 [keV]   : 5.82019        (-0.88372      0.998092)
R1^2/D10^2  : 0.926544        (-0.418812      0.855054)
kT2 [keV]   : 23.4510        (-4.81928      8.23349)
R2^2/D10^2  : 4.39693E-03    (-0.0028545   0.00606716)
------------------------------------------------------------
#Fit statistic : Chi-Squared =          48.76 using 59 PHA bins.
# Reduced chi-squared =         0.8866 for     55 degrees of freedom
# Null hypothesis probability =   7.104298e-01

Energy  Fluence     90% Error
[keV]   [erg/cm2]   [erg/cm2]
15- 25  1.608e-07   3.327e-08
25- 50  2.219e-07   4.397e-08
50-150  3.664e-07   1.420e-07
15-150  7.491e-07   2.156e-07
Peak spectrum fit
Power-law model

Time interval is from    0.428 sec. to    1.428 sec.

Spectral model in power-law:
------------------------------------------------------------
Parameters  : value       lower 90%   higher 90%
Photon index: 1.98293     ( -0.255271   0.272934 )
Norm@50keV  : 6.60011E-03    ( -0.00115607   0.00112023 )
------------------------------------------------------------
#Fit statistic : Chi-Squared =          63.33 using 59 PHA bins.
# Reduced chi-squared =          1.111 for     57 degrees of freedom
# Null hypothesis probability =   2.631113e-01

Photon flux (15-150 keV)    in 1 sec: 0.982326 ( -0.136358  0.136432 ) ph/cm2/s
Energy fluence (15-150 keV)             : 6.08145e-08 ( -9.92164e-09  1.01712e-08 ) ergs/cm2
Cutoff power-law model

Time interval is from    0.428 sec. to    1.428 sec.
Spectral model in the cutoff power-law:
------------------------------------------------------------
Parameters  : value       lower 90%   higher 90%
Photon index: 1.57674     ( -1.21621   0.583584 )
Epeak [keV] : 44.6046      (   )
Norm@50keV  : 1.12375E-02    (     )
------------------------------------------------------------
#Fit statistic : Chi-Squared =          62.86 using 59 PHA bins.
# Reduced chi-squared =          1.123 for     56 degrees of freedom
# Null hypothesis probability =   2.463216e-01

Photon flux (15-150 keV)    in 1 sec: 0.966717 ( -0.141693  0.141503 ) ph/cm2/s
Energy fluence (15-150 keV)             : 5.84907e-08 ( -1.09559e-08  1.15326e-08 ) ergs/cm2
Band function

Time interval is from    0.428 sec. to    1.428 sec.

Spectral model in the Band function:
------------------------------------------------------------
Parameters  : value       lower 90%   higher 90%
alpha       : 4.97822   ( -4.97822   -4.97822 )
beta        : -2.01246    ( -0.299443   0.268226 )
Epeak [keV] : 18.0988      ( -18.0988 6.77052 )
Norm@50keV   : 8603.42    ( -1186.27   9.95854e+06 )
------------------------------------------------------------
#Fit statistic : Chi-Squared =          63.16 using 59 PHA bins.
# Reduced chi-squared =          1.148 for     55 degrees of freedom
# Null hypothesis probability =   2.103270e-01

Photon flux (15-150 keV)    in 1 sec:  (    ) ph/cm2/s
Energy fluence (15-150 keV)             : 0 ( 0  0 ) ergs/cm2
Single BB

Spectral model blackbody:
------------------------------------------------------------
Parameters  : value    Lower 90%  Upper 90%
kT [keV]    : 10.6036  (-1.71278  2.02545)
R^2/D10^2   : 0.362041  (-0.175831   0.347247)
(R is the radius in km and D10 is the distance to the source in units of 10 kpc)
------------------------------------------------------------
#Fit statistic : Chi-Squared =          75.00 using 59 PHA bins.
# Reduced chi-squared =          1.316 for     57 degrees of freedom
# Null hypothesis probability =   5.517783e-02

Energy  Fluence     90% Error
[keV]   [erg/cm2]   [erg/cm2]
15- 25  8.435e-09   2.301e-09
25- 50  2.273e-08   5.250e-09
50-150  1.402e-08   4.713e-09
15-150  4.519e-08   9.660e-09
Thermal bremsstrahlung (OTTB)

Spectral model: thermal bremsstrahlung
------------------------------------------------------------
Parameters  : value         Lower 90%    Upper 90%
kT [keV]    : 70.0291       (-24.4065      49.6122)
Norm        : 4.81507       (-0.986253     1.26381)
------------------------------------------------------------
#Fit statistic : Chi-Squared =          63.04 using 59 PHA bins.
# Reduced chi-squared =          1.106 for     57 degrees of freedom
# Null hypothesis probability =   2.712331e-01

Energy  Fluence     90% Error
[keV]   [erg/cm2]   [erg/cm2]
15- 25  1.235e-08   2.329e-09
25- 50  1.966e-08   3.245e-09
50-150  2.526e-08   1.153e-08
15-150  5.727e-08   1.258e-08
Double BB

Spectral model: bbodyrad<1> + bbodyrad<2>
------------------------------------------------------------
Parameters  : value         Lower 90%    Upper 90%
kT1 [keV]   : 4.19766        (-1.68776      2.6006)
R1^2/D10^2  : 8.58257        (-7.22029      108.425)
kT2 [keV]   : 15.6097        (-3.80897      8.26714)
R2^2/D10^2  : 6.76550E-02    (-0.0560874   0.147885)
------------------------------------------------------------
#Fit statistic : Chi-Squared =          62.52 using 59 PHA bins.
# Reduced chi-squared =          1.137 for     55 degrees of freedom
# Null hypothesis probability =   2.267377e-01

Energy  Fluence     90% Error
[keV]   [erg/cm2]   [erg/cm2]
15- 25  1.324e-08   7.430e-09
25- 50  1.817e-08   9.475e-09
50-150  2.387e-08   1.457e-08
15-150  5.528e-08   2.883e-08
Pre-slew spectrum (Pre-slew PHA with pre-slew DRM)
Power-law model

Spectral model in power-law:
------------------------------------------------------------
Parameters  : value       lower 90%   higher 90%
Photon index: 1.95746     ( -0.133917   0.136902 )
Norm@50keV  : 2.24746E-03    ( -0.000183531   0.000180831 )
------------------------------------------------------------
#Fit statistic : Chi-Squared =          51.54 using 59 PHA bins.
# Reduced chi-squared =         0.9042 for     57 degrees of freedom
# Null hypothesis probability =   6.793818e-01

Photon flux (15-150 keV)    in 36.38 sec: 0.330693 ( -0.0232016  0.0232541 ) ph/cm2/s
Energy fluence (15-150 keV)             : 7.52615e-07 ( -5.88443e-08  5.95184e-08 ) ergs/cm2
Cutoff power-law model

Spectral model in the cutoff power-law:
------------------------------------------------------------
Parameters  : value       lower 90%   higher 90%
Photon index: 1.95350     ( -0.494957   0.382185 )
Epeak [keV] : 502.300      (   )
Norm@50keV  : 2.25918E-03    (     )
------------------------------------------------------------
#Fit statistic : Chi-Squared =          51.54 using 59 PHA bins.
# Reduced chi-squared =         0.9203 for     56 degrees of freedom
# Null hypothesis probability =   6.442758e-01

Photon flux (15-150 keV)    in 36.38 sec: 0.330593 ( -0.024143  0.023117 ) ph/cm2/s
Energy fluence (15-150 keV)             : 7.52488e-07 ( -7.03116e-08  5.87901e-08 ) ergs/cm2
Band function

Spectral model in the Band function:
------------------------------------------------------------
Parameters  : value       lower 90%   higher 90%
alpha       : 4.93878   ( -14.3913   -4.93878 )
beta        : -2.03535    ( -0.160275   0.151288 )
Epeak [keV] : 20.9525      ( -7.48448 3.1949 )
Norm@50keV   : 997.455    ( -67.898   7024.58 )
------------------------------------------------------------
#Fit statistic : Chi-Squared =          48.35 using 59 PHA bins.
# Reduced chi-squared =         0.8792 for     55 degrees of freedom
# Null hypothesis probability =   7.246865e-01

Photon flux (15-150 keV)    in 36.38 sec:  (    ) ph/cm2/s
Energy fluence (15-150 keV)             : 0 ( 0  0 ) ergs/cm2
S(25-50 keV) vs. S(50-100 keV) plot

S(25-50 keV)  = 2.24e-07
S(50-100 keV) = 2.30e-07
T90 vs. Hardness ratio plot
T90                                   = 29.0080000758171 sec.
Hardness ratio (energy fluence ratio) = 1.02679
Color vs. Color plot
Count Ratio  (25-50 keV) / (15-25 keV) = 0.936218
Count Ratio (50-100 keV) / (15-25 keV) = 0.51732
Mask shadow pattern

IMX = 2.784046720988066E-01, IMY = -4.414401037912250E-02
TIME vs. PHA plot around the trigger time

Blue+Cyan dotted lines: Time interval of the scaled map
From 0.000000 to 1.024000
TIME vs. DetID plot around the trigger time

Blue+Cyan dotted lines: Time interval of the scaled map
From 0.000000 to 1.024000
100 us light curve (15-350 keV)
Blue+Cyan dotted lines: Time interval of the scaled map
From 0.000000 to 1.024000
Spacecraft aspect plot

Bright source in the pre-burst/pre-slew/post-slew images
Pre-burst image of 15-350 keV band
Time interval of the image:
-87.347400 -14.200000

# RAcent  DECcent POSerr Theta    Phi  PeakCts   SNR AngSep     Name
#  [deg]    [deg]    ['] [deg]  [deg]                   [']
186.6602 -62.7702 2700.0  48.1 -132.9  -0.0001  -0.0    0.1	GX 301-2
244.9881 -15.6388    0.4  25.5  -18.5   2.8726  31.6    0.5	Sco X-1
256.1597 -37.7584    4.1   1.5  -52.3  -0.2670  -2.8    9.7	4U 1700-377
256.3816 -36.2786    8.2   2.5  -18.1   0.1279   1.4    9.0	GX 349+2
263.0226 -24.7347  347.4  14.4   30.5  -0.0030  -0.0    1.0	GX 1+4
264.5162 -44.4245    3.1   7.8  154.0   0.3172   3.7    9.8	4U 1735-44
268.3854  -1.3042    3.6  38.4   28.5   0.5190   3.2    9.0	SW J1753.5-0127
270.0956 -24.9783   13.9  17.0   52.5   0.0859   0.8   11.9	GX 5-1
270.3182 -25.8417    3.8  16.4   54.8   0.3106   3.1    6.0	GRS 1758-258
274.0112 -13.9767    4.5  28.3   46.1   0.3074   2.5    3.6	GX 17+2
275.9568 -30.3062    7.7  16.9   78.2   0.1501   1.5    4.0	H1820-303
285.0823 -25.0394    5.3  26.6   79.2   0.2739   2.2    7.6	HT1900.1-2455
262.9151 -33.9671    4.4   6.0   55.0   0.2314   2.6    8.8	GX 354-0
197.4304 -50.6573    2.1  43.5 -115.2   2.2595   5.5 ------	UNKNOWN
Pre-slew background subtracted image of 15-350 keV band
Time interval of the image:
-14.200000 22.184000

# RAcent  DECcent POSerr Theta    Phi  PeakCts   SNR AngSep     Name
#  [deg]    [deg]    ['] [deg]  [deg]                   [']
186.7377 -62.9156    5.4  48.0 -133.1   0.6472   2.1    9.0	GX 301-2
244.9268 -15.6843    2.8  25.5  -18.7   0.3214   4.2    4.0	Sco X-1
255.8996 -38.0089    8.5   1.6  -63.4  -0.0948  -1.3   10.7	4U 1700-377
256.6138 -36.3755    4.5   2.3  -15.2   0.1854   2.6    9.1	GX 349+2
263.0720 -24.7444   17.9  14.4   30.7   0.0474   0.6    3.4	GX 1+4
264.7484 -44.4558  819.6   7.9  153.2   0.0010   0.0    0.4	4U 1735-44
268.3366  -1.4595   96.6  38.2   28.5   0.0155   0.1    1.9	SW J1753.5-0127
270.1268 -25.1188    9.7  16.9   52.8   0.1013   1.2    8.9	GX 5-1
270.0920 -25.6482    0.0  16.4   53.8   0.0976   1.2   12.7	GRS 1758-258
274.1167 -13.9259   44.1  28.4   46.2  -0.0274  -0.3    9.3	GX 17+2
275.7003 -30.2879    0.0  16.8   77.7   0.1675   2.0   12.6	H1820-303
285.0859 -25.0480    5.4  26.6   79.2  -0.2221  -2.1    8.1	HT1900.1-2455
263.0389 -33.6700   12.9   6.3   54.0  -0.0656  -0.9   10.2	GX 354-0
257.1794 -22.7233    0.6  15.7    9.0   1.4665  19.2 ------	UNKNOWN
318.6393 -86.0513    2.3  49.7 -173.0   0.8309   4.9 ------	UNKNOWN
232.2167  10.3574    3.3  54.4  -20.2   0.8301   3.5 ------	UNKNOWN
225.4834 -10.2061    3.2  40.5  -42.9   0.4726   3.6 ------	UNKNOWN
157.1237 -76.5354    2.4  55.2 -152.3   1.4787   4.8 ------	UNKNOWN
205.8196 -46.2124    2.1  38.6 -107.4   1.0857   5.6 ------	UNKNOWN
Post-slew image of 15-350 keV band
Time interval of the image:
250.452610 962.592000

# RAcent  DECcent POSerr Theta    Phi  PeakCts   SNR AngSep     Name
#  [deg]    [deg]    ['] [deg]  [deg]                   [']
244.9792 -15.6395    0.2  22.6  -58.2  31.3352  55.5    0.0	Sco X-1
255.9225 -37.9437   58.2  16.2 -135.0  -0.0918  -0.2    6.7	4U 1700-377
256.2874 -36.5004    3.3  14.9 -132.4   1.6138   3.5    8.5	GX 349+2
263.0575 -24.7257    3.4   3.6  -78.0   1.6019   3.4    2.9	GX 1+4
264.7483 -44.2978   16.5  19.6 -163.1   0.3257   0.7    9.1	4U 1735-44
268.2874  -1.4384    3.2  23.4   15.3   1.6982   3.6    4.9	SW J1753.5-0127
270.2428 -25.1245    7.1   3.0  109.5   0.8285   1.6    3.5	GX 5-1
270.2996 -25.8977    4.3   3.2  123.4   1.4034   2.7    9.3	GRS 1758-258
274.0008 -14.0420    1.4  12.6   44.9   3.7994   8.3    0.4	GX 17+2
275.8607 -30.2697    4.0   9.6  139.0   1.3321   2.9    6.7	H1820-303
284.8752 -24.8205   67.4  16.2  106.0  -0.0883  -0.2   10.6	HT1900.1-2455
288.7698  10.9688    2.2  41.6   45.3   7.3470   5.3    2.2	GRS 1915+105
262.9551 -33.7403    4.1   9.6 -147.4   1.3852   2.8    5.9	GX 354-0
278.9068   9.4178    2.5  36.1   32.3   3.3401   4.6 ------	UNKNOWN
317.6969 -75.9491    4.2  56.9  179.1  10.1869   2.8 ------	UNKNOWN
254.8599  31.0255    3.3  57.0   -0.4   8.9417   3.5 ------	UNKNOWN
298.2055 -80.4641    3.5  57.2 -173.8   8.3717   3.3 ------	UNKNOWN
255.2456 -41.6292    2.2  19.5 -140.7   2.4753   5.2 ------	UNKNOWN
264.4983 -75.3105    3.6  50.6 -167.1   4.4438   3.3 ------	UNKNOWN
251.3996 -45.6171    2.1  24.3 -140.8   2.8093   5.4 ------	UNKNOWN
250.2803 -53.7272    1.8  31.5 -148.9   3.6834   6.5 ------	UNKNOWN
	UNKNOWN
	UNKNOWN
	UNKNOWN
	UNKNOWN
Plot creation:
Sat May 30 18:47:07 EDT 2015