Special notes of this burst
Image
Pre-slew 15.0-350.0 keV image (Event data)
#   RAcent    DECcent   POSerr    Theta     Phi              Peak Cts       SNR   Name
  199.6916    62.2971   0.0027    21.2378   159.5756         4.7735500     70.025 TRIG_00530689

Foreground time interval of the image:
 -9.676  12.205 (delta_t =  21.881 [sec])
Background time interval of the image:
-427.295 -408.540 (delta_t =  18.755 [sec])
-239.696  -9.676 (delta_t = 230.020 [sec])
Lightcurves
Notes:
- 1) The mask-weighted light curves are using the flight position.
- 2) Multiple plots of different time binning/intervals are shown to cover all scenarios of short/long GRBs, rate/image triggers, and real/false positives.
- 3) For all the mask-weighted lightcurves, the y-axis units are counts/sec/det where a det is 0.4 x 0.4 = 0.16 sq cm.
- 4) The verticle lines correspond to following: green dotted lines are T50 interval, black dotted lines are T90 interval, blue solid line(s) is a spacecraft slew start time, and orange solid line(s) is a spacecraft slew end time.
- 5) Time of each bin is in the middle of the bin.
1 s binning
From T0-310 s to T0+310 s
From T100_start - 20 s to T100_end + 30 s
Full time interval
64 ms binning
Full time interval
From T100_start to T100_end
From T0-5 sec to T0+5 sec
16 ms binning
From T100_start-5 s to T100_start+5 s
Blue+Cyan dotted lines: Time interval of the scaled map
From 0.000000 to 1.024000
8 ms binning
From T100_start-3 s to T100_start+3 s
Blue+Cyan dotted lines: Time interval of the scaled map
From 0.000000 to 1.024000
2 ms binning
From T100_start-1 s to T100_start+1 s
Blue+Cyan dotted lines: Time interval of the scaled map
From 0.000000 to 1.024000
SN=5 or 10 sec. binning (whichever binning is satisfied first)
SN=5 or 10 sec. binning (T < 200 sec)
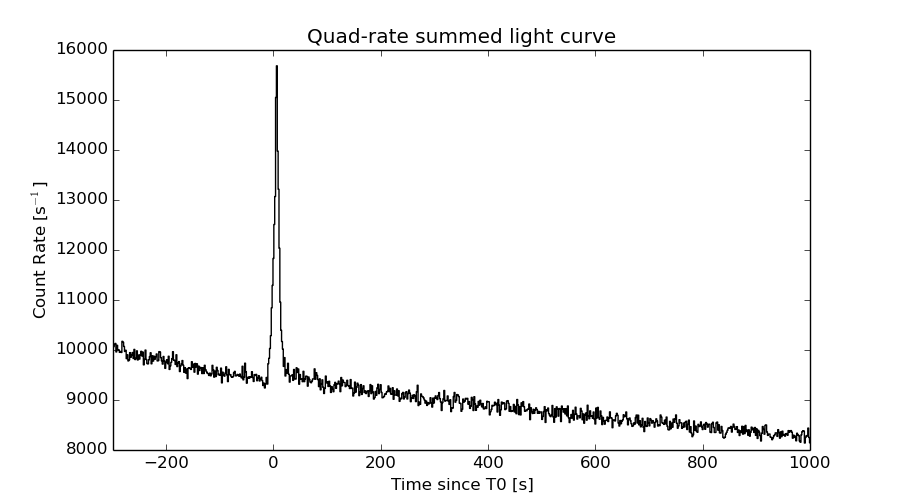
Quad-rate summed light curves (from T0-300s to T0+1000s)
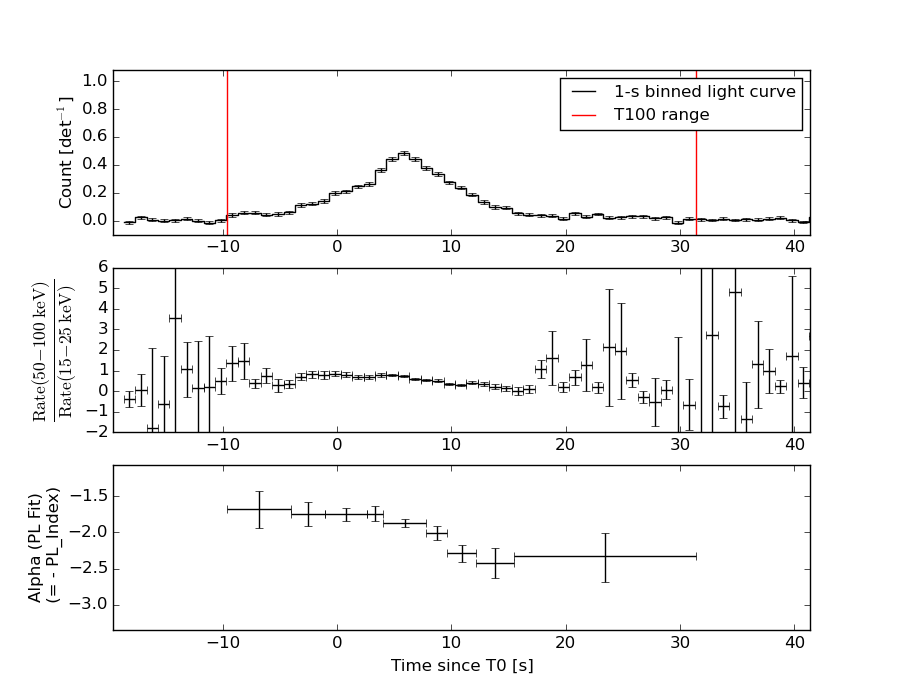
Spectral Evolution
Spectra
Notes:
- 1) The fitting includes the systematic errors.
- 2) When the burst includes telescope slew time periods, the fitting uses an average response file made from multiple 5-s response files through out the slew time plus single time preiod for the non-slew times, and weighted by the total counts in the corresponding time period using addrmf. An average response file is needed becuase a spectral fit using the pre-slew DRM will introduce some errors in both a spectral shape and a normalization if the PHA file contains a lot of the slew/post-slew time interval.
- 3) For fits to more complicated models (e.g. a power-law over a cutoff power-law), the BAT team has decided to require a chi-square improvement of more than 6 for each extra dof.
Time averaged spectrum fit using the average DRM
Power-law model
Time interval is from   -9.676 sec. to   31.388 sec.

Spectral model in power-law:
------------------------------------------------------------
Parameters  : value       lower 90%   higher 90%
Photon index: 1.99143     ( -0.0561722   0.0566533 )
Norm@50keV  : 8.04955E-03    ( -0.000239251   0.000238326 )
------------------------------------------------------------
#Fit statistic : Chi-Squared =          65.95 using 59 PHA bins.
# Reduced chi-squared =          1.157 for     57 degrees of freedom
# Null hypothesis probability =   1.950401e-01

Photon flux (15-150 keV)    in 41.06 sec: 1.20270 ( -0.0361069  0.0362706 ) ph/cm2/s
Energy fluence (15-150 keV)             : 3.04663e-06 ( -8.70764e-08  8.73256e-08 ) ergs/cm2
Cutoff power-law model
Time interval is from   -9.676 sec. to   31.388 sec.
Spectral model in the cutoff power-law:
------------------------------------------------------------
Parameters  : value       lower 90%   higher 90%
Photon index: 1.33096     ( -0.277669   0.260572 )
Epeak [keV] : 47.3123      ( -4.70882 5.24831 )
Norm@50keV  : 1.76156E-02    ( -0.00460376   0.00678916 )
------------------------------------------------------------
#Fit statistic : Chi-Squared =          45.52 using 59 PHA bins.
# Reduced chi-squared =         0.8129 for     56 degrees of freedom
# Null hypothesis probability =   8.402219e-01

Photon flux (15-150 keV)    in 41.06 sec: 1.13659 ( -0.043  0.04328 ) ph/cm2/s
Energy fluence (15-150 keV)             : 2.84559e-06 ( -1.12944e-07  1.13942e-07 ) ergs/cm2
Band function
Time interval is from   -9.676 sec. to   31.388 sec.

Spectral model in the Band function:
------------------------------------------------------------
Parameters  : value       lower 90%   higher 90%
alpha       : -1.13605   ( -0.365249   0.533791 )
beta        : -2.43422    ( -0.808421   0.239848 )
Epeak [keV] : 44.6268      ( -5.7929 5.79261 )
Norm@50keV   : 2.29537E-02    ( -0.00842525   0.0254864 )
------------------------------------------------------------
#Fit statistic : Chi-Squared =          43.70 using 59 PHA bins.
# Reduced chi-squared =         0.7946 for     55 degrees of freedom
# Null hypothesis probability =   8.635891e-01

Photon flux (15-150 keV)    in 41.06 sec:  (    ) ph/cm2/s
Energy fluence (15-150 keV)             : 2.85758e-06 ( -2.8573e-06  -1.10928e-07 ) ergs/cm2
Single BB
Spectral model blackbody:
------------------------------------------------------------
Parameters  : value    Lower 90%  Upper 90%
kT [keV]    : 11.6394  (  )
R^2/D10^2   : 0.291193  (   )
(R is the radius in km and D10 is the distance to the source in units of 10 kpc)
------------------------------------------------------------
#Fit statistic : Chi-Squared =         218.38 using 59 PHA bins.
# Reduced chi-squared =         3.8313 for     57 degrees of freedom
# Null hypothesis probability =   9.882221e-21

Energy  Fluence     90% Error
[keV]   [erg/cm2]   [erg/cm2]
15- 25  3.415e-07   1.747e-08
25- 50  1.036e-06   3.203e-08
50-150  8.267e-07   5.440e-08
15-150  2.205e-06   5.789e-08
Thermal bremsstrahlung (OTTB)
Spectral model: thermal bremsstrahlung
------------------------------------------------------------
Parameters  : value         Lower 90%    Upper 90%
kT [keV]    : 74.6599       (-6.66383      7.74663)
Norm        : 5.58703       (-0.277037     0.295797)
------------------------------------------------------------
#Fit statistic : Chi-Squared =          45.43 using 59 PHA bins.
# Reduced chi-squared =         0.7970 for     57 degrees of freedom
# Null hypothesis probability =   8.651715e-01

Energy  Fluence     90% Error
[keV]   [erg/cm2]   [erg/cm2]
15- 25  5.922e-07   2.505e-08
25- 50  9.583e-07   2.669e-08
50-150  1.290e-06   8.705e-08
15-150  2.840e-06   8.582e-08
Double BB
Spectral model: bbodyrad<1> + bbodyrad<2>
------------------------------------------------------------
Parameters  : value         Lower 90%    Upper 90%
kT1 [keV]   : 6.39262        (-0.915203      0.985985)
R1^2/D10^2  : 1.84144        (-0.683913      1.36727)
kT2 [keV]   : 18.8504        (-2.26577      3.4673)
R2^2/D10^2  : 3.29623E-02    (-0.0169054   0.0251218)
------------------------------------------------------------
#Fit statistic : Chi-Squared =          56.95 using 59 PHA bins.
# Reduced chi-squared =          1.035 for     55 degrees of freedom
# Null hypothesis probability =   4.023365e-01

Energy  Fluence     90% Error
[keV]   [erg/cm2]   [erg/cm2]
15- 25  5.420e-07   5.789e-08
25- 50  9.638e-07   7.678e-08
50-150  1.242e-06   1.359e-07
15-150  2.748e-06   2.620e-07
Peak spectrum fit
Power-law model
Time interval is from    5.268 sec. to    6.268 sec.

Spectral model in power-law:
------------------------------------------------------------
Parameters  : value       lower 90%   higher 90%
Photon index: 1.77651     ( -0.0915318   0.0930843 )
Norm@50keV  : 3.01951E-02    ( -0.00169052   0.00167843 )
------------------------------------------------------------
#Fit statistic : Chi-Squared =          62.10 using 59 PHA bins.
# Reduced chi-squared =          1.089 for     57 degrees of freedom
# Null hypothesis probability =   2.995141e-01

Photon flux (15-150 keV)    in 1 sec: 4.12353 ( -0.212073  0.212292 ) ph/cm2/s
Energy fluence (15-150 keV)             : 2.78243e-07 ( -1.59984e-08  1.61154e-08 ) ergs/cm2
Cutoff power-law model
Time interval is from    5.268 sec. to    6.268 sec.
Spectral model in the cutoff power-law:
------------------------------------------------------------
Parameters  : value       lower 90%   higher 90%
Photon index: 1.01966     ( -0.43709   0.39746 )
Epeak [keV] : 60.0748      ( -8.36932 18.0877 )
Norm@50keV  : 7.61234E-02    ( -0.0288086   0.052776 )
------------------------------------------------------------
#Fit statistic : Chi-Squared =          50.67 using 59 PHA bins.
# Reduced chi-squared =         0.9049 for     56 degrees of freedom
# Null hypothesis probability =   6.760537e-01

Photon flux (15-150 keV)    in 1 sec: 3.96417 ( -0.22603  0.22625 ) ph/cm2/s
Energy fluence (15-150 keV)             : 2.60351e-07 ( -1.8051e-08  1.8333e-08 ) ergs/cm2
Band function

Time interval is from    5.268 sec. to    6.268 sec.

Spectral model in the Band function:
------------------------------------------------------------
Parameters  : value       lower 90%   higher 90%
alpha       : -1.01960   ( -0.357853   0.379318 )
beta        : -10.0000    ( 10   1.77636e-15 )
Epeak [keV] : 60.0616      ( -7.89251 18.0859 )
Norm@50keV   : 7.61246E-02    ( -0.0287922   0.0528565 )
------------------------------------------------------------
#Fit statistic : Chi-Squared =          50.67 using 59 PHA bins.
# Reduced chi-squared =         0.9213 for     55 degrees of freedom
# Null hypothesis probability =   6.405193e-01

Photon flux (15-150 keV)    in 1 sec: 3.97511 (    ) ph/cm2/s
Energy fluence (15-150 keV)             : 2.60097e-07 ( 0  0 ) ergs/cm2
Single BB
Spectral model blackbody:
------------------------------------------------------------
Parameters  : value    Lower 90%  Upper 90%
kT [keV]    : 12.3587  (-0.74083  0.789652)
R^2/D10^2   : 0.885053  (-0.181182   0.227326)
(R is the radius in km and D10 is the distance to the source in units of 10 kpc)
------------------------------------------------------------
#Fit statistic : Chi-Squared =         109.69 using 59 PHA bins.
# Reduced chi-squared =         1.9245 for     57 degrees of freedom
# Null hypothesis probability =   3.441067e-05

Energy  Fluence     90% Error
[keV]   [erg/cm2]   [erg/cm2]
15- 25  2.865e-08   2.610e-09
25- 50  9.328e-08   5.595e-09
50-150  8.733e-08   1.075e-08
15-150  2.093e-07   1.270e-08
Thermal bremsstrahlung (OTTB)
Spectral model: thermal bremsstrahlung
------------------------------------------------------------
Parameters  : value         Lower 90%    Upper 90%
kT [keV]    : 108.296       (-20.885      24.7182)
Norm        : 17.7314       (-1.17371     1.47117)
------------------------------------------------------------
#Fit statistic : Chi-Squared =          52.02 using 59 PHA bins.
# Reduced chi-squared =         0.9127 for     57 degrees of freedom
# Null hypothesis probability =   6.618317e-01

Energy  Fluence     90% Error
[keV]   [erg/cm2]   [erg/cm2]
15- 25  4.632e-08   4.155e-09
25- 50  8.134e-08   4.940e-09
50-150  1.377e-07   4.085e-08
15-150  2.654e-07   4.390e-08
Double BB
Spectral model: bbodyrad<1> + bbodyrad<2>
------------------------------------------------------------
Parameters  : value         Lower 90%    Upper 90%
kT1 [keV]   : 5.98899        (-1.18623      1.34121)
R1^2/D10^2  : 7.28773        (-3.53781      9.09589)
kT2 [keV]   : 18.8678        (-2.55556      3.88649)
R2^2/D10^2  : 0.142830    (-0.0779398   0.12098)
------------------------------------------------------------
#Fit statistic : Chi-Squared =          50.64 using 59 PHA bins.
# Reduced chi-squared =         0.9208 for     55 degrees of freedom
# Null hypothesis probability =   6.416435e-01

Energy  Fluence     90% Error
[keV]   [erg/cm2]   [erg/cm2]
15- 25  4.466e-08   1.186e-08
25- 50  8.236e-08   1.395e-08
50-150  1.284e-07   3.025e-08
15-150  2.554e-07   5.275e-08
Pre-slew spectrum (Pre-slew PHA with pre-slew DRM)
Power-law model
Spectral model in power-law:
------------------------------------------------------------
Parameters  : value       lower 90%   higher 90%
Photon index: 1.94291     ( -0.0507956   0.051157 )
Norm@50keV  : 1.32114E-02    ( -0.000354636   0.000353585 )
------------------------------------------------------------
#Fit statistic : Chi-Squared =          71.43 using 59 PHA bins.
# Reduced chi-squared =          1.253 for     57 degrees of freedom
# Null hypothesis probability =   9.462917e-02

Photon flux (15-150 keV)    in 21.88 sec: 1.93148 ( -0.0543608  0.0545901 ) ph/cm2/s
Energy fluence (15-150 keV)             : 2.65962e-06 ( -6.99797e-08  7.0123e-08 ) ergs/cm2
Cutoff power-law model
Spectral model in the cutoff power-law:
------------------------------------------------------------
Parameters  : value       lower 90%   higher 90%
Photon index: 1.27029     ( -0.246933   0.233467 )
Epeak [keV] : 51.7554      ( -4.24973 5.47113 )
Norm@50keV  : 2.89943E-02    ( -0.0068018   0.00955058 )
------------------------------------------------------------
#Fit statistic : Chi-Squared =          44.79 using 59 PHA bins.
# Reduced chi-squared =         0.7998 for     56 degrees of freedom
# Null hypothesis probability =   8.589065e-01

Photon flux (15-150 keV)    in 21.88 sec: 1.82480 ( -0.06354  0.06391 ) ph/cm2/s
Energy fluence (15-150 keV)             : 2.49032e-06 ( -8.81764e-08  8.87015e-08 ) ergs/cm2
Band function
Spectral model in the Band function:
------------------------------------------------------------
Parameters  : value       lower 90%   higher 90%
alpha       : -1.04037   ( -0.366103   0.753681 )
beta        : -2.36188    ( 2.3619   0.221329 )
Epeak [keV] : 47.3524      ( -8.26423 7.08932 )
Norm@50keV   : 3.96456E-02    ( -0.0147011   0.0821402 )
------------------------------------------------------------
#Fit statistic : Chi-Squared =          42.67 using 59 PHA bins.
# Reduced chi-squared =         0.7757 for     55 degrees of freedom
# Null hypothesis probability =   8.873688e-01

Photon flux (15-150 keV)    in 21.88 sec:  (    ) ph/cm2/s
Energy fluence (15-150 keV)             : 2.50134e-06 ( -2.50119e-06  -8.69511e-08 ) ergs/cm2
S(25-50 keV) vs. S(50-100 keV) plot
S(25-50 keV)  = 9.15e-07
S(50-100 keV) = 9.20e-07
T90 vs. Hardness ratio plot
T90                                   = 24.3439999222755 sec.
Hardness ratio (energy fluence ratio) = 1.00546
Color vs. Color plot
Count Ratio  (25-50 keV) / (15-25 keV) = 1.09954
Count Ratio (50-100 keV) / (15-25 keV) = 0.562333
Mask shadow pattern
IMX = -3.642017794637605E-01, IMY = -1.356221535428241E-01
TIME vs. PHA plot around the trigger time
Blue+Cyan dotted lines: Time interval of the scaled map
From 0.000000 to 1.024000
TIME vs. DetID plot around the trigger time
Blue+Cyan dotted lines: Time interval of the scaled map
From 0.000000 to 1.024000
100 us light curve (15-350 keV)
Blue+Cyan dotted lines: Time interval of the scaled map
From 0.000000 to 1.024000
Spacecraft aspect plot
Bright source in the pre-burst/pre-slew/post-slew images
Pre-burst image of 15-350 keV band
Time interval of the image:
-427.295400 -408.540500
-239.696000 -9.676000

# RAcent  DECcent POSerr Theta    Phi  PeakCts   SNR AngSep     Name
#  [deg]    [deg]    ['] [deg]  [deg]                   [']
206.0618  21.8673    2.6  58.4 -171.7   5.2825   4.5 ------	UNKNOWN
143.2927  28.6510    3.0  41.2  -98.0   4.2448   3.8 ------	UNKNOWN
Pre-slew background subtracted image of 15-350 keV band
Time interval of the image:
-9.676000 12.204600

# RAcent  DECcent POSerr Theta    Phi  PeakCts   SNR AngSep     Name
#  [deg]    [deg]    ['] [deg]  [deg]                   [']
199.6916  62.2971    0.2  21.2  159.6   4.7736  70.0 ------	UNKNOWN
189.8005  19.7735    2.2  55.7 -153.7   1.5486   5.2 ------	UNKNOWN
Post-slew image of 15-350 keV band
Time interval of the image:
55.404620 962.350700

# RAcent  DECcent POSerr Theta    Phi  PeakCts   SNR AngSep     Name
#  [deg]    [deg]    ['] [deg]  [deg]                   [']
254.6205  35.4400   24.0  43.0  124.6  -1.0657  -0.5    9.9	Her X-1
 49.2633  60.3147    2.8  55.3    5.1   8.1982   4.1 ------	UNKNOWN
 94.1333  74.3180    3.3  35.0   -4.6   2.4068   3.5 ------	UNKNOWN
215.1824  12.2801    2.6  51.2 -177.2   6.0958   4.5 ------	UNKNOWN
 88.4414  55.3760    2.6  50.7  -20.8   5.0558   4.4 ------	UNKNOWN
Plot creation:
Sat May 30 18:45:08 EDT 2015