Special notes of this burst
Image
Pre-slew 15.0-350.0 keV image (Event data)
#   RAcent    DECcent   POSerr    Theta     Phi              Peak Cts       SNR   Name
  273.9765   -52.1243   0.0146    43.7996    19.6862         0.9560139     13.229 TRIG_00531003

Foreground time interval of the image:
 -0.244  11.968 (delta_t =  12.212 [sec])
Background time interval of the image:
-239.320  -0.244 (delta_t = 239.076 [sec])
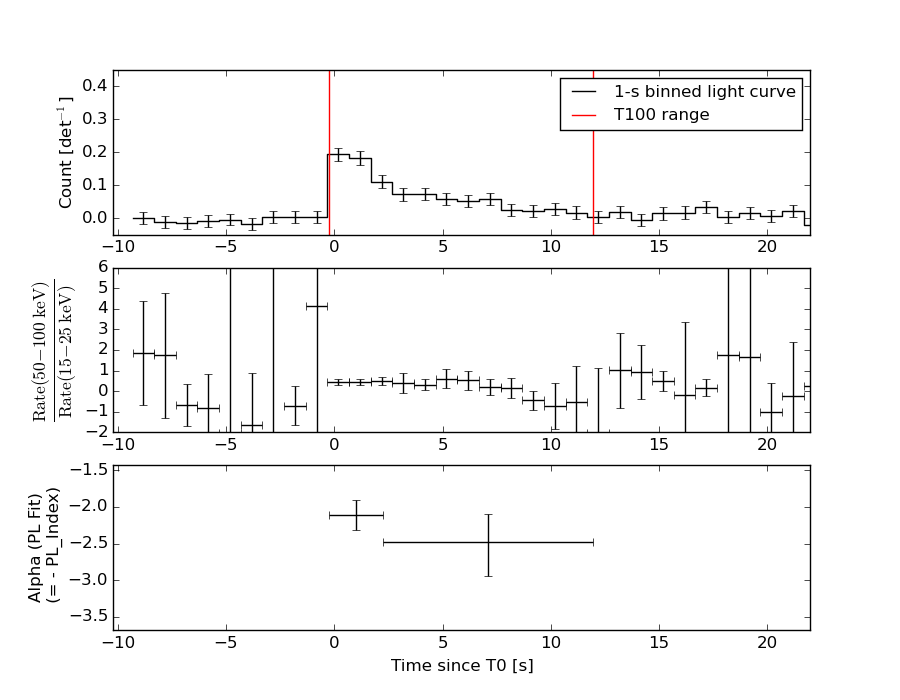
Lightcurves
Notes:
- 1) The mask-weighted light curves are using the flight position.
- 2) Multiple plots of different time binning/intervals are shown to cover all scenarios of short/long GRBs, rate/image triggers, and real/false positives.
- 3) For all the mask-weighted lightcurves, the y-axis units are counts/sec/det where a det is 0.4 x 0.4 = 0.16 sq cm.
- 4) The verticle lines correspond to following: green dotted lines are T50 interval, black dotted lines are T90 interval, blue solid line(s) is a spacecraft slew start time, and orange solid line(s) is a spacecraft slew end time.
- 5) Time of each bin is in the middle of the bin.
1 s binning
From T0-310 s to T0+310 s
From T100_start - 20 s to T100_end + 30 s
Full time interval

64 ms binning
Full time interval
From T100_start to T100_end
From T0-5 sec to T0+5 sec
16 ms binning
From T100_start-5 s to T100_start+5 s
Blue+Cyan dotted lines: Time interval of the scaled map
From 0.000000 to 1.024000
8 ms binning
From T100_start-3 s to T100_start+3 s
Blue+Cyan dotted lines: Time interval of the scaled map
From 0.000000 to 1.024000
2 ms binning
From T100_start-1 s to T100_start+1 s

Blue+Cyan dotted lines: Time interval of the scaled map
From 0.000000 to 1.024000
SN=5 or 10 sec. binning (whichever binning is satisfied first)
SN=5 or 10 sec. binning (T < 200 sec)
Quad-rate summed light curves (from T0-300s to T0+1000s)

The mask-weighted light curves based on cleaned DPHs

Spectral Evolution
Spectra
Notes:
- 1) The fitting includes the systematic errors.
- 2) When the burst includes telescope slew time periods, the fitting uses an average response file made from multiple 5-s response files through out the slew time plus single time preiod for the non-slew times, and weighted by the total counts in the corresponding time period using addrmf. An average response file is needed becuase a spectral fit using the pre-slew DRM will introduce some errors in both a spectral shape and a normalization if the PHA file contains a lot of the slew/post-slew time interval.
- 3) For fits to more complicated models (e.g. a power-law over a cutoff power-law), the BAT team has decided to require a chi-square improvement of more than 6 for each extra dof.
Time averaged spectrum fit using the average DRM
Power-law model

Time interval is from   -0.244 sec. to   11.968 sec.

Spectral model in power-law:
------------------------------------------------------------
Parameters  : value       lower 90%   higher 90%
Photon index: 2.30031     ( -0.218651   0.236915 )
Norm@50keV  : 4.21300E-03    ( -0.000710565   0.000696567 )
------------------------------------------------------------
#Fit statistic : Chi-Squared =          53.81 using 59 PHA bins.
# Reduced chi-squared =         0.9440 for     57 degrees of freedom
# Null hypothesis probability =   5.955690e-01

Photon flux (15-150 keV)    in 12.21 sec: 0.736386 ( -0.0864554  0.0864704 ) ph/cm2/s
Energy fluence (15-150 keV)             : 4.91603e-07 ( -6.81728e-08  6.98174e-08 ) ergs/cm2
Cutoff power-law model
Time interval is from   -0.244 sec. to   11.968 sec.
Spectral model in the cutoff power-law:
------------------------------------------------------------
Parameters  : value       lower 90%   higher 90%
Photon index: 1.18406     ( -1.38404   0.766736 )
Epeak [keV] : 27.2523      (   )
Norm@50keV  : 2.06925E-02    (     )
------------------------------------------------------------
#Fit statistic : Chi-Squared =          50.29 using 59 PHA bins.
# Reduced chi-squared =         0.8981 for     56 degrees of freedom
# Null hypothesis probability =   6.898097e-01

Photon flux (15-150 keV)    in 12.21 sec: 0.715881 ( -0.087903  0.088242 ) ph/cm2/s
Energy fluence (15-150 keV)             : 4.4619e-07 ( -7.10537e-08  7.88949e-08 ) ergs/cm2
Band function

Time interval is from   -0.244 sec. to   11.968 sec.

Spectral model in the Band function:
------------------------------------------------------------
Parameters  : value       lower 90%   higher 90%
alpha       : 4.72877   ( -6.54024   -4.72877 )
beta        : -2.60625    ( -0.40382   0.315708 )
Epeak [keV] : 22.9768      ( -3.57587 3.50397 )
Norm@50keV   : 996.473    ( -115.274   6368.42 )
------------------------------------------------------------
#Fit statistic : Chi-Squared =          48.50 using 59 PHA bins.
# Reduced chi-squared =         0.8817 for     55 degrees of freedom
# Null hypothesis probability =   7.197592e-01

Photon flux (15-150 keV)    in 12.21 sec:  (    ) ph/cm2/s
Energy fluence (15-150 keV)             : 4.67581e-07 ( -4.67495e-07  -7.10305e-08 ) ergs/cm2
Single BB
Spectral model blackbody:
------------------------------------------------------------
Parameters  : value    Lower 90%  Upper 90%
kT [keV]    : 8.04255  (-1.05495  1.19717)
R^2/D10^2   : 0.798027  (-0.34233   0.616303)
(R is the radius in km and D10 is the distance to the source in units of 10 kpc)
------------------------------------------------------------
#Fit statistic : Chi-Squared =          59.02 using 59 PHA bins.
# Reduced chi-squared =          1.035 for     57 degrees of freedom
# Null hypothesis probability =   4.016560e-01

Energy  Fluence     90% Error
[keV]   [erg/cm2]   [erg/cm2]
15- 25  1.144e-07   2.325e-08
25- 50  2.021e-07   3.278e-08
50-150  5.400e-08   2.130e-08
15-150  3.705e-07   5.904e-08
Thermal bremsstrahlung (OTTB)

Spectral model: thermal bremsstrahlung
------------------------------------------------------------
Parameters  : value         Lower 90%    Upper 90%
kT [keV]    : 40.6278       (-10.2562      15.4911)
Norm        : 4.75637       (-0.97602     1.28433)
------------------------------------------------------------
#Fit statistic : Chi-Squared =          50.30 using 59 PHA bins.
# Reduced chi-squared =         0.8825 for     57 degrees of freedom
# Null hypothesis probability =   7.226819e-01

Energy  Fluence     90% Error
[keV]   [erg/cm2]   [erg/cm2]
15- 25  1.341e-07   1.982e-08
25- 50  1.775e-07   2.473e-08
50-150  1.397e-07   5.344e-08
15-150  4.513e-07   7.821e-08
Double BB
Spectral model: bbodyrad<1> + bbodyrad<2>
------------------------------------------------------------
Parameters  : value         Lower 90%    Upper 90%
kT1 [keV]   : 5.45254        (-1.71091      1.83872)
R1^2/D10^2  : 2.79211        (-1.73084      2.89401)
kT2 [keV]   : 15.4272        (-5.25502      19.6842)
R2^2/D10^2  : 3.30354E-02    (-0.0314518   0.221864)
------------------------------------------------------------
#Fit statistic : Chi-Squared =          49.04 using 59 PHA bins.
# Reduced chi-squared =         0.8916 for     55 degrees of freedom
# Null hypothesis probability =   7.005729e-01

Energy  Fluence     90% Error
[keV]   [erg/cm2]   [erg/cm2]
15- 25  1.358e-07   7.350e-08
25- 50  1.746e-07   8.926e-08
50-150  1.393e-07   8.162e-08
15-150  4.498e-07   2.297e-07
Peak spectrum fit
Power-law model

Time interval is from    0.172 sec. to    1.172 sec.

Spectral model in power-law:
------------------------------------------------------------
Parameters  : value       lower 90%   higher 90%
Photon index: 1.93336     ( -0.240784   0.253409 )
Norm@50keV  : 1.52874E-02    ( -0.00255767   0.00250011 )
------------------------------------------------------------
#Fit statistic : Chi-Squared =          61.72 using 59 PHA bins.
# Reduced chi-squared =          1.083 for     57 degrees of freedom
# Null hypothesis probability =   3.112799e-01

Photon flux (15-150 keV)    in 1 sec: 2.22564 ( -0.32338  0.323739 ) ph/cm2/s
Energy fluence (15-150 keV)             : 1.40621e-07 ( -2.26457e-08  2.29957e-08 ) ergs/cm2
Cutoff power-law model
Time interval is from    0.172 sec. to    1.172 sec.
Spectral model in the cutoff power-law:
------------------------------------------------------------
Parameters  : value       lower 90%   higher 90%
Photon index: 1.19404     ( -1.30851   0.890594 )
Epeak [keV] : 46.0800      (   )
Norm@50keV  : 4.08450E-02    (     )
------------------------------------------------------------
#Fit statistic : Chi-Squared =          60.19 using 59 PHA bins.
# Reduced chi-squared =          1.075 for     56 degrees of freedom
# Null hypothesis probability =   3.265274e-01

Photon flux (15-150 keV)    in 1 sec: 2.18326 ( -0.32886  0.32904 ) ph/cm2/s
Energy fluence (15-150 keV)             : 1.32021e-07 ( -2.4917e-08  2.5874e-08 ) ergs/cm2
Band function

Time interval is from    0.172 sec. to    1.172 sec.

Spectral model in the Band function:
------------------------------------------------------------
Parameters  : value       lower 90%   higher 90%
alpha       : 5.00000   ( -4.82602   -5 )
beta        : -2.23748    ( -0.409005   0.330522 )
Epeak [keV] : 25.2662      ( -4.55117 4.00701 )
Norm@50keV   : 2370.62    ( -332.169   6219.56 )
------------------------------------------------------------
#Fit statistic : Chi-Squared =          55.52 using 59 PHA bins.
# Reduced chi-squared =          1.010 for     55 degrees of freedom
# Null hypothesis probability =   4.548699e-01

Photon flux (15-150 keV)    in 1 sec:  (    ) ph/cm2/s
Energy fluence (15-150 keV)             : 1.35624e-07 ( -1.35617e-07  -2.2893e-08 ) ergs/cm2
Single BB
Spectral model blackbody:
------------------------------------------------------------
Parameters  : value    Lower 90%  Upper 90%
kT [keV]    : 10.2598  (-1.7276  2.02421)
R^2/D10^2   : 0.962995  (-0.482081   0.996109)
(R is the radius in km and D10 is the distance to the source in units of 10 kpc)
------------------------------------------------------------
#Fit statistic : Chi-Squared =          69.42 using 59 PHA bins.
# Reduced chi-squared =          1.218 for     57 degrees of freedom
# Null hypothesis probability =   1.251646e-01

Energy  Fluence     90% Error
[keV]   [erg/cm2]   [erg/cm2]
15- 25  2.082e-08   5.245e-09
25- 50  5.364e-08   1.089e-08
50-150  3.014e-08   1.074e-08
15-150  1.046e-07   1.967e-08
Thermal bremsstrahlung (OTTB)
Spectral model: thermal bremsstrahlung
------------------------------------------------------------
Parameters  : value         Lower 90%    Upper 90%
kT [keV]    : 73.3567       (-25.3723      51.2225)
Norm        : 10.8797       (-2.23787     2.82082)
------------------------------------------------------------
#Fit statistic : Chi-Squared =          60.17 using 59 PHA bins.
# Reduced chi-squared =          1.056 for     57 degrees of freedom
# Null hypothesis probability =   3.618983e-01

Energy  Fluence     90% Error
[keV]   [erg/cm2]   [erg/cm2]
15- 25  2.804e-08   5.235e-09
25- 50  4.517e-08   8.105e-09
50-150  6.004e-08   2.492e-08
15-150  1.333e-07   3.298e-08
Double BB

Spectral model: bbodyrad<1> + bbodyrad<2>
------------------------------------------------------------
Parameters  : value         Lower 90%    Upper 90%
kT1 [keV]   : 6.25884        (-1.81907      2.49702)
R1^2/D10^2  : 4.66019        (-3.16348      11.0659)
kT2 [keV]   : 21.1043        (-7.50589      45.7791)
R2^2/D10^2  : 3.97185E-02    (-0.0386927   0.0801458)
------------------------------------------------------------
#Fit statistic : Chi-Squared =          58.09 using 59 PHA bins.
# Reduced chi-squared =          1.056 for     55 degrees of freedom
# Null hypothesis probability =   3.620920e-01

Energy  Fluence     90% Error
[keV]   [erg/cm2]   [erg/cm2]
15- 25  2.904e-08   1.588e-08
25- 50  4.527e-08   2.344e-08
50-150  6.015e-08   3.299e-08
15-150  1.345e-07   7.010e-08
Pre-slew spectrum (Pre-slew PHA with pre-slew DRM)
Power-law model

Spectral model in power-law:
------------------------------------------------------------
Parameters  : value       lower 90%   higher 90%
Photon index: 2.30031     ( -0.218651   0.236915 )
Norm@50keV  : 4.21300E-03    ( -0.000710565   0.000696567 )
------------------------------------------------------------
#Fit statistic : Chi-Squared =          53.81 using 59 PHA bins.
# Reduced chi-squared =         0.9440 for     57 degrees of freedom
# Null hypothesis probability =   5.955690e-01

Photon flux (15-150 keV)    in 12.21 sec: 0.736386 ( -0.0864554  0.0864704 ) ph/cm2/s
Energy fluence (15-150 keV)             : 4.91603e-07 ( -6.81728e-08  6.98174e-08 ) ergs/cm2
Cutoff power-law model

Spectral model in the cutoff power-law:
------------------------------------------------------------
Parameters  : value       lower 90%   higher 90%
Photon index: 1.18406     ( -1.38404   0.766736 )
Epeak [keV] : 27.2523      (   )
Norm@50keV  : 2.06925E-02    (     )
------------------------------------------------------------
#Fit statistic : Chi-Squared =          50.29 using 59 PHA bins.
# Reduced chi-squared =         0.8981 for     56 degrees of freedom
# Null hypothesis probability =   6.898097e-01

Photon flux (15-150 keV)    in 12.21 sec: 0.715881 ( -0.087903  0.088242 ) ph/cm2/s
Energy fluence (15-150 keV)             : 4.4619e-07 ( -7.10537e-08  7.88949e-08 ) ergs/cm2
Band function
Spectral model in the Band function:
------------------------------------------------------------
Parameters  : value       lower 90%   higher 90%
alpha       : 4.72877   ( -6.53805   -4.72877 )
beta        : -2.60625    ( -0.40382   0.315708 )
Epeak [keV] : 22.9768      ( -3.57587 3.50397 )
Norm@50keV   : 996.473    ( -115.274   6368.42 )
------------------------------------------------------------
#Fit statistic : Chi-Squared =          48.50 using 59 PHA bins.
# Reduced chi-squared =         0.8817 for     55 degrees of freedom
# Null hypothesis probability =   7.197592e-01

Photon flux (15-150 keV)    in 12.21 sec:  (    ) ph/cm2/s
Energy fluence (15-150 keV)             : 4.67581e-07 ( -4.67495e-07  -7.10305e-08 ) ergs/cm2
S(25-50 keV) vs. S(50-100 keV) plot
S(25-50 keV)  = 1.59e-07
S(50-100 keV) = 1.29e-07
T90 vs. Hardness ratio plot

T90                                   = 7.23199999332428 sec.
Hardness ratio (energy fluence ratio) = 0.811321
Color vs. Color plot
Count Ratio  (25-50 keV) / (15-25 keV) = 1.01518
Count Ratio (50-100 keV) / (15-25 keV) = 0.369917
Mask shadow pattern

IMX = 9.029025794022019E-01, IMY = -3.230404159963384E-01
TIME vs. PHA plot around the trigger time

Blue+Cyan dotted lines: Time interval of the scaled map
From 0.000000 to 1.024000
TIME vs. DetID plot around the trigger time
Blue+Cyan dotted lines: Time interval of the scaled map
From 0.000000 to 1.024000
100 us light curve (15-350 keV)
Blue+Cyan dotted lines: Time interval of the scaled map
From 0.000000 to 1.024000
Spacecraft aspect plot

Bright source in the pre-burst/pre-slew/post-slew images
Pre-burst image of 15-350 keV band
Time interval of the image:
-239.320000 -0.244000

# RAcent  DECcent POSerr Theta    Phi  PeakCts   SNR AngSep     Name
#  [deg]    [deg]    ['] [deg]  [deg]                   [']
170.4218 -60.6537  124.6  46.0  -56.8  -0.0776  -0.1    3.6	Cen X-3
186.3053 -62.7157    5.9  44.8  -46.0   1.0665   2.0   10.2	GX 301-2
264.6080 -44.3913    6.5  53.4   16.1   1.4030   1.8    6.8	4U 1735-44
260.0368 -43.1046    2.8  55.7   12.8   4.0365   4.1 ------	UNKNOWN
273.2647 -59.8847    2.4  37.1   13.6   1.2210   4.9 ------	UNKNOWN
328.8991 -69.9008    3.1  14.3   36.7   0.5984   3.7 ------	UNKNOWN
 43.1326 -40.7110    2.6  34.8  179.8   0.9479   4.5 ------	UNKNOWN
101.8941 -49.3889    2.0  43.2 -113.2   4.5028   5.6 ------	UNKNOWN
Pre-slew background subtracted image of 15-350 keV band
Time interval of the image:
-0.244000 11.968000

# RAcent  DECcent POSerr Theta    Phi  PeakCts   SNR AngSep     Name
#  [deg]    [deg]    ['] [deg]  [deg]                   [']
170.5468 -60.7354    5.0  46.0  -56.7   0.3159   2.3    9.6	Cen X-3
186.2570 -62.7881   32.6  44.7  -46.0  -0.0296  -0.4   11.0	GX 301-2
264.5992 -44.3410    5.4  53.4   16.1  -0.3297  -2.1    9.0	4U 1735-44
273.9765 -52.1243    0.9  43.8   19.7   0.9562  13.2 ------	UNKNOWN
344.5032 -81.7927    2.4  11.1  -20.4   0.1471   4.9 ------	UNKNOWN
Post-slew image of 15-350 keV band
Time interval of the image:
523.080610 962.777700

# RAcent  DECcent POSerr Theta    Phi  PeakCts   SNR AngSep     Name
#  [deg]    [deg]    ['] [deg]  [deg]                   [']
135.5753 -40.5405    1.9  28.1  174.3   2.1105   6.2    2.3	Vela X-1
170.4669 -60.6050    4.7  27.8  109.1  -1.0645  -2.4    4.6	Cen X-3
186.7557 -62.7909    8.8  31.9   95.2   0.7071   1.3    3.0	GX 301-2
208.4396  12.9207    3.4  58.9  -24.4   8.0946   3.4 ------	UNKNOWN
Plot creation:
Sat May 30 18:43:11 EDT 2015