Special notes of this burst
Image
Pre-slew 15.0-350.0 keV image (Event data)

#   RAcent    DECcent   POSerr    Theta     Phi              Peak Cts       SNR   Name
  282.1306    -6.9790   0.0193    46.6552   141.6466         0.8337475     10.035 TRIG_00531223

Foreground time interval of the image:
  0.280   5.064 (delta_t =   4.784 [sec])
Background time interval of the image:
-239.288   0.280 (delta_t = 239.568 [sec])
Lightcurves
Notes:
- 1) The mask-weighted light curves are using the flight position.
- 2) Multiple plots of different time binning/intervals are shown to cover all scenarios of short/long GRBs, rate/image triggers, and real/false positives.
- 3) For all the mask-weighted lightcurves, the y-axis units are counts/sec/det where a det is 0.4 x 0.4 = 0.16 sq cm.
- 4) The verticle lines correspond to following: green dotted lines are T50 interval, black dotted lines are T90 interval, blue solid line(s) is a spacecraft slew start time, and orange solid line(s) is a spacecraft slew end time.
- 5) Time of each bin is in the middle of the bin.
1 s binning
From T0-310 s to T0+310 s
From T100_start - 20 s to T100_end + 30 s
Full time interval
64 ms binning
Full time interval
From T100_start to T100_end
From T0-5 sec to T0+5 sec

16 ms binning
From T100_start-5 s to T100_start+5 s
Blue+Cyan dotted lines: Time interval of the scaled map
From 0.000000 to 4.096000
8 ms binning
From T100_start-3 s to T100_start+3 s

Blue+Cyan dotted lines: Time interval of the scaled map
From 0.000000 to 4.096000
2 ms binning
From T100_start-1 s to T100_start+1 s
Blue+Cyan dotted lines: Time interval of the scaled map
From 0.000000 to 4.096000
SN=5 or 10 sec. binning (whichever binning is satisfied first)
SN=5 or 10 sec. binning (T < 200 sec)
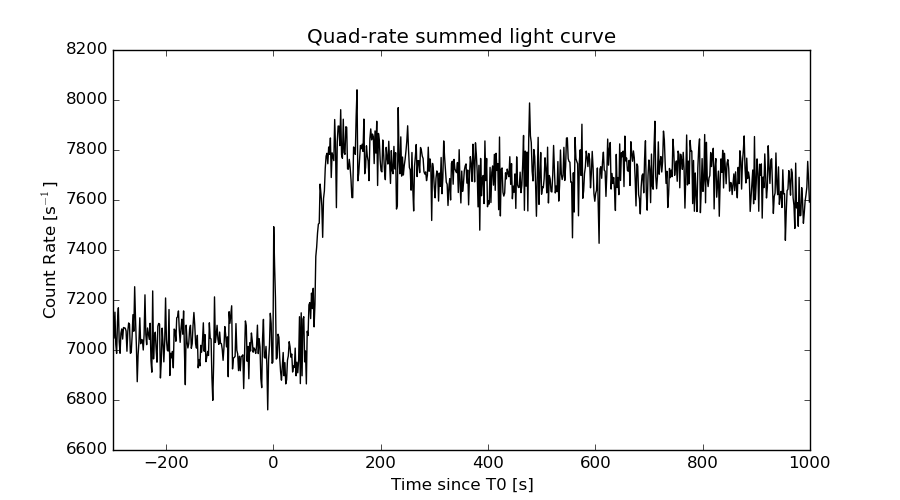
Quad-rate summed light curves (from T0-300s to T0+1000s)
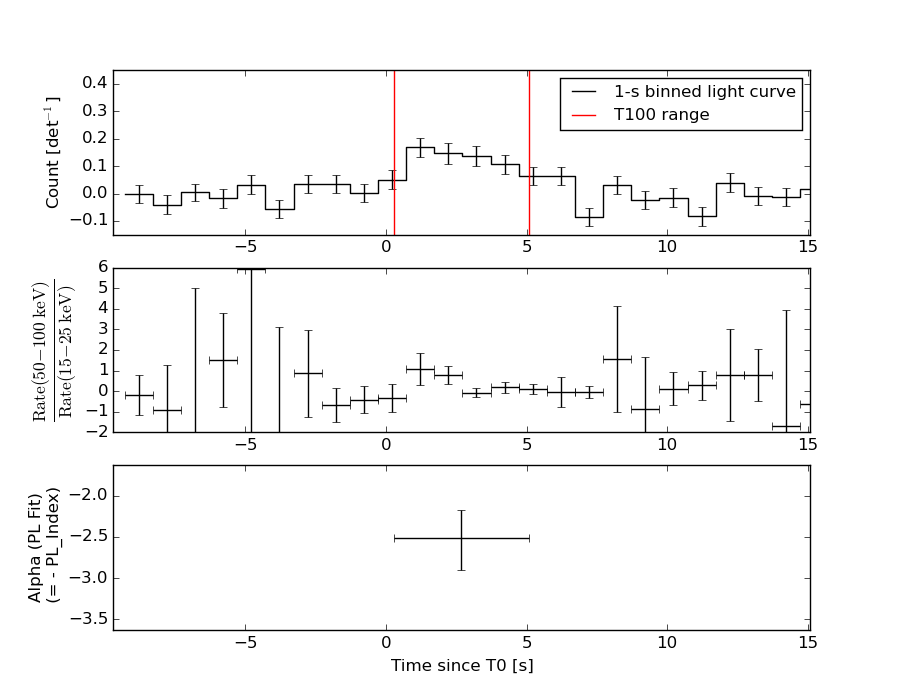
Spectral Evolution
Spectra
Notes:
- 1) The fitting includes the systematic errors.
- 2) When the burst includes telescope slew time periods, the fitting uses an average response file made from multiple 5-s response files through out the slew time plus single time preiod for the non-slew times, and weighted by the total counts in the corresponding time period using addrmf. An average response file is needed becuase a spectral fit using the pre-slew DRM will introduce some errors in both a spectral shape and a normalization if the PHA file contains a lot of the slew/post-slew time interval.
- 3) For fits to more complicated models (e.g. a power-law over a cutoff power-law), the BAT team has decided to require a chi-square improvement of more than 6 for each extra dof.
Time averaged spectrum fit using the average DRM
Power-law model

Time interval is from    0.280 sec. to    5.064 sec.

Spectral model in power-law:
------------------------------------------------------------
Parameters  : value       lower 90%   higher 90%
Photon index: 2.50906     ( -0.33506   0.394653 )
Norm@50keV  : 7.76598E-03    ( -0.00216841   0.00210312 )
------------------------------------------------------------
#Fit statistic : Chi-Squared =          54.34 using 59 PHA bins.
# Reduced chi-squared =         0.9533 for     57 degrees of freedom
# Null hypothesis probability =   5.755166e-01

Photon flux (15-150 keV)    in 4.784 sec: 1.53409 ( -0.263887  0.263898 ) ph/cm2/s
Energy fluence (15-150 keV)             : 3.72421e-07 ( -7.61876e-08  7.88513e-08 ) ergs/cm2
Cutoff power-law model

Time interval is from    0.280 sec. to    5.064 sec.
Spectral model in the cutoff power-law:
------------------------------------------------------------
Parameters  : value       lower 90%   higher 90%
Photon index: 1.49451     ( -1.93986   0.501725 )
Epeak [keV] : 18.9666      (   )
Norm@50keV  : 3.25489E-02    (     )
------------------------------------------------------------
#Fit statistic : Chi-Squared =          53.03 using 59 PHA bins.
# Reduced chi-squared =         0.9470 for     56 degrees of freedom
# Null hypothesis probability =   5.879339e-01

Photon flux (15-150 keV)    in 4.784 sec: 1.50315 ( -0.26631  0.26701 ) ph/cm2/s
Energy fluence (15-150 keV)             : 3.50369e-07 ( -7.42352e-08  8.3277e-08 ) ergs/cm2
Band function

Time interval is from    0.280 sec. to    5.064 sec.

Spectral model in the Band function:
------------------------------------------------------------
Parameters  : value       lower 90%   higher 90%
alpha       : -2.78898   ( 2.78898   2.78898 )
beta        : -2.50907    ( -0.394532   0.334913 )
Epeak [keV] : 50.1265      ( -50.1265 -50.1265 )
Norm@50keV   : 1.05550    ( -0.294712   0.285851 )
------------------------------------------------------------
#Fit statistic : Chi-Squared =          54.34 using 59 PHA bins.
# Reduced chi-squared =         0.9880 for     55 degrees of freedom
# Null hypothesis probability =   4.998230e-01

Photon flux (15-150 keV)    in 4.784 sec:  (    ) ph/cm2/s
Energy fluence (15-150 keV)             : 0 ( 0  0 ) ergs/cm2
Single BB
Spectral model blackbody:
------------------------------------------------------------
Parameters  : value    Lower 90%  Upper 90%
kT [keV]    : 7.85879  (-1.55289  1.8303)
R^2/D10^2   : 1.80062  (-1.03052   2.65147)
(R is the radius in km and D10 is the distance to the source in units of 10 kpc)
------------------------------------------------------------
#Fit statistic : Chi-Squared =          58.79 using 59 PHA bins.
# Reduced chi-squared =          1.031 for     57 degrees of freedom
# Null hypothesis probability =   4.095618e-01

Energy  Fluence     90% Error
[keV]   [erg/cm2]   [erg/cm2]
15- 25  9.491e-08   2.698e-08
25- 50  1.610e-07   5.100e-08
50-150  3.986e-08   2.064e-08
15-150  2.958e-07   8.896e-08
Thermal bremsstrahlung (OTTB)
Spectral model: thermal bremsstrahlung
------------------------------------------------------------
Parameters  : value         Lower 90%    Upper 90%
kT [keV]    : 34.0679       (-11.2186      18.0706)
Norm        : 11.1967       (-3.30468     5.16871)
------------------------------------------------------------
#Fit statistic : Chi-Squared =          53.07 using 59 PHA bins.
# Reduced chi-squared =         0.9311 for     57 degrees of freedom
# Null hypothesis probability =   6.230854e-01

Energy  Fluence     90% Error
[keV]   [erg/cm2]   [erg/cm2]
15- 25  1.157e-07   2.748e-08
25- 50  1.413e-07   3.566e-08
50-150  9.086e-08   4.796e-08
15-150  3.479e-07   8.652e-08
Double BB

Spectral model: bbodyrad<1> + bbodyrad<2>
------------------------------------------------------------
Parameters  : value         Lower 90%    Upper 90%
kT1 [keV]   : 3.29084        (-2.28873      3.12441)
R1^2/D10^2  : 47.2278        (-44.5677      207182)
kT2 [keV]   : 10.9905        (-3.20095      7.7928)
R2^2/D10^2  : 0.364878    (-0.342792   1.37762)
------------------------------------------------------------
#Fit statistic : Chi-Squared =          52.57 using 59 PHA bins.
# Reduced chi-squared =         0.9559 for     55 degrees of freedom
# Null hypothesis probability =   5.678376e-01

Energy  Fluence     90% Error
[keV]   [erg/cm2]   [erg/cm2]
15- 25  1.174e-07   6.643e-08
25- 50  1.390e-07   7.894e-08
50-150  8.488e-08   5.492e-08
15-150  3.413e-07   1.769e-07
Peak spectrum fit
Power-law model

Time interval is from    0.828 sec. to    1.828 sec.

Spectral model in power-law:
------------------------------------------------------------
Parameters  : value       lower 90%   higher 90%
Photon index: 1.98879     ( -0.401971   0.444753 )
Norm@50keV  : 1.36839E-02    ( -0.00393964   0.0038217 )
------------------------------------------------------------
#Fit statistic : Chi-Squared =          58.02 using 59 PHA bins.
# Reduced chi-squared =          1.018 for     57 degrees of freedom
# Null hypothesis probability =   4.373036e-01

Photon flux (15-150 keV)    in 1 sec: 2.04204 ( -0.53996  0.54281 ) ph/cm2/s
Energy fluence (15-150 keV)             : 1.26124e-07 ( -3.4397e-08  3.48195e-08 ) ergs/cm2
Cutoff power-law model

Time interval is from    0.828 sec. to    1.828 sec.
Spectral model in the cutoff power-law:
------------------------------------------------------------
Parameters  : value       lower 90%   higher 90%
Photon index: -0.183200     ( -4.79561   2.35036 )
Epeak [keV] : 45.0640      ( -34.6672 -45.0117 )
Norm@50keV  : 0.208266    ( -0.218519   116.525 )
------------------------------------------------------------
#Fit statistic : Chi-Squared =          55.65 using 59 PHA bins.
# Reduced chi-squared =         0.9938 for     56 degrees of freedom
# Null hypothesis probability =   4.879178e-01

Photon flux (15-150 keV)    in 1 sec: 1.91047 ( -0.56909  0.56999 ) ph/cm2/s
Energy fluence (15-150 keV)             : 1.13879e-07 ( -3.50928e-08  3.7833e-08 ) ergs/cm2
Band function
Time interval is from    0.828 sec. to    1.828 sec.

Spectral model in the Band function:
------------------------------------------------------------
Parameters  : value       lower 90%   higher 90%
alpha       : 2.83511   ( -5.15365   -3.10276 )
beta        : -2.87642    ( 2.86944   0.960191 )
Epeak [keV] : 37.8671      ( -8.42923 16.0898 )
Norm@50keV   : 9.75592    ( -9.7278   116.69 )
------------------------------------------------------------
#Fit statistic : Chi-Squared =          55.36 using 59 PHA bins.
# Reduced chi-squared =          1.007 for     55 degrees of freedom
# Null hypothesis probability =   4.610395e-01

Photon flux (15-150 keV)    in 1 sec:  (    ) ph/cm2/s
Energy fluence (15-150 keV)             : 1.17108e-07 ( 0  0 ) ergs/cm2
Single BB
Spectral model blackbody:
------------------------------------------------------------
Parameters  : value    Lower 90%  Upper 90%
kT [keV]    : 11.2484  (-2.48319  3.19973)
R^2/D10^2   : 0.656612  (-0.412797   1.05659)
(R is the radius in km and D10 is the distance to the source in units of 10 kpc)
------------------------------------------------------------
#Fit statistic : Chi-Squared =          56.07 using 59 PHA bins.
# Reduced chi-squared =         0.9837 for     57 degrees of freedom
# Null hypothesis probability =   5.098697e-01

Energy  Fluence     90% Error
[keV]   [erg/cm2]   [erg/cm2]
15- 25  1.743e-08   9.805e-09
25- 50  5.071e-08   2.285e-08
50-150  3.686e-08   2.199e-08
15-150  1.050e-07   4.800e-08
Thermal bremsstrahlung (OTTB)
Spectral model: thermal bremsstrahlung
------------------------------------------------------------
Parameters  : value         Lower 90%    Upper 90%
kT [keV]    : 70.5239       (-32.3719      96.8277)
Norm        : 10.2578       (-3.4792     4.9277)
------------------------------------------------------------
#Fit statistic : Chi-Squared =          56.60 using 59 PHA bins.
# Reduced chi-squared =         0.9930 for     57 degrees of freedom
# Null hypothesis probability =   4.900974e-01

Energy  Fluence     90% Error
[keV]   [erg/cm2]   [erg/cm2]
15- 25  2.634e-08   9.285e-09
25- 50  4.199e-08   1.669e-08
50-150  5.423e-08   3.804e-08
15-150  1.226e-07   6.162e-08
Double BB
R1^2/D10^2  : 9.77561E+07        (      )
kT2 [keV]   : 11.8563        (-2.67285      3.46658)
R2^2/D10^2  : 0.518494    (-0.33265   0.349447)
------------------------------------------------------------
#Fit statistic : Chi-Squared =          52.38 using 59 PHA bins.
#Fit statistic : Chi-Squared =          52.13 using 59 PHA bins.
#Fit statistic : Chi-Squared =          52.11 using 59 PHA bins.
# Reduced chi-squared =         0.9524 for     55 degrees of freedom
# Reduced chi-squared =         0.9478 for     55 degrees of freedom
# Reduced chi-squared =         0.9475 for     55 degrees of freedom
# Null hypothesis probability =   5.753317e-01
# Null hypothesis probability =   5.850042e-01
# Null hypothesis probability =   5.856470e-01

Energy  Fluence     90% Error
[keV]   [erg/cm2]   [erg/cm2]
15- 25  1.966e-08   9.820e-09
25- 50  4.751e-08   2.867e-08
50-150  4.020e-08   2.602e-08
15-150  1.074e-07   5.954e-08
Pre-slew spectrum (Pre-slew PHA with pre-slew DRM)
Power-law model
Spectral model in power-law:
------------------------------------------------------------
Parameters  : value       lower 90%   higher 90%
Photon index: 2.50906     ( -0.33506   0.394653 )
Norm@50keV  : 7.76598E-03    ( -0.00216841   0.00210312 )
------------------------------------------------------------
#Fit statistic : Chi-Squared =          54.34 using 59 PHA bins.
# Reduced chi-squared =         0.9533 for     57 degrees of freedom
# Null hypothesis probability =   5.755166e-01

Photon flux (15-150 keV)    in 4.784 sec: 1.53409 ( -0.263887  0.263898 ) ph/cm2/s
Energy fluence (15-150 keV)             : 3.72421e-07 ( -7.61876e-08  7.88513e-08 ) ergs/cm2
Cutoff power-law model
Spectral model in the cutoff power-law:
------------------------------------------------------------
Parameters  : value       lower 90%   higher 90%
Photon index: 1.49451     ( -1.93986   0.501725 )
Epeak [keV] : 18.9666      (   )
Norm@50keV  : 3.25489E-02    (     )
------------------------------------------------------------
#Fit statistic : Chi-Squared =          53.03 using 59 PHA bins.
# Reduced chi-squared =         0.9470 for     56 degrees of freedom
# Null hypothesis probability =   5.879339e-01

Photon flux (15-150 keV)    in 4.784 sec: 1.50315 ( -0.26631  0.26701 ) ph/cm2/s
Energy fluence (15-150 keV)             : 3.50369e-07 ( -7.42352e-08  8.3277e-08 ) ergs/cm2
Band function

Spectral model in the Band function:
------------------------------------------------------------
Parameters  : value       lower 90%   higher 90%
alpha       : -2.78898   ( 2.78898   2.78898 )
beta        : -2.50907    ( -0.394532   0.334913 )
Epeak [keV] : 50.1265      ( -50.1265 -50.1265 )
Norm@50keV   : 1.05550    ( -0.294712   0.285851 )
------------------------------------------------------------
#Fit statistic : Chi-Squared =          54.34 using 59 PHA bins.
# Reduced chi-squared =         0.9880 for     55 degrees of freedom
# Null hypothesis probability =   4.998230e-01

Photon flux (15-150 keV)    in 4.784 sec:  (    ) ph/cm2/s
Energy fluence (15-150 keV)             : 0 ( 0  0 ) ergs/cm2
S(25-50 keV) vs. S(50-100 keV) plot

S(25-50 keV)  = 1.24e-07
S(50-100 keV) = 8.69e-08
T90 vs. Hardness ratio plot
T90                                   = 4.432000041008 sec.
Hardness ratio (energy fluence ratio) = 0.700806
Color vs. Color plot
Count Ratio  (25-50 keV) / (15-25 keV) = 0.910163
Count Ratio (50-100 keV) / (15-25 keV) = 0.405729
Mask shadow pattern

IMX = -8.308680870820799E-01, IMY = -6.574392750988901E-01
TIME vs. PHA plot around the trigger time

Blue+Cyan dotted lines: Time interval of the scaled map
From 0.000000 to 4.096000
TIME vs. DetID plot around the trigger time

Blue+Cyan dotted lines: Time interval of the scaled map
From 0.000000 to 4.096000
100 us light curve (15-350 keV)
Blue+Cyan dotted lines: Time interval of the scaled map
From 0.000000 to 4.096000
Spacecraft aspect plot
Bright source in the pre-burst/pre-slew/post-slew images
Pre-burst image of 15-350 keV band
Time interval of the image:
-239.288000 0.280000

# RAcent  DECcent POSerr Theta    Phi  PeakCts   SNR AngSep     Name
#  [deg]    [deg]    ['] [deg]  [deg]                   [']
254.4659  35.3615    1.6  42.0 -144.6   2.2500   7.4    1.2	Her X-1
268.3185  -1.3738   12.7  49.9  161.1   0.5396   0.9    5.6	SW J1753.5-0127
288.8074  10.9207    0.8  27.8  146.6   3.5398  15.1    1.6	GRS 1915+105
299.5901  35.2645    2.5   5.5 -144.8   0.7670   4.6    3.8	Cyg X-1
308.0777  40.9382    1.3   7.3  -59.5   1.6548   9.0    1.7	Cyg X-3
326.1782  38.3268   24.2  16.9   -3.2   0.0806   0.5    0.4	Cyg X-2
357.0289  24.8628    2.7  44.9   15.5   1.4292   4.2 ------	UNKNOWN
320.0592  34.6900    2.5  11.6    9.9   0.7552   4.6 ------	UNKNOWN
 11.4501  39.5664    2.8  51.6   -8.5   1.6644   4.1 ------	UNKNOWN
268.5747  54.6383    2.5  33.3 -111.7   1.3843   4.6 ------	UNKNOWN
Pre-slew background subtracted image of 15-350 keV band
Time interval of the image:
0.280000 5.064000

# RAcent  DECcent POSerr Theta    Phi  PeakCts   SNR AngSep     Name
#  [deg]    [deg]    ['] [deg]  [deg]                   [']
254.3376  35.4228    7.9  42.1 -144.5  -0.0537  -1.5    7.6	Her X-1
268.3856  -1.4282    6.6  49.9  161.0  -0.1273  -1.7    1.8	SW J1753.5-0127
288.6092  10.9856    5.8  27.8  147.1   0.0539   2.0   11.4	GRS 1915+105
299.3756  35.2374    9.6   5.6 -145.5  -0.0248  -1.2   10.7	Cyg X-1
308.0362  40.7796    7.5   7.1  -59.5  -0.0305  -1.5   10.9	Cyg X-3
326.3507  38.4177    8.4  17.0   -3.4  -0.0265  -1.4   10.2	Cyg X-2
282.1306  -6.9790    1.2  46.7  141.6   0.8337  10.0 ------	UNKNOWN
266.0249  -0.8453    3.0  51.1  163.8   0.3045   3.8 ------	UNKNOWN
Post-slew image of 15-350 keV band
Time interval of the image:
115.812590 962.779600

# RAcent  DECcent POSerr Theta    Phi  PeakCts   SNR AngSep     Name
#  [deg]    [deg]    ['] [deg]  [deg]                   [']
244.9802 -15.6457    0.3  37.4 -118.6  37.8687  38.4    0.3	Sco X-1
254.4939  35.3110    8.4  49.6  -41.7   2.8230   1.4    2.6	Her X-1
256.0985 -37.8408    4.0  38.9 -158.4   2.0263   2.9    5.3	4U 1700-377
256.4499 -36.4328    3.2  37.7 -157.1   2.5687   3.6    0.9	GX 349+2
262.9990 -24.6882    3.7  25.5 -148.1   1.5051   3.1    3.5	GX 1+4
264.8585 -44.5203    2.7  40.5 -172.9   3.0188   4.3    6.5	4U 1735-44
268.3843  -1.3562    2.8  14.8  -80.3   2.1046   4.2    5.9	SW J1753.5-0127
270.1656 -24.9612    4.3  21.3 -160.8   1.4013   2.7    9.6	GX 5-1
270.3262 -25.8038    5.1  22.0 -162.4   1.1723   2.3    3.9	GRS 1758-258
274.0163 -14.0335    0.9  10.7 -144.2   6.2312  12.7    0.6	GX 17+2
275.8995 -30.3668    3.4  24.1 -178.7   1.8076   3.4    1.3	H1820-303
284.9773 -24.8497    5.7  18.1  159.7   1.0464   2.0    5.3	HT1900.1-2455
288.8055  10.9580    0.4  19.1    8.5  13.0866  27.7    0.9	GRS 1915+105
299.5231  35.1537    7.6  45.2    8.3   1.4744   1.5    4.4	Cyg X-1
308.1378  41.0173    3.4  53.6   12.4   7.9357   3.4    4.1	Cyg X-3
262.9754 -33.8437    6.0  32.2 -161.2   1.0761   1.9    0.9	GX 354-0
277.0338 -58.1284    2.8  51.3  171.5   6.1931   4.2 ------	UNKNOWN
287.5919  -5.8076    1.8   5.6   66.5   3.1811   6.5 ------	UNKNOWN
285.8213  24.5501    3.1  31.7   -5.5   2.4092   3.8 ------	UNKNOWN
255.1362 -41.6646    1.9  42.2 -161.6   4.3242   6.1 ------	UNKNOWN
238.9440 -40.7395    2.2  51.1 -150.2   7.7050   5.3 ------	UNKNOWN
	UNKNOWN
Plot creation:
Sat May 30 18:41:18 EDT 2015