Special notes of this burst
Image
Pre-slew 15.0-350.0 keV image (Event data)

#   RAcent    DECcent   POSerr    Theta     Phi              Peak Cts       SNR   Name
   74.7510    -9.3183   0.0148    37.6510   -70.5494         0.9746455     13.026 TRIG_00532871

Foreground time interval of the image:
 -0.024   6.936 (delta_t =   6.960 [sec])
Background time interval of the image:
-239.704  -0.024 (delta_t = 239.680 [sec])
Lightcurves
Notes:
- 1) The mask-weighted light curves are using the flight position.
- 2) Multiple plots of different time binning/intervals are shown to cover all scenarios of short/long GRBs, rate/image triggers, and real/false positives.
- 3) For all the mask-weighted lightcurves, the y-axis units are counts/sec/det where a det is 0.4 x 0.4 = 0.16 sq cm.
- 4) The verticle lines correspond to following: green dotted lines are T50 interval, black dotted lines are T90 interval, blue solid line(s) is a spacecraft slew start time, and orange solid line(s) is a spacecraft slew end time.
- 5) Time of each bin is in the middle of the bin.
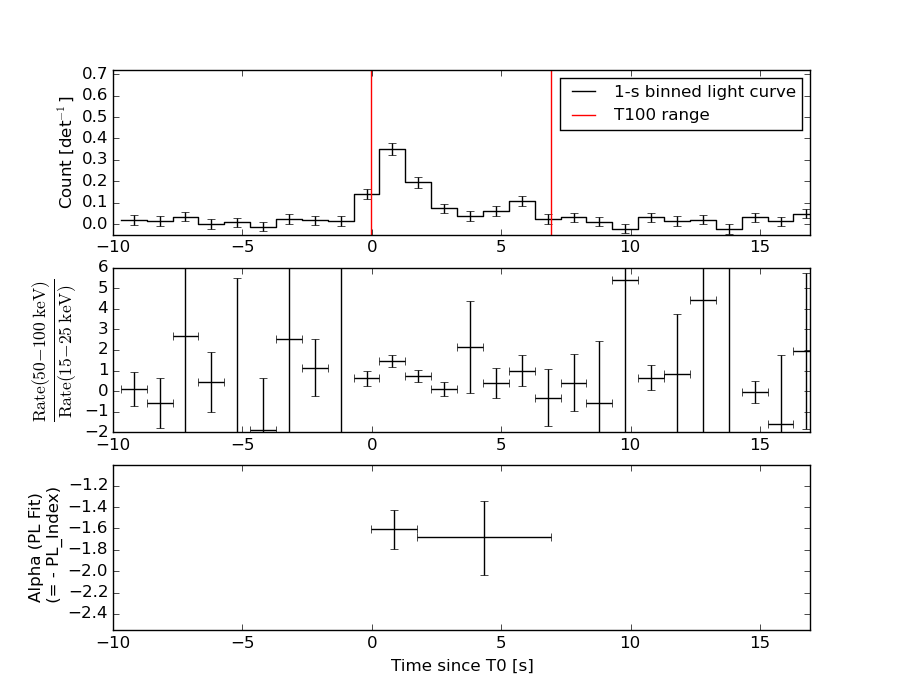
1 s binning
From T0-310 s to T0+310 s
From T100_start - 20 s to T100_end + 30 s
Full time interval
64 ms binning
Full time interval
From T100_start to T100_end
From T0-5 sec to T0+5 sec
16 ms binning
From T100_start-5 s to T100_start+5 s

Blue+Cyan dotted lines: Time interval of the scaled map
From 0.000000 to 1.024000
8 ms binning
From T100_start-3 s to T100_start+3 s
Blue+Cyan dotted lines: Time interval of the scaled map
From 0.000000 to 1.024000
2 ms binning
From T100_start-1 s to T100_start+1 s

Blue+Cyan dotted lines: Time interval of the scaled map
From 0.000000 to 1.024000
SN=5 or 10 sec. binning (whichever binning is satisfied first)
SN=5 or 10 sec. binning (T < 200 sec)
Quad-rate summed light curves (from T0-300s to T0+1000s)
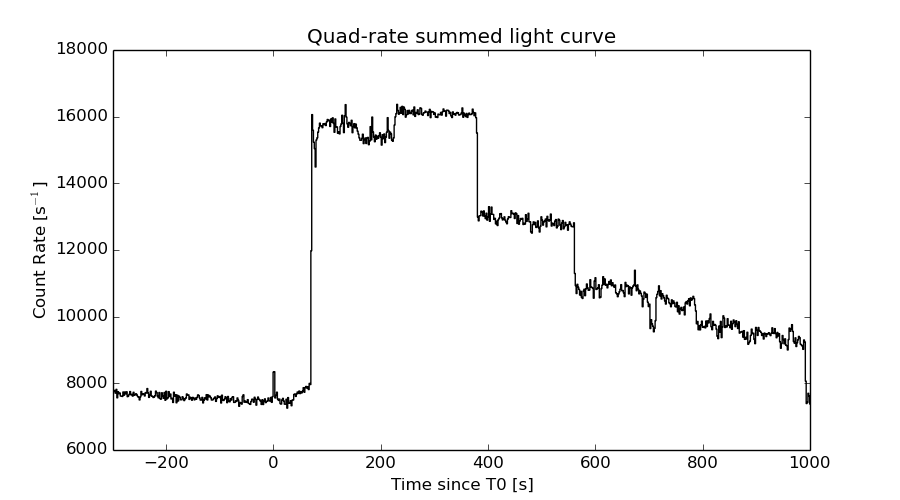
The mask-weighted light curves based on cleaned DPHs

Spectral Evolution
Spectra
Notes:
- 1) The fitting includes the systematic errors.
- 2) When the burst includes telescope slew time periods, the fitting uses an average response file made from multiple 5-s response files through out the slew time plus single time preiod for the non-slew times, and weighted by the total counts in the corresponding time period using addrmf. An average response file is needed becuase a spectral fit using the pre-slew DRM will introduce some errors in both a spectral shape and a normalization if the PHA file contains a lot of the slew/post-slew time interval.
- 3) For fits to more complicated models (e.g. a power-law over a cutoff power-law), the BAT team has decided to require a chi-square improvement of more than 6 for each extra dof.
Time averaged spectrum fit using the average DRM
Power-law model
Time interval is from   -0.024 sec. to    6.936 sec.

Spectral model in power-law:
------------------------------------------------------------
Parameters  : value       lower 90%   higher 90%
Photon index: 1.65219     ( -0.181809   0.186432 )
Norm@50keV  : 9.08508E-03    ( -0.00106275   0.00104959 )
------------------------------------------------------------
#Fit statistic : Chi-Squared =          70.19 using 59 PHA bins.
# Reduced chi-squared =          1.231 for     57 degrees of freedom
# Null hypothesis probability =   1.126069e-01

Photon flux (15-150 keV)    in 6.96 sec: 1.18715 ( -0.128022  0.128107 ) ph/cm2/s
Energy fluence (15-150 keV)             : 5.87954e-07 ( -7.25824e-08  7.36396e-08 ) ergs/cm2
Cutoff power-law model
Time interval is from   -0.024 sec. to    6.936 sec.
Spectral model in the cutoff power-law:
------------------------------------------------------------
Parameters  : value       lower 90%   higher 90%
Photon index: 0.796627     ( -1.1169   0.837451 )
Epeak [keV] : 62.9724      ( -15.5467 393.484 )
Norm@50keV  : 2.68713E-02    ( -0.0268508   0.0850771 )
------------------------------------------------------------
#Fit statistic : Chi-Squared =          67.17 using 59 PHA bins.
# Reduced chi-squared =          1.199 for     56 degrees of freedom
# Null hypothesis probability =   1.457819e-01

Photon flux (15-150 keV)    in 6.96 sec: 1.14943 ( -0.13465  0.13388 ) ph/cm2/s
Energy fluence (15-150 keV)             : 5.41597e-07 ( -8.52092e-08  8.70306e-08 ) ergs/cm2
Band function

Time interval is from   -0.024 sec. to    6.936 sec.

Spectral model in the Band function:
------------------------------------------------------------
Parameters  : value       lower 90%   higher 90%
alpha       : -0.268669   ( -0.984532   0.248569 )
beta        : -2.22394    ( 2.23679   0.565893 )
Epeak [keV] : 51.0410      ( -23.7094 36.8554 )
Norm@50keV   : 5.69350E-02    ( -0.0621047   162.697 )
------------------------------------------------------------
#Fit statistic : Chi-Squared =          65.49 using 59 PHA bins.
# Reduced chi-squared =          1.191 for     55 degrees of freedom
# Null hypothesis probability =   1.572977e-01

Photon flux (15-150 keV)    in 6.96 sec:  (    ) ph/cm2/s
Energy fluence (15-150 keV)             : 5.48143e-07 ( 0  0 ) ergs/cm2
Single BB
Spectral model blackbody:
------------------------------------------------------------
Parameters  : value    Lower 90%  Upper 90%
kT [keV]    : 12.0972  (-1.35867  1.57871)
R^2/D10^2   : 0.289606  (-0.105458   0.158994)
(R is the radius in km and D10 is the distance to the source in units of 10 kpc)
------------------------------------------------------------
#Fit statistic : Chi-Squared =          76.04 using 59 PHA bins.
# Reduced chi-squared =          1.334 for     57 degrees of freedom
# Null hypothesis probability =   4.674184e-02

Energy  Fluence     90% Error
[keV]   [erg/cm2]   [erg/cm2]
15- 25  6.243e-08   1.116e-08
25- 50  1.983e-07   2.554e-08
50-150  1.755e-07   4.371e-08
15-150  4.362e-07   6.473e-08
Thermal bremsstrahlung (OTTB)

Spectral model: thermal bremsstrahlung
------------------------------------------------------------
Parameters  : value         Lower 90%    Upper 90%
kT [keV]    : 137.862       (-51.0384      -136.551)
Norm        : 4.97346       (-0.602211     0.76398)
------------------------------------------------------------
#Fit statistic : Chi-Squared =          67.92 using 59 PHA bins.
# Reduced chi-squared =          1.192 for     57 degrees of freedom
# Null hypothesis probability =   1.525431e-01

Energy  Fluence     90% Error
[keV]   [erg/cm2]   [erg/cm2]
15- 25  8.948e-08   1.329e-08
25- 50  1.638e-07   3.939e-08
50-150  3.118e-07   1.701e-07
15-150  5.651e-07   2.259e-07
Double BB
Spectral model: bbodyrad<1> + bbodyrad<2>
------------------------------------------------------------
Parameters  : value         Lower 90%    Upper 90%
kT1 [keV]   : 9.67751        (-2.26274      1.87521)
R1^2/D10^2  : 0.550587        (-0.242416      0.610207)
kT2 [keV]   : 48.4532        (-27.5171      -48.4577)
R2^2/D10^2  : 1.43504E-03    (-0.00137058   0.023094)
------------------------------------------------------------
#Fit statistic : Chi-Squared =          64.52 using 59 PHA bins.
# Reduced chi-squared =          1.173 for     55 degrees of freedom
# Null hypothesis probability =   1.780429e-01

Energy  Fluence     90% Error
[keV]   [erg/cm2]   [erg/cm2]
15- 25  7.484e-08   2.264e-08
25- 50  1.901e-07   5.982e-08
50-150  3.042e-07   1.483e-07
15-150  5.691e-07   2.187e-07
Peak spectrum fit
Power-law model
Time interval is from    0.108 sec. to    1.108 sec.

Spectral model in power-law:
------------------------------------------------------------
Parameters  : value       lower 90%   higher 90%
Photon index: 1.38869     ( -0.21602   0.215815 )
Norm@50keV  : 2.35565E-02    ( -0.00298107   0.00297546 )
------------------------------------------------------------
#Fit statistic : Chi-Squared =          61.13 using 59 PHA bins.
# Reduced chi-squared =          1.073 for     57 degrees of freedom
# Null hypothesis probability =   3.298810e-01

Photon flux (15-150 keV)    in 1 sec: 2.86147 ( -0.371148  0.372001 ) ph/cm2/s
Energy fluence (15-150 keV)             : 2.28151e-07 ( -3.15626e-08  3.17683e-08 ) ergs/cm2
Cutoff power-law model
Time interval is from    0.108 sec. to    1.108 sec.
Spectral model in the cutoff power-law:
------------------------------------------------------------
Parameters  : value       lower 90%   higher 90%
Photon index: 1.38590     ( -0.22777   0.216597 )
Epeak [keV] : 9999.00      ( -9999.2 -9999.2 )
Norm@50keV  : 2.36416E-02    ( -0.0236428   0.0371138 )
------------------------------------------------------------
#Fit statistic : Chi-Squared =          61.13 using 59 PHA bins.
# Reduced chi-squared =          1.092 for     56 degrees of freedom
# Null hypothesis probability =   2.968240e-01

Photon flux (15-150 keV)    in 1 sec: 2.86130 ( -0.373  0.36919 ) ph/cm2/s
Energy fluence (15-150 keV)             : 2.2817e-07 ( -3.3021e-08  3.1608e-08 ) ergs/cm2
Band function
Time interval is from    0.108 sec. to    1.108 sec.

Spectral model in the Band function:
------------------------------------------------------------
Parameters  : value       lower 90%   higher 90%
alpha       : 9.95198E-02   ( 0.563348   0.563348 )
beta        : -1.49256    ( 1.47115   0.27643 )
Epeak [keV] : 44.2968      ( -44.2833 92.7586 )
Norm@50keV   : 0.225480    ( -0.232196   349.377 )
------------------------------------------------------------
#Fit statistic : Chi-Squared =          60.46 using 59 PHA bins.
# Reduced chi-squared =          1.099 for     55 degrees of freedom
# Null hypothesis probability =   2.853086e-01

Photon flux (15-150 keV)    in 1 sec:  (    ) ph/cm2/s
Energy fluence (15-150 keV)             : 0 ( 0  0 ) ergs/cm2
Single BB
Spectral model blackbody:
------------------------------------------------------------
Parameters  : value    Lower 90%  Upper 90%
kT [keV]    : 15.7704  (-2.67867  3.42443)
R^2/D10^2   : 0.278128  (-0.136257   0.253194)
(R is the radius in km and D10 is the distance to the source in units of 10 kpc)
------------------------------------------------------------
#Fit statistic : Chi-Squared =          80.23 using 59 PHA bins.
# Reduced chi-squared =          1.407 for     57 degrees of freedom
# Null hypothesis probability =   2.299848e-02

Energy  Fluence     90% Error
[keV]   [erg/cm2]   [erg/cm2]
15- 25  1.435e-08   3.495e-09
25- 50  5.962e-08   1.164e-08
50-150  1.031e-07   2.533e-08
15-150  1.770e-07   3.295e-08
Thermal bremsstrahlung (OTTB)
Spectral model: thermal bremsstrahlung
------------------------------------------------------------
Parameters  : value         Lower 90%    Upper 90%
kT [keV]    : 200.000       (      )
Norm        : 11.8676       (-1.49937     1.49924)
------------------------------------------------------------
#Fit statistic : Chi-Squared =          63.14 using 59 PHA bins.
# Reduced chi-squared =          1.108 for     57 degrees of freedom
# Null hypothesis probability =   2.683813e-01

Energy  Fluence     90% Error
[keV]   [erg/cm2]   [erg/cm2]
15- 25  2.956e-08   1.658e-08
25- 50  5.686e-08   3.162e-08
50-150  1.247e-07   6.965e-08
15-150  2.111e-07   1.176e-07
Double BB

Spectral model: bbodyrad<1> + bbodyrad<2>
------------------------------------------------------------
Parameters  : value         Lower 90%    Upper 90%
kT1 [keV]   : 8.95008        (-2.39198      2.71378)
R1^2/D10^2  : 1.47151        (-0.838973      2.49615)
kT2 [keV]   : 46.0660        (-19.7676      -46.3393)
R2^2/D10^2  : 6.46718E-03    (-0.00616485   0.0163917)
------------------------------------------------------------
#Fit statistic : Chi-Squared =          59.12 using 59 PHA bins.
# Reduced chi-squared =          1.075 for     55 degrees of freedom
# Null hypothesis probability =   3.276386e-01

Energy  Fluence     90% Error
[keV]   [erg/cm2]   [erg/cm2]
15- 25  2.448e-08   1.329e-08
25- 50  5.952e-08   3.235e-08
50-150  1.452e-07   7.850e-08
15-150  2.292e-07   1.105e-07
Pre-slew spectrum (Pre-slew PHA with pre-slew DRM)
Power-law model

Spectral model in power-law:
------------------------------------------------------------
Parameters  : value       lower 90%   higher 90%
Photon index: 1.65219     ( -0.181809   0.186432 )
Norm@50keV  : 9.08508E-03    ( -0.00106275   0.00104959 )
------------------------------------------------------------
#Fit statistic : Chi-Squared =          70.19 using 59 PHA bins.
# Reduced chi-squared =          1.231 for     57 degrees of freedom
# Null hypothesis probability =   1.126069e-01

Photon flux (15-150 keV)    in 6.96 sec: 1.18715 ( -0.128022  0.128107 ) ph/cm2/s
Energy fluence (15-150 keV)             : 5.87954e-07 ( -7.25824e-08  7.36396e-08 ) ergs/cm2
Cutoff power-law model

Spectral model in the cutoff power-law:
------------------------------------------------------------
Parameters  : value       lower 90%   higher 90%
Photon index: 0.796627     ( -1.1169   0.837451 )
Epeak [keV] : 62.9724      ( -15.5467 393.484 )
Norm@50keV  : 2.68713E-02    ( -0.0268508   0.0850771 )
------------------------------------------------------------
#Fit statistic : Chi-Squared =          67.17 using 59 PHA bins.
# Reduced chi-squared =          1.199 for     56 degrees of freedom
# Null hypothesis probability =   1.457819e-01

Photon flux (15-150 keV)    in 6.96 sec: 1.14943 ( -0.13465  0.13388 ) ph/cm2/s
Energy fluence (15-150 keV)             : 5.41597e-07 ( -8.52092e-08  8.70306e-08 ) ergs/cm2
Band function
Spectral model in the Band function:
------------------------------------------------------------
Parameters  : value       lower 90%   higher 90%
alpha       : -0.268669   ( -0.984532   0.248569 )
beta        : -2.22394    ( 2.23679   0.565893 )
Epeak [keV] : 51.0410      ( -23.7094 36.8554 )
Norm@50keV   : 5.69350E-02    ( -0.0621047   162.729 )
------------------------------------------------------------
#Fit statistic : Chi-Squared =          65.49 using 59 PHA bins.
# Reduced chi-squared =          1.191 for     55 degrees of freedom
# Null hypothesis probability =   1.572977e-01

Photon flux (15-150 keV)    in 6.96 sec:  (    ) ph/cm2/s
Energy fluence (15-150 keV)             : 5.48143e-07 ( 0  0 ) ergs/cm2
S(25-50 keV) vs. S(50-100 keV) plot
S(25-50 keV)  = 1.56e-07
S(50-100 keV) = 1.99e-07
T90 vs. Hardness ratio plot
T90                                   = 6.08000004291534 sec.
Hardness ratio (energy fluence ratio) = 1.27564
Color vs. Color plot

Count Ratio  (25-50 keV) / (15-25 keV) = 1.55707
Count Ratio (50-100 keV) / (15-25 keV) = 0.929355
Mask shadow pattern
IMX = 2.569119331032302E-01, IMY = 7.274905239572595E-01
TIME vs. PHA plot around the trigger time

Blue+Cyan dotted lines: Time interval of the scaled map
From 0.000000 to 1.024000
TIME vs. DetID plot around the trigger time

Blue+Cyan dotted lines: Time interval of the scaled map
From 0.000000 to 1.024000
100 us light curve (15-350 keV)
Blue+Cyan dotted lines: Time interval of the scaled map
From 0.000000 to 1.024000
Spacecraft aspect plot
Bright source in the pre-burst/pre-slew/post-slew images
Pre-burst image of 15-350 keV band
Time interval of the image:
-239.704000 -0.024000

# RAcent  DECcent POSerr Theta    Phi  PeakCts   SNR AngSep     Name
#  [deg]    [deg]    ['] [deg]  [deg]                   [']
 10.1919 -10.1782    2.5  30.1   70.8   1.5198   4.6 ------	UNKNOWN
 26.9554 -14.2590    2.4  18.8   39.3   0.8959   4.7 ------	UNKNOWN
 26.7413  26.1649    2.9  27.7  160.1   0.8480   4.1 ------	UNKNOWN
 34.9967 -25.0582    2.5  26.1    9.8   0.8697   4.6 ------	UNKNOWN
 44.7235 -47.9740    3.2  49.1   -2.7   1.3718   3.6 ------	UNKNOWN
 44.4236 -43.5212    2.6  44.7   -3.3   1.4332   4.5 ------	UNKNOWN
 44.6915 -44.9998    3.4  46.2   -3.3   1.1751   3.4 ------	UNKNOWN
 60.6637 -24.9375    2.6  33.6  -35.5   1.0496   4.5 ------	UNKNOWN
 63.5253  54.4485    3.2  57.4 -160.0   3.7835   3.6 ------	UNKNOWN
 78.0400  30.4346    3.2  47.9 -129.1   2.9233   3.6 ------	UNKNOWN
 79.2359   4.6301    3.7  41.0  -93.1   2.7435   3.1 ------	UNKNOWN
Pre-slew background subtracted image of 15-350 keV band
Time interval of the image:
-0.024000 6.936000

# RAcent  DECcent POSerr Theta    Phi  PeakCts   SNR AngSep     Name
#  [deg]    [deg]    ['] [deg]  [deg]                   [']
 32.6308 -42.9180    2.3  44.1    9.0   0.2486   5.1 ------	UNKNOWN
 35.1525  57.7186    2.4  56.9 -179.1   0.7499   4.8 ------	UNKNOWN
 74.0538 -14.4557    1.8  38.5  -62.3   0.4222   6.3 ------	UNKNOWN
 74.7510  -9.3183    0.9  37.7  -70.5   0.9747  13.0 ------	UNKNOWN
Post-slew image of 15-350 keV band
Time interval of the image:
66.396590 962.386200

# RAcent  DECcent POSerr Theta    Phi  PeakCts   SNR AngSep     Name
#  [deg]    [deg]    ['] [deg]  [deg]                   [']
 83.6356  22.0131    0.2  32.5 -158.6  36.8640  57.5    0.2	Crab
 62.9917 -10.8144    2.5  11.6   87.5   2.4630   4.7 ------	UNKNOWN
123.0413 -38.2477    3.8  52.0  -42.2  10.0806   3.0 ------	UNKNOWN
Plot creation:
Sat May 30 18:35:30 EDT 2015