Click here for the BAT GCN circular template
Image
Pre-slew 15.0-350.0 keV image (Event data)
#   RAcent    DECcent   POSerr    Theta     Phi              Peak Cts       SNR   Name
  357.9665    63.0901   0.0122    34.0713    99.8536         1.9677411     15.736 TRIG_00533268

Foreground time interval of the image:
 -1.624  24.100 (delta_t =  25.724 [sec])
Background time interval of the image:
-85.691  -1.624 (delta_t =  84.067 [sec])
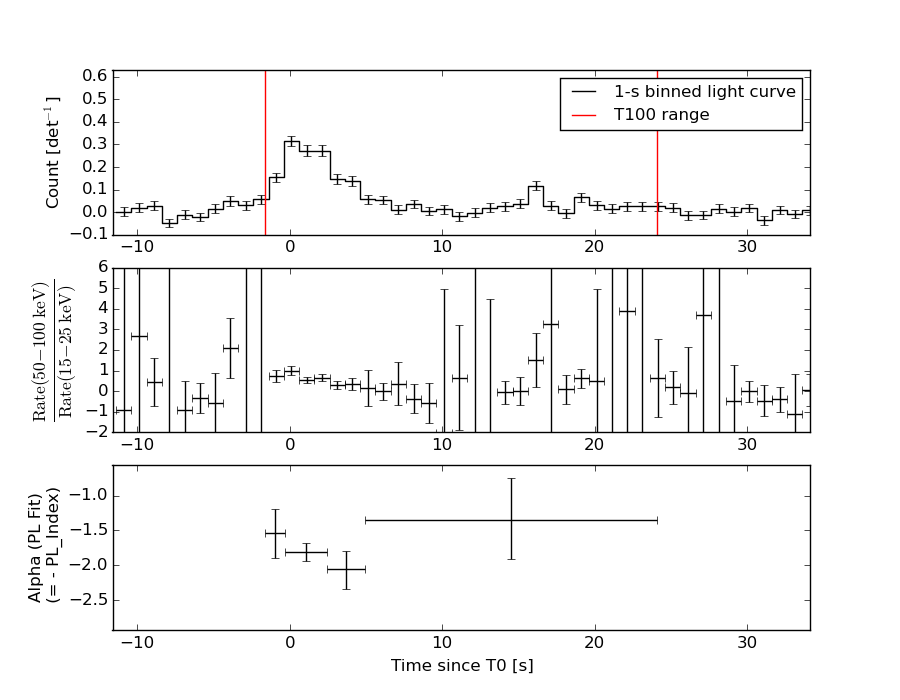
Lightcurves
Notes:
- 1) The mask-weighted light curves are using the flight position.
- 2) Multiple plots of different time binning/intervals are shown to cover all scenarios of short/long GRBs, rate/image triggers, and real/false positives.
- 3) For all the mask-weighted lightcurves, the y-axis units are counts/sec/det where a det is 0.4 x 0.4 = 0.16 sq cm.
- 4) The verticle lines correspond to following: green dotted lines are T50 interval, black dotted lines are T90 interval, blue solid line(s) is a spacecraft slew start time, and orange solid line(s) is a spacecraft slew end time.
- 5) Time of each bin is in the middle of the bin.
1 s binning
From T0-310 s to T0+310 s
From T100_start - 20 s to T100_end + 30 s
Full time interval
64 ms binning
Full time interval
From T100_start to T100_end
From T0-5 sec to T0+5 sec
16 ms binning
From T100_start-5 s to T100_start+5 s
Blue+Cyan dotted lines: Time interval of the scaled map
From 0.000000 to 1.024000
8 ms binning
From T100_start-3 s to T100_start+3 s
Blue+Cyan dotted lines: Time interval of the scaled map
From 0.000000 to 1.024000
2 ms binning
From T100_start-1 s to T100_start+1 s
Blue+Cyan dotted lines: Time interval of the scaled map
From 0.000000 to 1.024000
SN=5 or 10 sec. binning (whichever binning is satisfied first)
SN=5 or 10 sec. binning (T < 200 sec)
Quad-rate summed light curves (from T0-300s to T0+1000s)
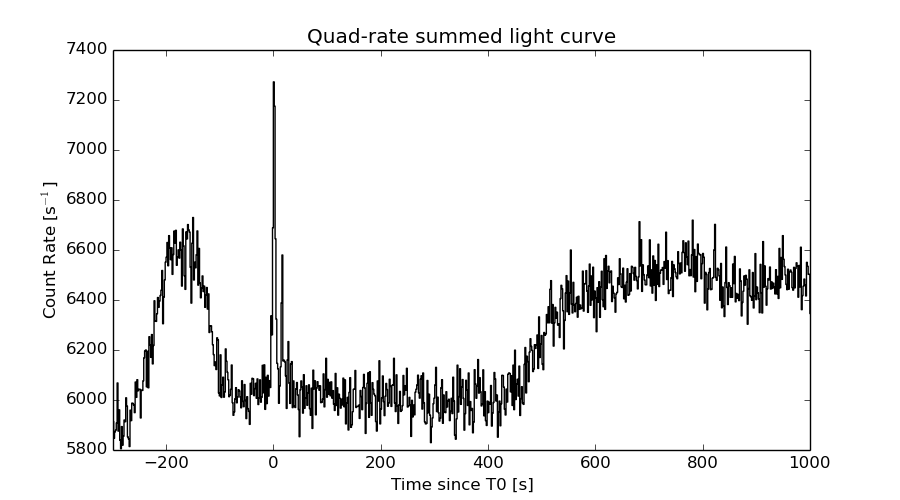
The mask-weighted light curves based on cleaned DPHs

Spectral Evolution
Spectra
Notes:
- 1) The fitting includes the systematic errors.
- 2) When the burst includes telescope slew time periods, the fitting uses an average response file made from multiple 5-s response files through out the slew time plus single time preiod for the non-slew times, and weighted by the total counts in the corresponding time period using addrmf. An average response file is needed becuase a spectral fit using the pre-slew DRM will introduce some errors in both a spectral shape and a normalization if the PHA file contains a lot of the slew/post-slew time interval.
- 3) For fits to more complicated models (e.g. a power-law over a cutoff power-law), the BAT team has decided to require a chi-square improvement of more than 6 for each extra dof.
Time averaged spectrum fit using the average DRM
Power-law model
Time interval is from   -1.624 sec. to   24.100 sec.

Spectral model in power-law:
------------------------------------------------------------
Parameters  : value       lower 90%   higher 90%
Photon index: 1.71683     ( -0.159191   0.162762 )
Norm@50keV  : 4.46748E-03    ( -0.000457013   0.000451684 )
------------------------------------------------------------
#Fit statistic : Chi-Squared =          57.87 using 59 PHA bins.
# Reduced chi-squared =          1.015 for     57 degrees of freedom
# Null hypothesis probability =   4.428182e-01

Photon flux (15-150 keV)    in 25.72 sec: 0.596863 ( -0.0562073  0.0562531 ) ph/cm2/s
Energy fluence (15-150 keV)             : 1.06253e-06 ( -1.128e-07  1.14074e-07 ) ergs/cm2
Cutoff power-law model

Time interval is from   -1.624 sec. to   24.100 sec.
Spectral model in the cutoff power-law:
------------------------------------------------------------
Parameters  : value       lower 90%   higher 90%
Photon index: 1.06815     ( -0.902637   0.353193 )
Epeak [keV] : 63.4344      ( -16.5125 -63.4669 )
Norm@50keV  : 1.02805E-02    ( -0.00596633   0.0228307 )
------------------------------------------------------------
#Fit statistic : Chi-Squared =          55.55 using 59 PHA bins.
# Reduced chi-squared =         0.9919 for     56 degrees of freedom
# Null hypothesis probability =   4.919071e-01

Photon flux (15-150 keV)    in 25.72 sec: 0.583013 ( -0.058742  0.058484 ) ph/cm2/s
Energy fluence (15-150 keV)             : 9.96853e-07 ( -1.36033e-07  1.36203e-07 ) ergs/cm2
Band function
Time interval is from   -1.624 sec. to   24.100 sec.

Spectral model in the Band function:
------------------------------------------------------------
Parameters  : value       lower 90%   higher 90%
alpha       : 1.29086   ( -1.43214   -0.235649 )
beta        : -2.05254    ( -0.628429   0.349726 )
Epeak [keV] : 34.9427      ( -14.3484 24.6812 )
Norm@50keV   : 0.420323    ( -0.438186   92.2594 )
------------------------------------------------------------
#Fit statistic : Chi-Squared =          51.42 using 59 PHA bins.
# Reduced chi-squared =         0.9349 for     55 degrees of freedom
# Null hypothesis probability =   6.121561e-01

Photon flux (15-150 keV)    in 25.72 sec:  (    ) ph/cm2/s
Energy fluence (15-150 keV)             : 1.01101e-06 ( -1.01083e-06  -1.19482e-07 ) ergs/cm2
Single BB
Spectral model blackbody:
------------------------------------------------------------
Parameters  : value    Lower 90%  Upper 90%
kT [keV]    : 11.4099  (-1.16913  1.34174)
R^2/D10^2   : 0.177208  (-0.0603283   0.0882814)
(R is the radius in km and D10 is the distance to the source in units of 10 kpc)
------------------------------------------------------------
#Fit statistic : Chi-Squared =          70.55 using 59 PHA bins.
# Reduced chi-squared =          1.238 for     57 degrees of freedom
# Null hypothesis probability =   1.072156e-01

Energy  Fluence     90% Error
[keV]   [erg/cm2]   [erg/cm2]
15- 25  1.248e-07   2.175e-08
25- 50  3.695e-07   4.900e-08
50-150  2.792e-07   6.871e-08
15-150  7.735e-07   9.619e-08
Thermal bremsstrahlung (OTTB)
Spectral model: thermal bremsstrahlung
------------------------------------------------------------
Parameters  : value         Lower 90%    Upper 90%
kT [keV]    : 117.627       (-37.0564      67.0077)
Norm        : 2.55640       (-0.294873     0.371872)
------------------------------------------------------------
#Fit statistic : Chi-Squared =          55.64 using 59 PHA bins.
# Reduced chi-squared =         0.9762 for     57 degrees of freedom
# Null hypothesis probability =   5.261006e-01

Energy  Fluence     90% Error
[keV]   [erg/cm2]   [erg/cm2]
15- 25  1.714e-07   2.294e-08
25- 50  3.056e-07   4.249e-08
50-150  5.399e-07   2.284e-07
15-150  1.017e-06   2.692e-07
Double BB
Spectral model: bbodyrad<1> + bbodyrad<2>
------------------------------------------------------------
Parameters  : value         Lower 90%    Upper 90%
kT1 [keV]   : 8.93548        (-1.73778      1.54256)
R1^2/D10^2  : 0.371893        (-0.126755      0.11057)
kT2 [keV]   : 47.8033        (-50.2741      -77.3541)
R2^2/D10^2  : 7.21057E-04    (-0.000198357   0.00425331)
------------------------------------------------------------
#Fit statistic : Chi-Squared =          49.48 using 59 PHA bins.
# Reduced chi-squared =         0.8997 for     55 degrees of freedom
# Null hypothesis probability =   6.845546e-01

Energy  Fluence     90% Error
[keV]   [erg/cm2]   [erg/cm2]
15- 25  1.529e-07   3.922e-08
25- 50  3.456e-07   8.575e-08
50-150  5.164e-07   2.557e-07
15-150  1.015e-06   3.404e-07
Peak spectrum fit
Power-law model
Time interval is from   -0.300 sec. to    0.700 sec.

Spectral model in power-law:
------------------------------------------------------------
Parameters  : value       lower 90%   higher 90%
Photon index: 1.62838     ( -0.180427   0.182805 )
Norm@50keV  : 2.07442E-02    ( -0.00257668   0.00256138 )
------------------------------------------------------------
#Fit statistic : Chi-Squared =          75.46 using 59 PHA bins.
# Reduced chi-squared =          1.324 for     57 degrees of freedom
# Null hypothesis probability =   5.136634e-02

Photon flux (15-150 keV)    in 1 sec: 2.68968 ( -0.32728  0.327667 ) ph/cm2/s
Energy fluence (15-150 keV)             : 1.9337e-07 ( -2.51313e-08  2.53066e-08 ) ergs/cm2
Cutoff power-law model
Time interval is from   -0.300 sec. to    0.700 sec.
Spectral model in the cutoff power-law:
------------------------------------------------------------
Parameters  : value       lower 90%   higher 90%
Photon index: -0.247503     ( -1.55931   1.1357 )
Epeak [keV] : 53.3143      ( -8.21262 18.4031 )
Norm@50keV  : 0.227234    ( -0.228083   1.44226 )
------------------------------------------------------------
#Fit statistic : Chi-Squared =          66.14 using 59 PHA bins.
# Reduced chi-squared =          1.181 for     56 degrees of freedom
# Null hypothesis probability =   1.666039e-01

Photon flux (15-150 keV)    in 1 sec: 2.60111 ( -0.33818  0.33585 ) ph/cm2/s
Energy fluence (15-150 keV)             : 1.71392e-07 ( -2.6845e-08  2.8415e-08 ) ergs/cm2
Band function
Time interval is from   -0.300 sec. to    0.700 sec.

Spectral model in the Band function:
------------------------------------------------------------
Parameters  : value       lower 90%   higher 90%
alpha       : 1.22552   ( -1.53245   -1.24859 )
beta        : -2.52508    ( -1.30982   0.56923 )
Epeak [keV] : 45.4729      ( -10.2737 12.3067 )
Norm@50keV   : 0.940679    ( -1.0528   166.661 )
------------------------------------------------------------
#Fit statistic : Chi-Squared =          62.28 using 59 PHA bins.
# Reduced chi-squared =          1.132 for     55 degrees of freedom
# Null hypothesis probability =   2.330193e-01

Photon flux (15-150 keV)    in 1 sec:  (    ) ph/cm2/s
Energy fluence (15-150 keV)             : 1.81052e-07 ( -1.81045e-07  -2.6314e-08 ) ergs/cm2
Single BB
Spectral model blackbody:
------------------------------------------------------------
Parameters  : value    Lower 90%  Upper 90%
kT [keV]    : 12.5121  (-1.36361  1.56398)
R^2/D10^2   : 0.628589  (-0.225166   0.334453)
(R is the radius in km and D10 is the distance to the source in units of 10 kpc)
------------------------------------------------------------
#Fit statistic : Chi-Squared =          68.37 using 59 PHA bins.
# Reduced chi-squared =          1.199 for     57 degrees of freedom
# Null hypothesis probability =   1.439936e-01

Energy  Fluence     90% Error
[keV]   [erg/cm2]   [erg/cm2]
15- 25  2.086e-08   4.480e-09
25- 50  6.889e-08   1.027e-08
50-150  6.663e-08   1.746e-08
15-150  1.564e-07   2.290e-08
Thermal bremsstrahlung (OTTB)
Spectral model: thermal bremsstrahlung
------------------------------------------------------------
Parameters  : value         Lower 90%    Upper 90%
kT [keV]    : 143.131       (-52.106      -139.793)
Norm        : 11.3572       (-1.52916     1.90872)
------------------------------------------------------------
#Fit statistic : Chi-Squared =          71.44 using 59 PHA bins.
# Reduced chi-squared =          1.253 for     57 degrees of freedom
# Null hypothesis probability =   9.438272e-02

Energy  Fluence     90% Error
[keV]   [erg/cm2]   [erg/cm2]
15- 25  2.928e-08   4.975e-09
25- 50  5.390e-08   1.726e-08
50-150  1.043e-07   5.737e-08
15-150  1.875e-07   7.526e-08
Double BB
------------------------------------------------------------
Parameters  : value         Lower 90%    Upper 90%
kT1 [keV]   : 10.9845        (-1.36387      1.69715)
R1^2/D10^2  : 0.925076        (-0.358424      0.56304)
kT2 [keV]   : 200.000        (      )
R2^2/D10^2  : 1.91527E-04    (-9.94884e-05   0.00122635)
------------------------------------------------------------
#Fit statistic : Chi-Squared =          59.19 using 59 PHA bins.
#Fit statistic : Chi-Squared =          58.75 using 59 PHA bins.
# Reduced chi-squared =          1.076 for     55 degrees of freedom
# Reduced chi-squared =          1.068 for     55 degrees of freedom
# Null hypothesis probability =   3.253602e-01
# Null hypothesis probability =   3.397884e-01

Energy  Fluence     90% Error
[keV]   [erg/cm2]   [erg/cm2]
15- 25  2.362e-08   6.550e-09
25- 50  6.770e-08   1.849e-08
50-150  9.657e-08   4.557e-08
15-150  1.879e-07   7.190e-08
Pre-slew spectrum (Pre-slew PHA with pre-slew DRM)
Power-law model
Spectral model in power-law:
------------------------------------------------------------
Parameters  : value       lower 90%   higher 90%
Photon index: 1.71683     ( -0.159191   0.162762 )
Norm@50keV  : 4.46748E-03    ( -0.000457013   0.000451684 )
------------------------------------------------------------
#Fit statistic : Chi-Squared =          57.87 using 59 PHA bins.
# Reduced chi-squared =          1.015 for     57 degrees of freedom
# Null hypothesis probability =   4.428182e-01

Photon flux (15-150 keV)    in 25.72 sec: 0.596863 ( -0.0562073  0.0562531 ) ph/cm2/s
Energy fluence (15-150 keV)             : 1.06253e-06 ( -1.128e-07  1.14074e-07 ) ergs/cm2
Cutoff power-law model
Spectral model in the cutoff power-law:
------------------------------------------------------------
Parameters  : value       lower 90%   higher 90%
Photon index: 1.06815     ( -0.902637   0.353193 )
Epeak [keV] : 63.4344      ( -16.5125 -63.4669 )
Norm@50keV  : 1.02805E-02    ( -0.00596633   0.0228307 )
------------------------------------------------------------
#Fit statistic : Chi-Squared =          55.55 using 59 PHA bins.
# Reduced chi-squared =         0.9919 for     56 degrees of freedom
# Null hypothesis probability =   4.919071e-01

Photon flux (15-150 keV)    in 25.72 sec: 0.583013 ( -0.058742  0.058484 ) ph/cm2/s
Energy fluence (15-150 keV)             : 9.96853e-07 ( -1.36033e-07  1.36203e-07 ) ergs/cm2
Band function

Spectral model in the Band function:
------------------------------------------------------------
Parameters  : value       lower 90%   higher 90%
alpha       : 1.29086   ( -1.43214   -0.235649 )
beta        : -2.05254    ( -0.628429   0.349726 )
Epeak [keV] : 34.9427      ( -14.3484 24.6812 )
Norm@50keV   : 0.420323    ( -0.438186   92.2594 )
------------------------------------------------------------
#Fit statistic : Chi-Squared =          51.42 using 59 PHA bins.
# Reduced chi-squared =         0.9349 for     55 degrees of freedom
# Null hypothesis probability =   6.121561e-01

Photon flux (15-150 keV)    in 25.72 sec:  (    ) ph/cm2/s
Energy fluence (15-150 keV)             : 1.01101e-06 ( -1.01083e-06  -1.19482e-07 ) ergs/cm2
S(25-50 keV) vs. S(50-100 keV) plot
S(25-50 keV)  = 2.90e-07
S(50-100 keV) = 3.52e-07
T90 vs. Hardness ratio plot
T90                                   = 21.4679999351501 sec.
Hardness ratio (energy fluence ratio) = 1.21379
Color vs. Color plot
Count Ratio  (25-50 keV) / (15-25 keV) = 1.47979
Count Ratio (50-100 keV) / (15-25 keV) = 0.690994
Mask shadow pattern
IMX = -1.157392562803334E-01, IMY = -6.663447067642172E-01
TIME vs. PHA plot around the trigger time
Blue+Cyan dotted lines: Time interval of the scaled map
From 0.000000 to 1.024000
TIME vs. DetID plot around the trigger time
Blue+Cyan dotted lines: Time interval of the scaled map
From 0.000000 to 1.024000
100 us light curve (15-350 keV)

Blue+Cyan dotted lines: Time interval of the scaled map
From 0.000000 to 1.024000
Spacecraft aspect plot
Bright source in the pre-burst/pre-slew/post-slew images
Pre-burst image of 15-350 keV band
Time interval of the image:
-85.691400 -1.624000

# RAcent  DECcent POSerr Theta    Phi  PeakCts   SNR AngSep     Name
#  [deg]    [deg]    ['] [deg]  [deg]                   [']
 31.1866  68.6732    2.2  24.1   77.9   0.6053   5.2 ------	UNKNOWN
268.7684  44.5958    3.1  54.2  171.1   1.5834   3.7 ------	UNKNOWN
260.0376  50.4404    2.4  47.6  177.5   0.8944   4.7 ------	UNKNOWN
Pre-slew background subtracted image of 15-350 keV band
Time interval of the image:
-1.624000 24.100000

# RAcent  DECcent POSerr Theta    Phi  PeakCts   SNR AngSep     Name
#  [deg]    [deg]    ['] [deg]  [deg]                   [']
357.9665  63.0901    0.7  34.1   99.9   1.9670  15.7 ------	UNKNOWN
Post-slew image of 15-350 keV band
Time interval of the image:
556.108590 962.654600

# RAcent  DECcent POSerr Theta    Phi  PeakCts   SNR AngSep     Name
#  [deg]    [deg]    ['] [deg]  [deg]                   [']
135.6009 -40.6368    5.6  55.7 -169.5  -2.1923  -2.1    5.9	Vela X-1
170.2169 -60.5401    6.4  38.1  158.2   1.0415   1.8    5.8	Cen X-3
186.6509 -62.7958    1.8  34.9  145.7   3.4711   6.5    1.5	GX 301-2
244.9831 -15.6433    0.4  39.9   30.0  20.4882  32.7    0.3	Sco X-1
212.6614 -33.6105    2.9   8.0   71.7   1.0907   3.9 ------	UNKNOWN
167.7587 -33.1577    2.9  31.2 -154.0   1.4303   4.0 ------	UNKNOWN
134.7336 -31.6246    4.8  58.8 -159.3   6.2995   2.4 ------	UNKNOWN
Plot creation:
Sat May 30 18:31:49 EDT 2015