Special notes of this burst
Image
Pre-slew 15.0-350.0 keV image (Event data)
#   RAcent    DECcent   POSerr    Theta     Phi              Peak Cts       SNR   Name
  288.8199    -1.5935   0.0126    35.9570    37.1032         1.1937008     15.274 TRIG_00536172

Foreground time interval of the image:
 -2.716   2.564 (delta_t =   5.280 [sec])
Background time interval of the image:
-187.755  -2.716 (delta_t = 185.039 [sec])
Lightcurves
Notes:
- 1) The mask-weighted light curves are using the flight position.
- 2) Multiple plots of different time binning/intervals are shown to cover all scenarios of short/long GRBs, rate/image triggers, and real/false positives.
- 3) For all the mask-weighted lightcurves, the y-axis units are counts/sec/det where a det is 0.4 x 0.4 = 0.16 sq cm.
- 4) The verticle lines correspond to following: green dotted lines are T50 interval, black dotted lines are T90 interval, blue solid line(s) is a spacecraft slew start time, and orange solid line(s) is a spacecraft slew end time.
- 5) Time of each bin is in the middle of the bin.
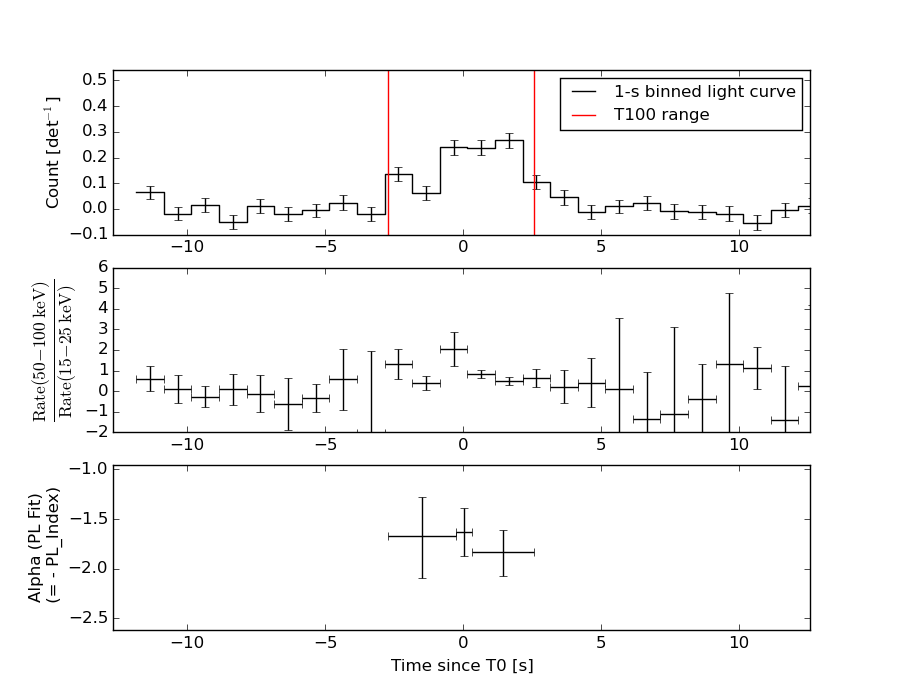
1 s binning
From T0-310 s to T0+310 s
From T100_start - 20 s to T100_end + 30 s
Full time interval
64 ms binning
Full time interval
From T100_start to T100_end
From T0-5 sec to T0+5 sec
16 ms binning
From T100_start-5 s to T100_start+5 s
Blue+Cyan dotted lines: Time interval of the scaled map
From 0.000000 to 0.512000
8 ms binning
From T100_start-3 s to T100_start+3 s
Blue+Cyan dotted lines: Time interval of the scaled map
From 0.000000 to 0.512000
2 ms binning
From T100_start-1 s to T100_start+1 s
Blue+Cyan dotted lines: Time interval of the scaled map
From 0.000000 to 0.512000
SN=5 or 10 sec. binning (whichever binning is satisfied first)
SN=5 or 10 sec. binning (T < 200 sec)
Quad-rate summed light curves (from T0-300s to T0+1000s)
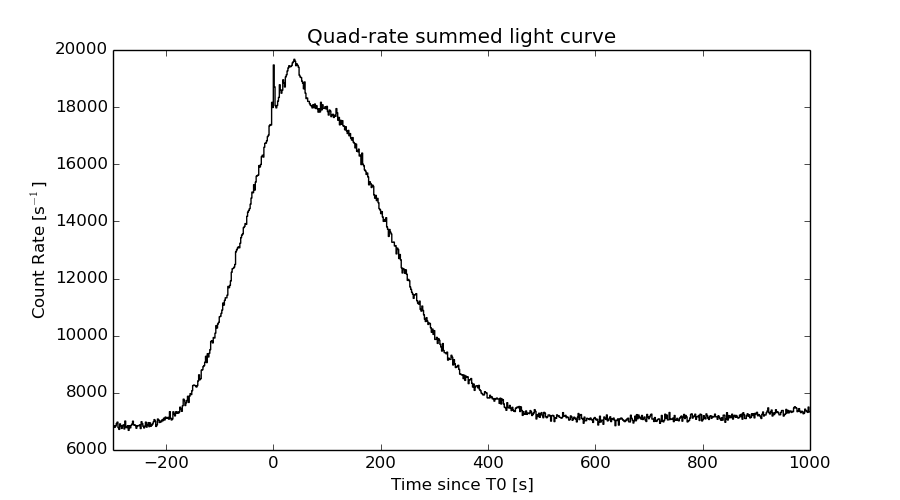
The mask-weighted light curves based on cleaned DPHs

Spectral Evolution
Spectra
Notes:
- 1) The fitting includes the systematic errors.
- 2) When the burst includes telescope slew time periods, the fitting uses an average response file made from multiple 5-s response files through out the slew time plus single time preiod for the non-slew times, and weighted by the total counts in the corresponding time period using addrmf. An average response file is needed becuase a spectral fit using the pre-slew DRM will introduce some errors in both a spectral shape and a normalization if the PHA file contains a lot of the slew/post-slew time interval.
- 3) For fits to more complicated models (e.g. a power-law over a cutoff power-law), the BAT team has decided to require a chi-square improvement of more than 6 for each extra dof.
Time averaged spectrum fit using the average DRM
Power-law model

Time interval is from   -2.716 sec. to    2.564 sec.

Spectral model in power-law:
------------------------------------------------------------
Parameters  : value       lower 90%   higher 90%
Photon index: 1.74616     ( -0.169493   0.174387 )
Norm@50keV  : 1.34538E-02    ( -0.00144954   0.00142769 )
------------------------------------------------------------
#Fit statistic : Chi-Squared =          43.57 using 59 PHA bins.
# Reduced chi-squared =         0.7644 for     57 degrees of freedom
# Null hypothesis probability =   9.047036e-01

Photon flux (15-150 keV)    in 5.28 sec: 1.81662 ( -0.174825  0.174946 ) ph/cm2/s
Energy fluence (15-150 keV)             : 6.55628e-07 ( -7.27299e-08  7.376e-08 ) ergs/cm2
Cutoff power-law model

Time interval is from   -2.716 sec. to    2.564 sec.
Spectral model in the cutoff power-law:
------------------------------------------------------------
Parameters  : value       lower 90%   higher 90%
Photon index: 1.28865     ( -0.814573   0.578178 )
Epeak [keV] : 69.9120      ( -22.1813 -69.9124 )
Norm@50keV  : 2.40080E-02    ( -0.0114196   0.0429741 )
------------------------------------------------------------
#Fit statistic : Chi-Squared =          42.30 using 59 PHA bins.
# Reduced chi-squared =         0.7553 for     56 degrees of freedom
# Null hypothesis probability =   9.121553e-01

Photon flux (15-150 keV)    in 5.28 sec: 1.78232 ( -0.18238  0.17964 ) ph/cm2/s
Energy fluence (15-150 keV)             : 6.27158e-07 ( -8.33659e-08  8.50766e-08 ) ergs/cm2
Band function
Time interval is from   -2.716 sec. to    2.564 sec.

Spectral model in the Band function:
------------------------------------------------------------
Parameters  : value       lower 90%   higher 90%
alpha       : -0.843909   ( 0.835221   0.835221 )
beta        : -2.01640    ( 2.01827   0.371284 )
Epeak [keV] : 49.0872      ( -48.0032 573.829 )
Norm@50keV   : 4.65499E-02    ( -0.0505452   1303.52 )
------------------------------------------------------------
#Fit statistic : Chi-Squared =          41.72 using 59 PHA bins.
# Reduced chi-squared =         0.7586 for     55 degrees of freedom
# Null hypothesis probability =   9.065708e-01

Photon flux (15-150 keV)    in 5.28 sec: 1.77954 ( 5.22046  -0.18093 ) ph/cm2/s
Energy fluence (15-150 keV)             : 6.31372e-07 ( 0  0 ) ergs/cm2
Single BB
Spectral model blackbody:
------------------------------------------------------------
Parameters  : value    Lower 90%  Upper 90%
kT [keV]    : 11.7138  (-1.25212  1.43626)
R^2/D10^2   : 0.482442  (-0.16952   0.252696)
(R is the radius in km and D10 is the distance to the source in units of 10 kpc)
------------------------------------------------------------
#Fit statistic : Chi-Squared =          62.56 using 59 PHA bins.
# Reduced chi-squared =          1.097 for     57 degrees of freedom
# Null hypothesis probability =   2.855644e-01

Energy  Fluence     90% Error
[keV]   [erg/cm2]   [erg/cm2]
15- 25  7.375e-08   1.296e-08
25- 50  2.255e-07   2.835e-08
50-150  1.830e-07   4.240e-08
15-150  4.823e-07   6.125e-08
Thermal bremsstrahlung (OTTB)

Spectral model: thermal bremsstrahlung
------------------------------------------------------------
Parameters  : value         Lower 90%    Upper 90%
kT [keV]    : 113.447       (-36.2275      66.4122)
Norm        : 7.80325       (-0.932662     1.18783)
------------------------------------------------------------
#Fit statistic : Chi-Squared =          42.28 using 59 PHA bins.
# Reduced chi-squared =         0.7417 for     57 degrees of freedom
# Null hypothesis probability =   9.272305e-01

Energy  Fluence     90% Error
[keV]   [erg/cm2]   [erg/cm2]
15- 25  1.075e-07   1.536e-08
25- 50  1.904e-07   2.648e-08
50-150  3.304e-07   1.433e-07
15-150  6.284e-07   1.587e-07
Double BB

Spectral model: bbodyrad<1> + bbodyrad<2>
------------------------------------------------------------
Parameters  : value         Lower 90%    Upper 90%
kT1 [keV]   : 7.36999        (-2.28686      2.06723)
R1^2/D10^2  : 1.86434        (-0.958524      3.98714)
kT2 [keV]   : 25.6859        (-9.14656      28.7278)
R2^2/D10^2  : 1.78125E-02    (-0.0149248   0.0352391)
------------------------------------------------------------
#Fit statistic : Chi-Squared =          42.52 using 59 PHA bins.
# Reduced chi-squared =         0.7730 for     55 degrees of freedom
# Null hypothesis probability =   8.905625e-01

Energy  Fluence     90% Error
[keV]   [erg/cm2]   [erg/cm2]
15- 25  1.010e-07   4.634e-08
25- 50  1.975e-07   8.809e-08
50-150  3.247e-07   1.750e-07
15-150  6.232e-07   2.884e-07
Peak spectrum fit
Power-law model
Time interval is from   -0.308 sec. to    0.692 sec.

Spectral model in power-law:
------------------------------------------------------------
Parameters  : value       lower 90%   higher 90%
Photon index: 1.65991     ( -0.210452   0.217744 )
Norm@50keV  : 2.49970E-02    ( -0.00342977   0.00338243 )
------------------------------------------------------------
#Fit statistic : Chi-Squared =          46.92 using 59 PHA bins.
# Reduced chi-squared =         0.8231 for     57 degrees of freedom
# Null hypothesis probability =   8.272306e-01

Photon flux (15-150 keV)    in 1 sec: 3.27474 ( -0.417494  0.417878 ) ph/cm2/s
Energy fluence (15-150 keV)             : 2.32256e-07 ( -3.34187e-08  3.38994e-08 ) ergs/cm2
Cutoff power-law model

Time interval is from   -0.308 sec. to    0.692 sec.
Spectral model in the cutoff power-law:
------------------------------------------------------------
Parameters  : value       lower 90%   higher 90%
Photon index: 0.687235     ( -1.09718   0.892176 )
Epeak [keV] : 64.5383      ( -15.0997 142.939 )
Norm@50keV  : 8.08913E-02    ( -0.0808896   0.214798 )
------------------------------------------------------------
#Fit statistic : Chi-Squared =          43.41 using 59 PHA bins.
# Reduced chi-squared =         0.7752 for     56 degrees of freedom
# Null hypothesis probability =   8.902932e-01

Photon flux (15-150 keV)    in 1 sec: 3.16449 ( -0.43023  0.43014 ) ph/cm2/s
Energy fluence (15-150 keV)             : 2.17913e-07 ( -3.4589e-08  3.6023e-08 ) ergs/cm2
Band function

Time interval is from   -0.308 sec. to    0.692 sec.

Spectral model in the Band function:
------------------------------------------------------------
Parameters  : value       lower 90%   higher 90%
alpha       : -0.686697   ( -0.53346   1.49171 )
beta        : -10.0000    ( 10   3.55271e-15 )
Epeak [keV] : 64.5083      ( -15.0805 143.985 )
Norm@50keV   : 8.09529E-02    ( -0.0513852   0.214853 )
------------------------------------------------------------
#Fit statistic : Chi-Squared =          43.41 using 59 PHA bins.
# Reduced chi-squared =         0.7893 for     55 degrees of freedom
# Null hypothesis probability =   8.705038e-01

Photon flux (15-150 keV)    in 1 sec: 3.19933 (    ) ph/cm2/s
Energy fluence (15-150 keV)             : 2.1887e-07 ( -2.18863e-07  -3.5746e-08 ) ergs/cm2
Single BB
Spectral model blackbody:
------------------------------------------------------------
Parameters  : value    Lower 90%  Upper 90%
kT [keV]    : 13.6295  (-1.82362  2.13547)
R^2/D10^2   : 0.525787  (-0.217031   0.359494)
(R is the radius in km and D10 is the distance to the source in units of 10 kpc)
------------------------------------------------------------
#Fit statistic : Chi-Squared =          52.03 using 59 PHA bins.
# Reduced chi-squared =         0.9129 for     57 degrees of freedom
# Null hypothesis probability =   6.614260e-01

Energy  Fluence     90% Error
[keV]   [erg/cm2]   [erg/cm2]
15- 25  2.068e-08   4.800e-09
25- 50  7.485e-08   1.268e-08
50-150  9.027e-08   2.318e-08
15-150  1.858e-07   3.285e-08
Thermal bremsstrahlung (OTTB)
Spectral model: thermal bremsstrahlung
------------------------------------------------------------
Parameters  : value         Lower 90%    Upper 90%
kT [keV]    : 143.489       (-56.6167      -139.566)
Norm        : 13.5952       (-1.91505     2.45312)
------------------------------------------------------------
#Fit statistic : Chi-Squared =          44.61 using 59 PHA bins.
# Reduced chi-squared =         0.7827 for     57 degrees of freedom
# Null hypothesis probability =   8.836010e-01

Energy  Fluence     90% Error
[keV]   [erg/cm2]   [erg/cm2]
15- 25  3.504e-08   1.580e-08
25- 50  6.453e-08   2.453e-08
50-150  1.250e-07   7.461e-08
15-150  2.246e-07   1.075e-07
Double BB
Spectral model: bbodyrad<1> + bbodyrad<2>
------------------------------------------------------------
Parameters  : value         Lower 90%    Upper 90%
kT1 [keV]   : 5.19614        (-3.08037      3.54959)
R1^2/D10^2  : 8.18673        (-6.76805      848.496)
kT2 [keV]   : 17.9761        (-3.90843      7.5346)
R2^2/D10^2  : 0.162267    (-0.125477   0.278264)
------------------------------------------------------------
#Fit statistic : Chi-Squared =          42.56 using 59 PHA bins.
# Reduced chi-squared =         0.7738 for     55 degrees of freedom
# Null hypothesis probability =   8.896968e-01

Energy  Fluence     90% Error
[keV]   [erg/cm2]   [erg/cm2]
15- 25  3.367e-08   1.836e-08
25- 50  6.514e-08   3.219e-08
50-150  1.146e-07   6.491e-08
15-150  2.134e-07   1.098e-07
Pre-slew spectrum (Pre-slew PHA with pre-slew DRM)
Power-law model
Spectral model in power-law:
------------------------------------------------------------
Parameters  : value       lower 90%   higher 90%
Photon index: 1.74616     ( -0.169493   0.174387 )
Norm@50keV  : 1.34538E-02    ( -0.00144954   0.00142769 )
------------------------------------------------------------
#Fit statistic : Chi-Squared =          43.57 using 59 PHA bins.
# Reduced chi-squared =         0.7644 for     57 degrees of freedom
# Null hypothesis probability =   9.047036e-01

Photon flux (15-150 keV)    in 5.28 sec: 1.81662 ( -0.174825  0.174946 ) ph/cm2/s
Energy fluence (15-150 keV)             : 6.55628e-07 ( -7.27299e-08  7.376e-08 ) ergs/cm2
Cutoff power-law model
Spectral model in the cutoff power-law:
------------------------------------------------------------
Parameters  : value       lower 90%   higher 90%
Photon index: 1.28865     ( -0.814573   0.578178 )
Epeak [keV] : 69.9120      ( -22.1813 -69.9124 )
Norm@50keV  : 2.40080E-02    ( -0.0114196   0.0429741 )
------------------------------------------------------------
#Fit statistic : Chi-Squared =          42.30 using 59 PHA bins.
# Reduced chi-squared =         0.7553 for     56 degrees of freedom
# Null hypothesis probability =   9.121553e-01

Photon flux (15-150 keV)    in 5.28 sec: 1.78232 ( -0.18238  0.17965 ) ph/cm2/s
Energy fluence (15-150 keV)             : 6.27158e-07 ( -8.33659e-08  8.50766e-08 ) ergs/cm2
Band function

Spectral model in the Band function:
------------------------------------------------------------
Parameters  : value       lower 90%   higher 90%
alpha       : -0.843909   ( 0.835221   0.835221 )
beta        : -2.01640    ( 2.01827   0.371284 )
Epeak [keV] : 49.0872      ( -48.0032 548.91 )
Norm@50keV   : 4.65499E-02    ( -0.0505452   1303.18 )
------------------------------------------------------------
#Fit statistic : Chi-Squared =          41.72 using 59 PHA bins.
# Reduced chi-squared =         0.7586 for     55 degrees of freedom
# Null hypothesis probability =   9.065708e-01

Photon flux (15-150 keV)    in 5.28 sec: 1.77954 ( 5.22046  -0.18093 ) ph/cm2/s
Energy fluence (15-150 keV)             : 6.31372e-07 ( 0  0 ) ergs/cm2
S(25-50 keV) vs. S(50-100 keV) plot
S(25-50 keV)  = 1.81e-07
S(50-100 keV) = 2.16e-07
T90 vs. Hardness ratio plot
T90                                   = 4.60799998044968 sec.
Hardness ratio (energy fluence ratio) = 1.19337
Color vs. Color plot
Count Ratio  (25-50 keV) / (15-25 keV) = 1.37041
Count Ratio (50-100 keV) / (15-25 keV) = 0.833849
Mask shadow pattern
IMX = 5.785397549756811E-01, IMY = -4.375974786548340E-01
TIME vs. PHA plot around the trigger time
Blue+Cyan dotted lines: Time interval of the scaled map
From 0.000000 to 0.512000
TIME vs. DetID plot around the trigger time
Blue+Cyan dotted lines: Time interval of the scaled map
From 0.000000 to 0.512000
100 us light curve (15-350 keV)
Blue+Cyan dotted lines: Time interval of the scaled map
From 0.000000 to 0.512000
Spacecraft aspect plot
Bright source in the pre-burst/pre-slew/post-slew images
Pre-burst image of 15-350 keV band
Time interval of the image:
-187.755400 -2.716000

# RAcent  DECcent POSerr Theta    Phi  PeakCts   SNR AngSep     Name
#  [deg]    [deg]    ['] [deg]  [deg]                   [']
186.5332 -62.6913    4.2  58.7 -153.3  -8.9124  -2.8    5.8	GX 301-2
245.0045 -15.6312    1.2  23.7  -62.4   6.3623   9.8    1.5	Sco X-1
255.8507 -37.6715    7.6  11.1 -141.3   0.7274   1.5   12.2	4U 1700-377
256.2850 -36.2489    0.0  10.0 -136.4  -0.3725  -0.8   12.7	GX 349+2
262.9889 -24.8942    5.7   5.6  -30.0   0.9277   2.0    9.0	GX 1+4
264.6857 -44.5947    6.6  14.6  177.4   0.8385   1.7    9.0	4U 1735-44
268.3875  -1.3037    5.4  28.8    0.7  -1.1776  -2.2    9.0	SW J1753.5-0127
270.3628 -24.9866    4.7   6.6   36.3   1.0778   2.4    7.0	GX 5-1
270.3583 -25.8716    3.0   5.9   41.7   1.7385   3.9    8.3	GRS 1758-258
273.9649 -13.8853    7.7  17.9   22.4   0.7475   1.5    9.4	GX 17+2
275.9257 -30.3679  377.4   8.9   89.9   0.0156   0.0    0.1	H1820-303
285.1500 -24.9733   10.5  18.0   73.5   0.6376   1.1    7.0	HT1900.1-2455
288.8338  10.9472   15.6  46.7   27.1   1.0027   0.7    2.1	GRS 1915+105
262.9007 -33.9771    7.5   4.6 -156.1   0.7329   1.5    9.6	GX 354-0
306.9751 -14.7399    3.7  40.9   72.4   6.6480   3.1 ------	UNKNOWN
295.8001   3.5394    2.7  44.3   40.9   5.9252   4.3 ------	UNKNOWN
301.3533 -24.8278    2.9  32.0   84.4   3.6803   4.0 ------	UNKNOWN
243.1094 -78.1606    2.9  49.2 -179.1   4.3664   4.0 ------	UNKNOWN
265.8762   5.2902    4.1  35.3   -4.6   1.6704   2.8 ------	UNKNOWN
263.5494   9.8124    3.2  39.8   -8.2   2.5392   3.6 ------	UNKNOWN
251.7937  23.8175    3.2  55.4  -20.4   6.4115   3.6 ------	UNKNOWN
	UNKNOWN
Pre-slew background subtracted image of 15-350 keV band
Time interval of the image:
-2.716000 2.564000

# RAcent  DECcent POSerr Theta    Phi  PeakCts   SNR AngSep     Name
#  [deg]    [deg]    ['] [deg]  [deg]                   [']
186.6605 -62.7593   40.1  58.6 -153.3  -0.0757  -0.3    0.7	GX 301-2
245.0113 -15.7891   11.2  23.6  -62.7  -0.0519  -1.0    9.1	Sco X-1
256.0040 -37.9986    4.1  11.3 -142.9  -0.1121  -2.8    9.3	4U 1700-377
256.4599 -36.5782   13.5  10.1 -138.3   0.0331   0.9    9.4	GX 349+2
262.9761 -24.7043   42.1   5.8  -29.4  -0.0110  -0.3    3.1	GX 1+4
264.6699 -44.2942    6.5  14.3  177.6  -0.0699  -1.8    9.9	4U 1735-44
268.4033  -1.4545   24.7  28.7    0.8   0.0226   0.5    2.1	SW J1753.5-0127
270.1685 -25.2130  150.6   6.3   36.4  -0.0030  -0.1   10.2	GX 5-1
270.4611 -25.8889   68.1   5.9   42.5   0.0069   0.2   12.2	GRS 1758-258
274.1486 -14.1753    5.1  17.7   23.3  -0.0961  -2.3   11.8	GX 17+2
275.8205 -30.4003   12.0   8.9   90.1  -0.0419  -1.0    5.8	H1820-303
285.1965 -25.0558    4.4  18.1   73.8  -0.1198  -2.6   11.9	HT1900.1-2455
288.7976  10.9219    5.0  46.6   27.1  -0.2739  -2.3    1.4	GRS 1915+105
262.9127 -33.8497   13.6   4.5 -155.4  -0.0346  -0.8    3.9	GX 354-0
288.8199  -1.5935    0.8  36.0   37.1   1.1937  15.3 ------	UNKNOWN
285.0964   3.7999    2.9  38.6   27.2   0.2851   4.0 ------	UNKNOWN
235.4193 -67.5001    2.2  41.6 -168.2   0.3539   5.3 ------	UNKNOWN
228.0810 -71.1827    2.7  46.0 -169.2   0.3318   4.3 ------	UNKNOWN
215.8965 -48.5471    2.6  41.8 -135.8   0.3400   4.3 ------	UNKNOWN
190.0052 -63.5308    3.0  57.1 -154.1   0.7720   3.9 ------	UNKNOWN
193.1989 -57.6535    2.3  55.8 -147.0   1.1760   5.1 ------	UNKNOWN
	UNKNOWN
Post-slew image of 15-350 keV band
Time interval of the image:
79.044600 542.187200

# RAcent  DECcent POSerr Theta    Phi  PeakCts   SNR AngSep     Name
#  [deg]    [deg]    ['] [deg]  [deg]                   [']
254.5015  35.3832    5.7  48.9  -27.8  -5.4559  -2.0    3.3	Her X-1
255.9005 -37.6972    5.9  47.1 -134.4  -7.7048  -1.9    9.7	4U 1700-377
256.2511 -36.3116   81.4  45.9 -133.2   0.5601   0.1   11.1	GX 349+2
263.0976 -24.6140    7.3  33.8 -125.3   3.0115   1.6    9.3	GX 1+4
264.9253 -44.5085    9.4  47.8 -147.4   3.6817   1.2    8.6	4U 1735-44
268.3613  -1.5966    5.8  20.4  -80.6   2.8253   2.0    8.7	SW J1753.5-0127
270.4311 -25.0206    8.9  29.4 -134.7   2.1846   1.3    8.7	GX 5-1
270.4345 -25.7815   11.6  30.0 -135.7   1.6707   1.0    7.5	GRS 1758-258
273.9785 -14.1841    6.8  19.3 -121.8   2.2576   1.7    9.0	GX 17+2
275.9726 -30.3591    6.3  31.2 -148.6   2.9459   1.8    2.5	H1820-303
285.0294 -24.9215  431.1  23.6 -161.8   0.0352   0.0    0.4	HT1900.1-2455
288.9188  10.8848    8.8  12.5   10.3   1.5887   1.3    8.0	GRS 1915+105
299.6413  35.3480    5.1  38.3   24.0   4.6308   2.3    9.1	Cyg X-1
308.1123  40.9523  216.4  46.0   30.0   0.1786   0.1    0.1	Cyg X-3
263.1585 -33.9629   46.6  40.3 -136.6   0.5454   0.2   11.4	GX 354-0
303.5030 -25.4640    2.6  27.8  160.2   6.8004   4.4 ------	UNKNOWN
286.2551  48.1821    2.7  49.8    7.5  12.7779   4.3 ------	UNKNOWN
253.6375  44.1074    3.3  55.4  -20.4  15.2954   3.6 ------	UNKNOWN
Plot creation:
Sat May 30 18:07:32 EDT 2015