Special notes of this burst
Image
Pre-slew 15.0-350.0 keV image (Event data)
#   RAcent    DECcent   POSerr    Theta     Phi              Peak Cts       SNR   Name
  170.7761    -3.5172   0.0061     4.6259   -31.7937         4.9931852     31.756 TRIG_00537195

Foreground time interval of the image:
-152.211  15.389 (delta_t = 167.600 [sec])
Background time interval of the image:
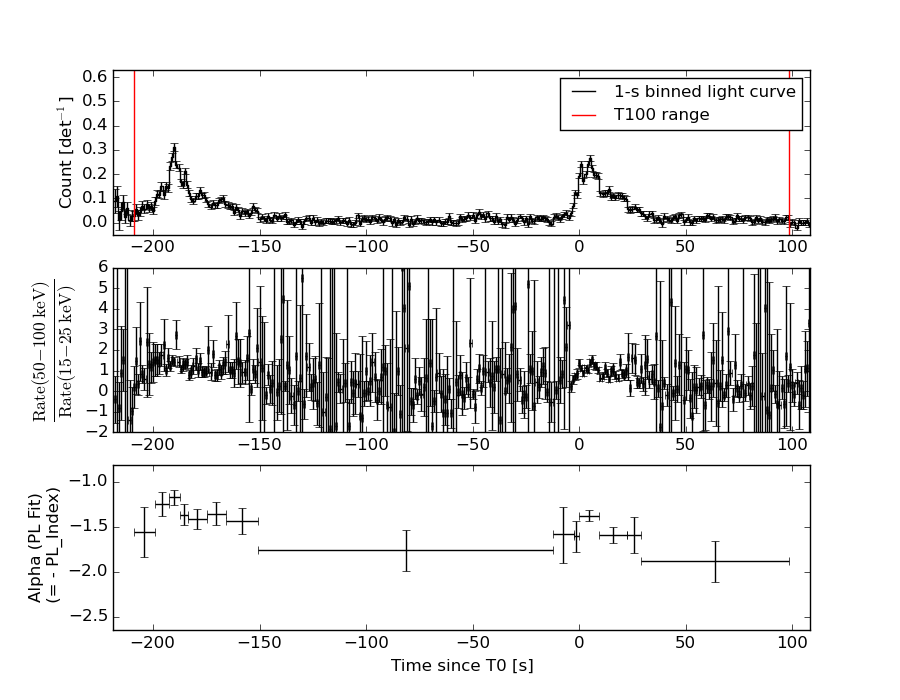
Lightcurves
Notes:
- 1) The mask-weighted light curves are using the flight position.
- 2) Multiple plots of different time binning/intervals are shown to cover all scenarios of short/long GRBs, rate/image triggers, and real/false positives.
- 3) For all the mask-weighted lightcurves, the y-axis units are counts/sec/det where a det is 0.4 x 0.4 = 0.16 sq cm.
- 4) The verticle lines correspond to following: green dotted lines are T50 interval, black dotted lines are T90 interval, blue solid line(s) is a spacecraft slew start time, and orange solid line(s) is a spacecraft slew end time.
- 5) Time of each bin is in the middle of the bin.
1 s binning
From T0-310 s to T0+310 s

From T100_start - 20 s to T100_end + 30 s
Full time interval

64 ms binning
Full time interval

From T100_start to T100_end

From T0-5 sec to T0+5 sec
16 ms binning
From T100_start-5 s to T100_start+5 s
Blue+Cyan dotted lines: Time interval of the scaled map
From 0.000000 to 1.024000
8 ms binning
From T100_start-3 s to T100_start+3 s

Blue+Cyan dotted lines: Time interval of the scaled map
From 0.000000 to 1.024000
2 ms binning
From T100_start-1 s to T100_start+1 s

Blue+Cyan dotted lines: Time interval of the scaled map
From 0.000000 to 1.024000
SN=5 or 10 sec. binning (whichever binning is satisfied first)
SN=5 or 10 sec. binning (T < 200 sec)

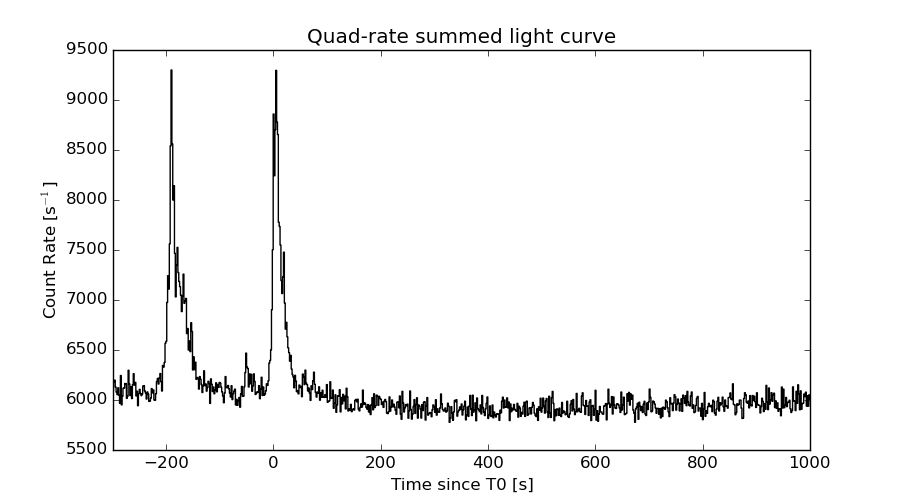
Quad-rate summed light curves (from T0-300s to T0+1000s)
Spectral Evolution
Spectra
Notes:
- 1) The fitting includes the systematic errors.
- 2) When the burst includes telescope slew time periods, the fitting uses an average response file made from multiple 5-s response files through out the slew time plus single time preiod for the non-slew times, and weighted by the total counts in the corresponding time period using addrmf. An average response file is needed becuase a spectral fit using the pre-slew DRM will introduce some errors in both a spectral shape and a normalization if the PHA file contains a lot of the slew/post-slew time interval.
- 3) For fits to more complicated models (e.g. a power-law over a cutoff power-law), the BAT team has decided to require a chi-square improvement of more than 6 for each extra dof.
Time averaged spectrum fit using the average DRM
Power-law model
Time interval is from -209.004 sec. to   98.308 sec.

Spectral model in power-law:
------------------------------------------------------------
Parameters  : value       lower 90%   higher 90%
Photon index: 1.51396     ( -0.05421   0.054271 )
Norm@50keV  : 2.73177E-03    ( -7.55408e-05   7.55037e-05 )
------------------------------------------------------------
#Fit statistic : Chi-Squared =          40.99 using 59 PHA bins.
# Reduced chi-squared =         0.7192 for     57 degrees of freedom
# Null hypothesis probability =   9.456494e-01

Photon flux (15-150 keV)    in 307.3 sec: 0.342327 ( -0.0102688  0.0102992 ) ph/cm2/s
Energy fluence (15-150 keV)             : 7.94579e-06 ( -2.361e-07  2.36684e-07 ) ergs/cm2
Cutoff power-law model
Time interval is from -209.004 sec. to   98.308 sec.
Spectral model in the cutoff power-law:
------------------------------------------------------------
Parameters  : value       lower 90%   higher 90%
Photon index: 1.42663     ( -0.217774   0.119001 )
Epeak [keV] : 347.969      ( -347.99 -347.99 )
Norm@50keV  : 3.00346E-03    ( -0.000331879   0.000777686 )
------------------------------------------------------------
#Fit statistic : Chi-Squared =          40.49 using 59 PHA bins.
# Reduced chi-squared =         0.7231 for     56 degrees of freedom
# Null hypothesis probability =   9.409899e-01

Photon flux (15-150 keV)    in 307.3 sec: 0.339973 ( -0.01158  0.005805 ) ph/cm2/s
Energy fluence (15-150 keV)             : 7.89103e-06 ( -2.74818e-07  2.70332e-07 ) ergs/cm2
Band function

Time interval is from -209.004 sec. to   98.308 sec.

Spectral model in the Band function:
------------------------------------------------------------
Parameters  : value       lower 90%   higher 90%
alpha       : -0.570665   ( 0.861479   0.861479 )
beta        : -1.55294    ( 1.55813   0.0773853 )
Epeak [keV] : 46.9445      ( -46.8744 290.035 )
Norm@50keV   : 1.13342E-02    ( -0.0114303   196.101 )
------------------------------------------------------------
#Fit statistic : Chi-Squared =          38.78 using 59 PHA bins.
# Reduced chi-squared =         0.7052 for     55 degrees of freedom
# Null hypothesis probability =   9.521295e-01

Photon flux (15-150 keV)    in 307.3 sec:  (    ) ph/cm2/s
Energy fluence (15-150 keV)             : 0 ( 0  0 ) ergs/cm2
Single BB

Spectral model blackbody:
------------------------------------------------------------
Parameters  : value    Lower 90%  Upper 90%
kT [keV]    : 15.8542  (  )
R^2/D10^2   : 3.03658E-02  (   )
(R is the radius in km and D10 is the distance to the source in units of 10 kpc)
------------------------------------------------------------
#Fit statistic : Chi-Squared =         307.32 using 59 PHA bins.
# Reduced chi-squared =         5.3916 for     57 degrees of freedom
# Null hypothesis probability =   5.282205e-36

Energy  Fluence     90% Error
[keV]   [erg/cm2]   [erg/cm2]
15- 25  4.859e-07   2.812e-08
25- 50  2.029e-06   7.268e-08
50-150  3.552e-06   1.844e-07
15-150  6.066e-06   1.967e-07
Thermal bremsstrahlung (OTTB)

Spectral model: thermal bremsstrahlung
------------------------------------------------------------
Parameters  : value         Lower 90%    Upper 90%
kT [keV]    : 200.000       (      )
Norm        : 1.39357       (-0.0383558     0.0383553)
------------------------------------------------------------
#Fit statistic : Chi-Squared =          46.71 using 59 PHA bins.
# Reduced chi-squared =         0.8194 for     57 degrees of freedom
# Null hypothesis probability =   8.329050e-01

Energy  Fluence     90% Error
[keV]   [erg/cm2]   [erg/cm2]
15- 25  1.066e-06   3.442e-08
25- 50  2.052e-06   6.131e-08
50-150  4.499e-06   1.383e-07
15-150  7.617e-06   2.397e-07
Double BB

Spectral model: bbodyrad<1> + bbodyrad<2>
------------------------------------------------------------
Parameters  : value         Lower 90%    Upper 90%
kT1 [keV]   : 7.93346        (-0.858616      0.92673)
R1^2/D10^2  : 0.232003        (-0.0679198      0.107268)
kT2 [keV]   : 30.6153        (-3.97344      5.93928)
R2^2/D10^2  : 2.46186E-03    (-0.00108006   0.00153976)
------------------------------------------------------------
#Fit statistic : Chi-Squared =          50.54 using 59 PHA bins.
# Reduced chi-squared =         0.9189 for     55 degrees of freedom
# Null hypothesis probability =   6.455279e-01

Energy  Fluence     90% Error
[keV]   [erg/cm2]   [erg/cm2]
15- 25  9.159e-07   9.250e-08
25- 50  2.072e-06   1.331e-07
50-150  4.830e-06   5.286e-07
15-150  7.818e-06   5.747e-07
Peak spectrum fit
Power-law model

Time interval is from -190.720 sec. to -189.720 sec.

Spectral model in power-law:
------------------------------------------------------------
Parameters  : value       lower 90%   higher 90%
Photon index: 1.05748     ( -0.152917   0.150812 )
Norm@50keV  : 2.18813E-02    ( -0.00181142   0.00181036 )
------------------------------------------------------------
#Fit statistic : Chi-Squared =          42.54 using 59 PHA bins.
# Reduced chi-squared =         0.7463 for     57 degrees of freedom
# Null hypothesis probability =   9.230118e-01

Photon flux (15-150 keV)    in 1 sec: 2.52868 ( -0.21276  0.213082 ) ph/cm2/s
Energy fluence (15-150 keV)             : 2.31978e-07 ( -2.18781e-08  2.20126e-08 ) ergs/cm2
Cutoff power-law model

Time interval is from -190.720 sec. to -189.720 sec.
Spectral model in the cutoff power-law:
------------------------------------------------------------
Parameters  : value       lower 90%   higher 90%
Photon index: 1.05224     ( -0.357942   0.210054 )
Epeak [keV] : 9999.35      (   )
Norm@50keV  : 2.20044E-02    ( -0.00181885   0.0103387 )
------------------------------------------------------------
#Fit statistic : Chi-Squared =          42.56 using 59 PHA bins.
# Reduced chi-squared =         0.7600 for     56 degrees of freedom
# Null hypothesis probability =   9.072788e-01

Photon flux (15-150 keV)    in 1 sec: 2.52806 ( -0.20916  0.21274 ) ph/cm2/s
Energy fluence (15-150 keV)             : 2.31315e-07 ( -2.1205e-08  2.2462e-08 ) ergs/cm2
Band function
Time interval is from -190.720 sec. to -189.720 sec.

Spectral model in the Band function:
------------------------------------------------------------
Parameters  : value       lower 90%   higher 90%
alpha       : 5.00000   ( -4.99998   -4.99998 )
beta        : -1.07543    ( -0.162847   0.160268 )
Epeak [keV] : 22.6202      ( -22.6202 6.83253 )
Norm@50keV   : 2803.07    ( -231.564   4.55904e+06 )
------------------------------------------------------------
#Fit statistic : Chi-Squared =          42.39 using 59 PHA bins.
# Reduced chi-squared =         0.7707 for     55 degrees of freedom
# Null hypothesis probability =   8.932723e-01

Photon flux (15-150 keV)    in 1 sec:  (    ) ph/cm2/s
Energy fluence (15-150 keV)             : 0 ( 0  0 ) ergs/cm2
Single BB

Spectral model blackbody:
------------------------------------------------------------
Parameters  : value    Lower 90%  Upper 90%
kT [keV]    : 22.1720  (-2.72872  3.21548)
R^2/D10^2   : 8.56573E-02  (-0.0290847   0.0432713)
(R is the radius in km and D10 is the distance to the source in units of 10 kpc)
------------------------------------------------------------
#Fit statistic : Chi-Squared =          81.02 using 59 PHA bins.
# Reduced chi-squared =          1.421 for     57 degrees of freedom
# Null hypothesis probability =   1.994921e-02

Energy  Fluence     90% Error
[keV]   [erg/cm2]   [erg/cm2]
15- 25  7.765e-09   1.348e-09
25- 50  4.125e-08   5.325e-09
50-150  1.515e-07   2.175e-08
15-150  2.005e-07   2.170e-08
Thermal bremsstrahlung (OTTB)

Spectral model: thermal bremsstrahlung
------------------------------------------------------------
Parameters  : value         Lower 90%    Upper 90%
kT [keV]    : 200.000       (      )
Norm        : 10.1586       (-0.872838     0.872809)
------------------------------------------------------------
#Fit statistic : Chi-Squared =          72.19 using 59 PHA bins.
# Reduced chi-squared =          1.266 for     57 degrees of freedom
# Null hypothesis probability =   8.470503e-02

Energy  Fluence     90% Error
[keV]   [erg/cm2]   [erg/cm2]
15- 25  2.529e-08   5.310e-09
25- 50  4.865e-08   9.525e-09
50-150  1.067e-07   5.511e-08
15-150  1.806e-07   8.076e-08
Double BB

Spectral model: bbodyrad<1> + bbodyrad<2>
------------------------------------------------------------
Parameters  : value         Lower 90%    Upper 90%
kT1 [keV]   : 6.74479        (-1.62624      2.17679)
R1^2/D10^2  : 2.38577        (-1.45007      4.21739)
kT2 [keV]   : 35.2745        (-7.1136      14.0113)
R2^2/D10^2  : 1.85252E-02    (-0.0112599   0.0182543)
------------------------------------------------------------
#Fit statistic : Chi-Squared =          40.45 using 59 PHA bins.
# Reduced chi-squared =         0.7354 for     55 degrees of freedom
# Null hypothesis probability =   9.289441e-01

Energy  Fluence     90% Error
[keV]   [erg/cm2]   [erg/cm2]
15- 25  2.000e-08   9.442e-09
25- 50  4.261e-08   1.319e-08
50-150  1.756e-07   6.322e-08
15-150  2.382e-07   6.645e-08
Pre-slew spectrum (Pre-slew PHA with pre-slew DRM)
Power-law model

Spectral model in power-law:
------------------------------------------------------------
Parameters  : value       lower 90%   higher 90%
Photon index: 1.55516     ( -0.0869538   0.0874931 )
Norm@50keV  : 1.86983E-03    ( -8.77785e-05   8.74785e-05 )
------------------------------------------------------------
#Fit statistic : Chi-Squared =          44.33 using 59 PHA bins.
# Reduced chi-squared =         0.7778 for     57 degrees of freedom
# Null hypothesis probability =   8.895052e-01

Photon flux (15-150 keV)    in 167.6 sec: 0.237065 ( -0.0110899  0.0111179 ) ph/cm2/s
Energy fluence (15-150 keV)             : 2.94808e-06 ( -1.51491e-07  1.52475e-07 ) ergs/cm2
Cutoff power-law model
Spectral model in the cutoff power-law:
------------------------------------------------------------
Parameters  : value       lower 90%   higher 90%
Photon index: 1.47952     ( -0.3516   0.153192 )
Epeak [keV] : 331.547      ( -353.65 -353.65 )
Norm@50keV  : 2.04125E-03    ( -0.000244495   0.000997056 )
------------------------------------------------------------
#Fit statistic : Chi-Squared =          44.21 using 59 PHA bins.
# Reduced chi-squared =         0.7894 for     56 degrees of freedom
# Null hypothesis probability =   8.727628e-01

Photon flux (15-150 keV)    in 167.6 sec: 0.235921 ( -0.012183  0.011865 ) ph/cm2/s
Energy fluence (15-150 keV)             : 2.92847e-06 ( -1.79969e-07  1.68203e-07 ) ergs/cm2
Band function

Spectral model in the Band function:
------------------------------------------------------------
Parameters  : value       lower 90%   higher 90%
alpha       : -1.18873   ( 1.09157   1.09157 )
beta        : -1.63215    ( 1.63049   0.149741 )
Epeak [keV] : 87.3482      ( -75.3592 -75.3592 )
Norm@50keV   : 3.03225E-03    ( -0.00117686   0 )
------------------------------------------------------------
#Fit statistic : Chi-Squared =          43.56 using 59 PHA bins.
# Reduced chi-squared =         0.7921 for     55 degrees of freedom
# Null hypothesis probability =   8.668965e-01

Photon flux (15-150 keV)    in 167.6 sec:  (    ) ph/cm2/s
Energy fluence (15-150 keV)             : 0 ( 0  0 ) ergs/cm2
S(25-50 keV) vs. S(50-100 keV) plot
S(25-50 keV)  = 1.98e-06
S(50-100 keV) = 2.77e-06
T90 vs. Hardness ratio plot

T90                                   = 226.199999928474 sec.
Hardness ratio (energy fluence ratio) = 1.39899
Color vs. Color plot
Count Ratio  (25-50 keV) / (15-25 keV) = 1.38149
Count Ratio (50-100 keV) / (15-25 keV) = 1.00768
Mask shadow pattern

IMX = 6.877185746185352E-02, IMY = 4.262995032197137E-02
TIME vs. PHA plot around the trigger time
Blue+Cyan dotted lines: Time interval of the scaled map
From 0.000000 to 1.024000
TIME vs. DetID plot around the trigger time

Blue+Cyan dotted lines: Time interval of the scaled map
From 0.000000 to 1.024000
100 us light curve (15-350 keV)

Blue+Cyan dotted lines: Time interval of the scaled map
From 0.000000 to 1.024000
Spacecraft aspect plot

Bright source in the pre-burst/pre-slew/post-slew images
Pre-burst image of 15-350 keV band
Time interval of the image:
Pre-slew background subtracted image of 15-350 keV band
Time interval of the image:
-152.211400 15.388600

# RAcent  DECcent POSerr Theta    Phi  PeakCts   SNR AngSep     Name
#  [deg]    [deg]    ['] [deg]  [deg]                   [']
135.5379 -40.4936    4.2  52.5    3.1   1.3168   2.7    3.7	Vela X-1
204.5152  47.6410    2.3  55.0  176.8   3.8321   5.1 ------	UNKNOWN
170.7761  -3.5172    0.4   4.6  -31.8   4.9920  31.7 ------	UNKNOWN
155.9854 -40.7135    2.6  43.9  -14.4   1.0894   4.4 ------	UNKNOWN
204.0446  13.2795    2.8  35.2 -142.2   0.9182   4.1 ------	UNKNOWN
Post-slew image of 15-350 keV band
Time interval of the image:
48.588590 139.208000
140.488000 962.629900

# RAcent  DECcent POSerr Theta    Phi  PeakCts   SNR AngSep     Name
#  [deg]    [deg]    ['] [deg]  [deg]                   [']
135.5564 -40.4534    7.3  48.7   19.2   2.1142   1.6    6.2	Vela X-1
170.3344 -60.6319    4.2  57.1  -16.3   6.1096   2.8    0.8	Cen X-3
188.6840  42.9630    2.6  49.2 -179.2   4.9591   4.5 ------	UNKNOWN
194.7679  40.4368    3.1  49.2 -172.4   4.3928   3.8 ------	UNKNOWN
185.1682  -9.7991    2.9  15.6  -82.2   1.9960   4.0 ------	UNKNOWN
213.5446  40.2877    5.2  58.7 -159.2  10.1938   2.2 ------	UNKNOWN
211.9942  -7.7374    5.2  41.2  -98.8   7.6803   2.2 ------	UNKNOWN
Plot creation:
Wed Jun 10 21:23:11 EDT 2015