Click here for the BAT GCN circular template
Image
Pre-slew 15-350 keV image (Event data; bkg subtracted)

#   RAcent  DECcent POSerr  Theta    Phi     Peak Cts     SNR  Name
  345.8158 -40.7587 0.0425   50.1  -13.0       0.9220     4.5  TRIG_00538575
------------------------------------------

Foreground time interval of the image:
  0.000  64.000 (delta_t =  64.000 [sec])
Background time interval of the image:
Lightcurves
Notes:
- 1) All plots contain as much data as has been downloaded to date.
- 2) The mask-weighted light curves are using the flight position.
- 3) Multiple plots of different time binning/intervals are shown to cover all scenarios of short/long GRBs, rate/image triggers, and real/false positives.
- 4) For all the mask-weighted lightcurves, the y-axis units are counts/sec/det where a det is 0.4 x 0.4 = 0.16 sq cm.
- 5) The verticle lines correspond to following: green dotted lines are T50 interval, black dotted lines are T90 interval, blue solid line(s) is a spacecraft slew start time, and orange solid line(s) is a spacecraft slew end time.
- 6) Time of each bin is in the middle of the bin.
1 s binning
From T0-310 s to T0+310 s

From T100_start - 20 s to T100_end + 30 s

Full time interval

64 ms binning
Full time interval

From T100_start to T100_end

From T0-5 sec to T0+5 sec

16 ms binning
From T100_start-5 s to T100_start+5 s

8 ms binning
From T100_start-3 s to T100_start+3 s

2 ms binning
From T100_start-1 s to T100_start+1 s

SN=5 or 10 sec. binning (whichever binning is satisfied first)

SN=5 or 10 sec. binning (T < 200 sec)

The mask-weighted light curves based on cleaned DPHs

Spectra
Notes:
- 1) The fitting includes the systematic errors.
- 2) For long bursts, a spectral fit of the pre-slew DRM will introduce some errors in both a spectral shape and a normalization if the PHA file contains a lot of the slew/post-slew time interval.
- 3) For fits to more complicated models (e.g. a power-law over a cutoff power-law), the BAT team has decided to require a chi-square improvement of more than 6 for each extra dof.
- 4) For short bursts (T90<1sec), the specrtum is also fit with Blackbody, OTTB, and Double Blackbody.
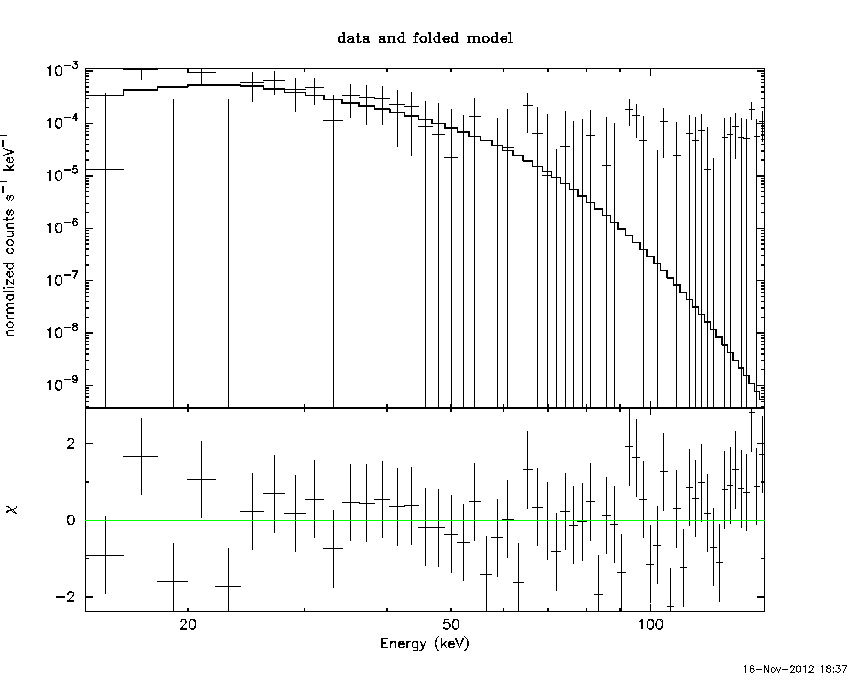
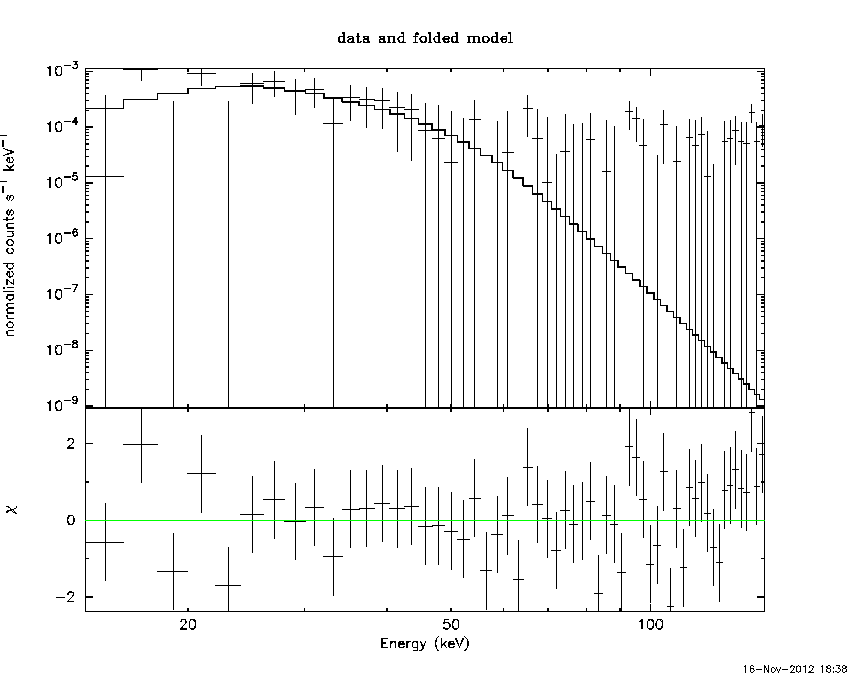
Time averaged spectrum fit using the pre-slew DRM
Power-law model

Time interval is from    0.000 sec. to   64.000 sec.

Spectral model in power-law:
------------------------------------------------------------
Parameters  : value       lower 90%   higher 90%
Photon index: 2.41293     ( -0.645436   0.806036 )
Norm@50keV  : 6.90595E-04    ( -0.000362394   0.00036656 )
------------------------------------------------------------
# Chi-Squared =          67.41 using 59 PHA bins.
# Reduced chi-squared =          1.183 for     57 degrees of freedom
# Null hypothesis probability =   1.628620e-01

Photon flux (15-150 keV)    in 64 sec: 0.128749 ( -0.0468302  0.0468345 ) ph/cm2/s
Energy fluence (15-150 keV)             : 4.32574e-07 ( -1.78281e-07  1.94562e-07 ) ergs/cm2
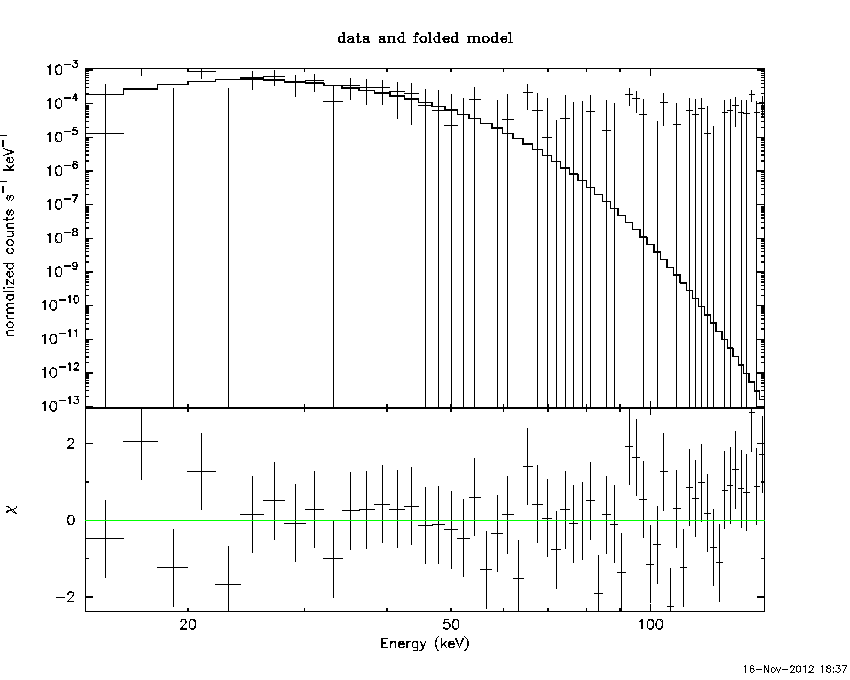
Cutoff power-law model

Time interval is from    0.000 sec. to   64.000 sec.
Spectral model in the cutoff power-law:
------------------------------------------------------------
Parameters  : value       lower 90%   higher 90%
Photon index: -6.08257     (     )
Epeak [keV] : 31.1447      ( -6.68082 6.76092 )
Norm@50keV  : 233.136    (     )
------------------------------------------------------------
# Chi-Squared =          62.26 using 59 PHA bins.
# Reduced chi-squared =          1.112 for     56 degrees of freedom
# Null hypothesis probability =   2.632066e-01

Photon flux (15-150 keV)    in 64 sec: 0.116461 ( -0.0429708  0.046097 ) ph/cm2/s
Energy fluence (15-150 keV)             : 3.44452e-07 ( -1.21483e-07  1.31391e-07 ) ergs/cm2
Band function

Time interval is from    0.000 sec. to   64.000 sec.

Spectral model in the Band function:
------------------------------------------------------------
Parameters  : value       lower 90%   higher 90%
alpha       : 4.96311   ( -63.7582   -53.7588 )
beta        : -9.37167    ( 10   19.8164 )
Epeak [keV] : 30.9469      ( -5.81004 6.5457 )
Norm@50keV   : 45.0570    ( -45.0603   298.979 )
------------------------------------------------------------
# Chi-Squared =          62.31 using 59 PHA bins.
# Reduced chi-squared =          1.133 for     55 degrees of freedom
# Null hypothesis probability =   2.323955e-01

Photon flux (15-150 keV)    in 64 sec:  (    ) ph/cm2/s
Energy fluence (15-150 keV)             : 0 ( 0  0 ) ergs/cm2
Single BB

Spectral model blackbody:
------------------------------------------------------------
Parameters  : value    Lower 90%  Upper 90%
kT [keV]    : 7.55647  (-1.82953  2.34906)
R^2/D10^2   : 0.199481  (-0.199655   0.430593)
(R is the radius in km and D10 is the distance to the source in units of 10 kpc)
------------------------------------------------------------
# Chi-Squared =          63.16 using 59 PHA bins.
# Reduced chi-squared =          1.108 for     57 degrees of freedom
# Null hypothesis probability =   2.679437e-01

Energy  Fluence     90% Error
[keV]   [erg/cm2]   [erg/cm2]
15- 25  1.259e-07   7.766e-08
25- 50  1.991e-07   1.228e-07
50-150  4.318e-08   3.760e-08
15-150  3.682e-07   2.310e-07
Thermal bremsstrahlung (OTTB)

Spectral model: thermal bremsstrahlung
------------------------------------------------------------
Parameters  : value         Lower 90%    Upper 90%
kT [keV]    : 29.8811       (-14.4192      43.7454)
Norm        : 1.07525       (-0.552783     1.14521)
------------------------------------------------------------
# Chi-Squared =          65.87 using 59 PHA bins.
# Reduced chi-squared =          1.156 for     57 degrees of freedom
# Null hypothesis probability =   1.967816e-01

Energy  Fluence     90% Error
[keV]   [erg/cm2]   [erg/cm2]
15- 25  1.398e-07   8.656e-08
25- 50  1.594e-07   9.773e-08
50-150  8.682e-08   7.853e-08
15-150  3.860e-07   2.473e-07
Double BB

------------------------------------------------------------
Parameters  : value         Lower 90%    Upper 90%
kT1 [keV]   : 199.998        (      )
R1^2/D10^2  : 7.80612E-06        (-7.79083e-06      1.13795e-05)
kT2 [keV]   : 7.25933        (-1.79224      2.25478)
R2^2/D10^2  : 0.227189    (-0.15531   0.505796)
------------------------------------------------------------
# Chi-Squared =          63.16 using 59 PHA bins.
# Chi-Squared =          61.90 using 59 PHA bins.
# Reduced chi-squared =          1.148 for     55 degrees of freedom
# Reduced chi-squared =          1.126 for     55 degrees of freedom
# Null hypothesis probability =   2.103609e-01
# Null hypothesis probability =   2.433771e-01

Energy  Fluence     90% Error
[keV]   [erg/cm2]   [erg/cm2]
15- 25  1.258e-07   4.288e+00
25- 50  1.992e-07   3.046e+01
50-150  4.330e-08   8.608e+02
15-150  3.683e-07   8.893e+02
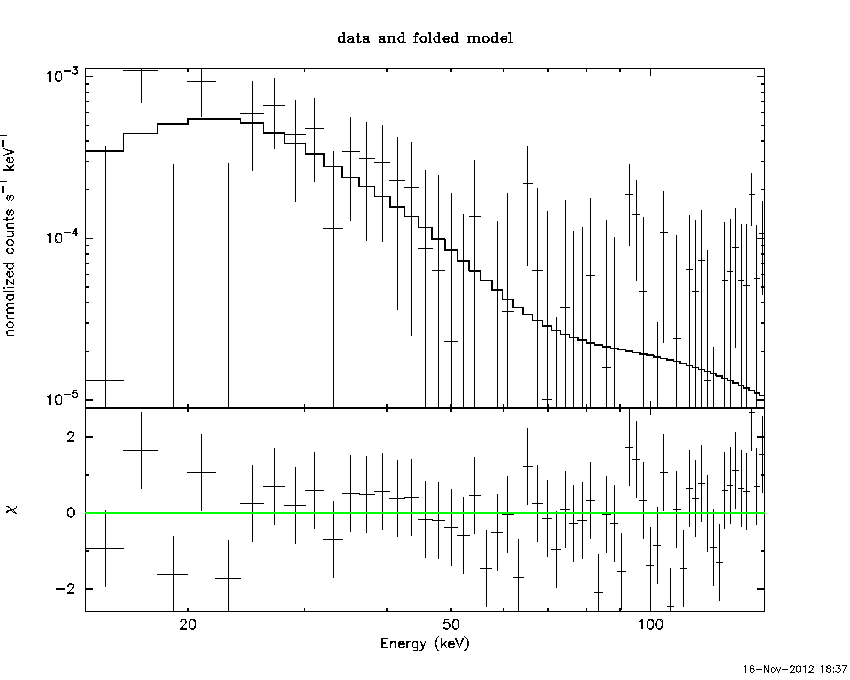
Peak spectrum fit
Power-law model

Time interval is from    0.000 sec. to   64.000 sec.

Spectral model in power-law:
------------------------------------------------------------
Parameters  : value       lower 90%   higher 90%
Photon index: 2.41293     ( -0.645436   0.806036 )
Norm@50keV  : 6.90595E-04    ( -0.000362394   0.00036656 )
------------------------------------------------------------
# Chi-Squared =          67.41 using 59 PHA bins.
# Reduced chi-squared =          1.183 for     57 degrees of freedom
# Null hypothesis probability =   1.628620e-01

Photon flux (15-150 keV)    in 64 sec: 0.128749 ( -0.0468302  0.0468345 ) ph/cm2/s
Energy fluence (15-150 keV)             : 4.32574e-07 ( -1.78281e-07  1.94562e-07 ) ergs/cm2
Cutoff power-law model

Time interval is from    0.000 sec. to   64.000 sec.
Spectral model in the cutoff power-law:
------------------------------------------------------------
Parameters  : value       lower 90%   higher 90%
Photon index: -6.08257     (     )
Epeak [keV] : 31.1447      ( -6.68082 6.76092 )
Norm@50keV  : 233.136    (     )
------------------------------------------------------------
# Chi-Squared =          62.26 using 59 PHA bins.
# Reduced chi-squared =          1.112 for     56 degrees of freedom
# Null hypothesis probability =   2.632066e-01

Photon flux (15-150 keV)    in 64 sec: 0.116461 ( -0.0429708  0.046097 ) ph/cm2/s
Energy fluence (15-150 keV)             : 3.44452e-07 ( -1.21483e-07  1.31391e-07 ) ergs/cm2
Band function

Time interval is from    0.000 sec. to   64.000 sec.

Spectral model in the Band function:
------------------------------------------------------------
Parameters  : value       lower 90%   higher 90%
alpha       : 4.96311   ( -63.7582   -53.7588 )
beta        : -9.37167    ( 10   19.8164 )
Epeak [keV] : 30.9469      ( -5.81004 6.5457 )
Norm@50keV   : 45.0570    ( -45.0603   298.979 )
------------------------------------------------------------
# Chi-Squared =          62.31 using 59 PHA bins.
# Reduced chi-squared =          1.133 for     55 degrees of freedom
# Null hypothesis probability =   2.323955e-01

Photon flux (15-150 keV)    in 64 sec:  (    ) ph/cm2/s
Energy fluence (15-150 keV)             : 0 ( 0  0 ) ergs/cm2
Single BB
Spectral model blackbody:
------------------------------------------------------------
Parameters  : value    Lower 90%  Upper 90%
kT [keV]    : 7.55647  (-1.82953  2.34906)
R^2/D10^2   : 0.199481  (-0.199655   0.430593)
(R is the radius in km and D10 is the distance to the source in units of 10 kpc)
------------------------------------------------------------
# Chi-Squared =          63.16 using 59 PHA bins.
# Reduced chi-squared =          1.108 for     57 degrees of freedom
# Null hypothesis probability =   2.679437e-01

Energy  Fluence     90% Error
[keV]   [erg/cm2]   [erg/cm2]
15- 25  1.259e-07   7.693e-08
25- 50  1.991e-07   1.226e-07
50-150  4.318e-08   3.360e-08
15-150  3.682e-07   2.279e-07
Thermal bremsstrahlung (OTTB)

Spectral model: thermal bremsstrahlung
------------------------------------------------------------
Parameters  : value         Lower 90%    Upper 90%
kT [keV]    : 29.8811       (-14.4192      43.7454)
Norm        : 1.07525       (-0.552783     1.14521)
------------------------------------------------------------
# Chi-Squared =          65.87 using 59 PHA bins.
# Reduced chi-squared =          1.156 for     57 degrees of freedom
# Null hypothesis probability =   1.967816e-01

Energy  Fluence     90% Error
[keV]   [erg/cm2]   [erg/cm2]
15- 25  1.398e-07   8.613e-08
25- 50  1.594e-07   1.049e-07
50-150  8.682e-08   7.686e-08
15-150  3.860e-07   2.514e-07
Double BB
------------------------------------------------------------
Parameters  : value         Lower 90%    Upper 90%
kT1 [keV]   : 199.998        (      )
R1^2/D10^2  : 7.80612E-06        (-7.79083e-06      1.13795e-05)
kT2 [keV]   : 7.25933        (-1.79224      2.25478)
R2^2/D10^2  : 0.227189    (-0.15531   0.505796)
------------------------------------------------------------
# Chi-Squared =          63.16 using 59 PHA bins.
# Chi-Squared =          61.90 using 59 PHA bins.
# Reduced chi-squared =          1.148 for     55 degrees of freedom
# Reduced chi-squared =          1.126 for     55 degrees of freedom
# Null hypothesis probability =   2.103609e-01
# Null hypothesis probability =   2.433771e-01

Energy  Fluence     90% Error
[keV]   [erg/cm2]   [erg/cm2]
15- 25  1.258e-07   3.958e+00
25- 50  1.992e-07   3.456e+01
50-150  4.330e-08   7.533e+02
15-150  3.683e-07   8.915e+02
Pre-slew spectrum (Pre-slew PHA with pre-slew DRM)
Power-law model
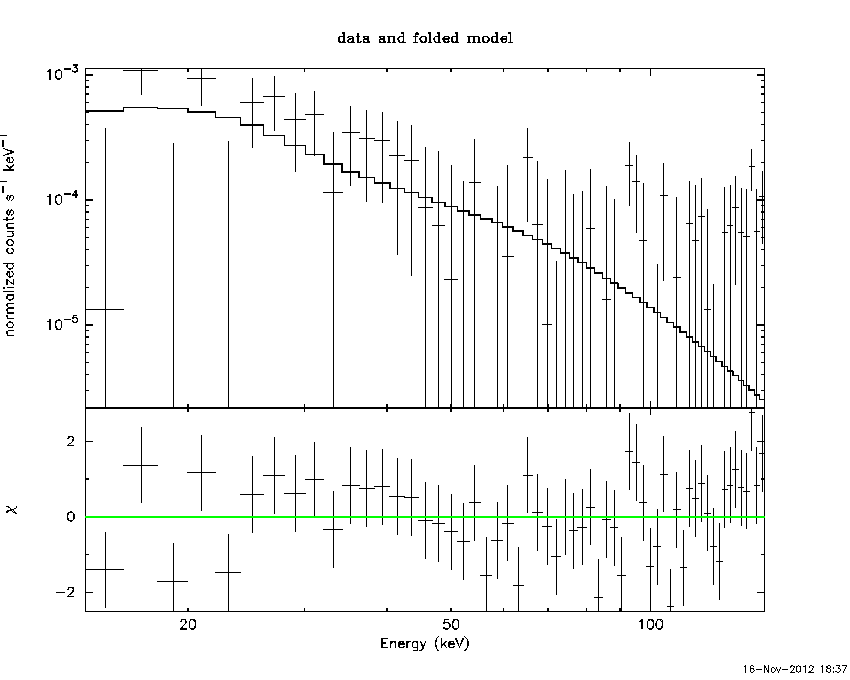
Spectral model in power-law:
------------------------------------------------------------
Parameters  : value       lower 90%   higher 90%
Photon index: 2.41293     ( -0.645436   0.806036 )
Norm@50keV  : 6.90595E-04    ( -0.000362394   0.00036656 )
------------------------------------------------------------
# Chi-Squared =          67.41 using 59 PHA bins.
# Reduced chi-squared =          1.183 for     57 degrees of freedom
# Null hypothesis probability =   1.628620e-01

Photon flux (15-150 keV)    in 64 sec: 0.128749 ( -0.0468302  0.0468345 ) ph/cm2/s
Energy fluence (15-150 keV)             : 4.32574e-07 ( -1.78281e-07  1.94562e-07 ) ergs/cm2
Cutoff power-law model
Spectral model in the cutoff power-law:
------------------------------------------------------------
Parameters  : value       lower 90%   higher 90%
Photon index: -6.08257     (     )
Epeak [keV] : 31.1447      ( -6.68082 6.76092 )
Norm@50keV  : 233.136    (     )
------------------------------------------------------------
# Chi-Squared =          62.26 using 59 PHA bins.
# Reduced chi-squared =          1.112 for     56 degrees of freedom
# Null hypothesis probability =   2.632066e-01

Photon flux (15-150 keV)    in 64 sec: 0.116461 ( -0.0429708  0.046097 ) ph/cm2/s
Energy fluence (15-150 keV)             : 3.44452e-07 ( -1.21483e-07  1.31391e-07 ) ergs/cm2
Band function
Spectral model in the Band function:
------------------------------------------------------------
Parameters  : value       lower 90%   higher 90%
alpha       : 4.96311   ( -63.7585   -53.7588 )
beta        : -9.37167    ( 10   19.8164 )
Epeak [keV] : 30.9469      ( -5.81004 6.5457 )
Norm@50keV   : 45.0570    ( -45.0603   298.979 )
------------------------------------------------------------
# Chi-Squared =          62.31 using 59 PHA bins.
# Reduced chi-squared =          1.133 for     55 degrees of freedom
# Null hypothesis probability =   2.323955e-01

Photon flux (15-150 keV)    in 64 sec:  (    ) ph/cm2/s
Energy fluence (15-150 keV)             : 0 ( 0  0 ) ergs/cm2
S(25-50 keV) vs. S(50-100 keV) plot

S(25-50 keV)  = 1.42088e-07
S(50-100 keV) = 1.068e-07
T90 vs. Hardness ratio plot

T90                                   = 64 sec.
Hardness ratio (energy fluence ratio) = 0.751647
Color vs. Color plot

Count Ratio  (25-50 keV) / (15-25 keV) = 1.79677
Count Ratio (50-100 keV) / (15-25 keV) = -0.0683208
Mask shadow pattern

IMX = 1.164899007970837E+00, IMY = 2.681610409600897E-01
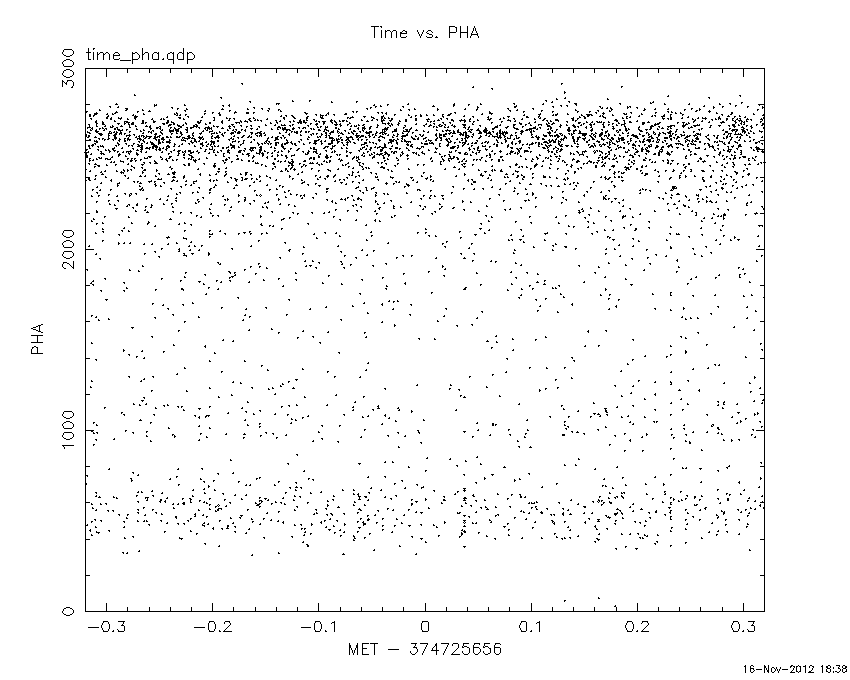
TIME vs. PHA plot around the trigger time
TIME vs. DetID plot around the trigger time

100 us light curve (15-350 keV)

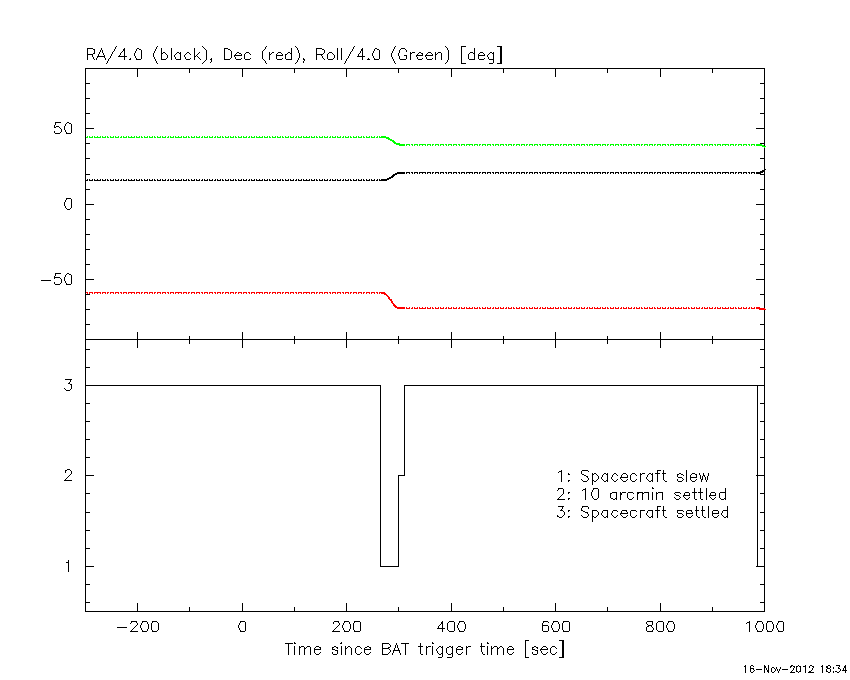
Spacecraft aspect plot
Bright source in the pre-burst/pre-slew/post-slew images
Pre-burst image of 15-350 keV band
Time interval of the image:
Pre-slew background subtracted image of 15-350 keV band
Time interval of the image:
0.000000 64.000000

# RAcent  DECcent POSerr Theta    Phi  PeakCts   SNR AngSep     Name
#  [deg]    [deg]    ['] [deg]  [deg]                   [']
135.4904 -40.6186    4.2  47.2 -167.1   0.4836   2.7    4.2	Vela X-1
111.9554 -51.2233    2.3  28.1 -171.9   0.5061   5.1 ------	UNKNOWN
 59.3096 -74.0371    2.2  15.3  -83.4   0.4858   5.2 ------	UNKNOWN
152.4224 -58.2899    0.9  42.9 -138.4   2.2907  12.5 ------	UNKNOWN
154.3622 -72.3597    2.2  35.6 -119.1   0.7927   5.3 ------	UNKNOWN
172.4946 -64.7501    2.3  45.4 -122.3   1.8130   5.0 ------	UNKNOWN
308.7493 -66.6987    2.2  45.6  -57.6   2.0407   5.4 ------	UNKNOWN
Post-slew image of 15-350 keV band
Time interval of the image:
299.500600 949.508400
951.000000 963.021000

# RAcent  DECcent POSerr Theta    Phi  PeakCts   SNR AngSep     Name
#  [deg]    [deg]    ['] [deg]  [deg]                   [']
135.6595 -40.5934    6.3  39.4 -176.1   1.3540   1.8    6.4	Vela X-1
170.2523 -60.5841    2.6  34.7 -127.4   3.4672   4.5    3.0	Cen X-3
187.0613 -62.7799   18.8  37.7 -114.4   0.6786   0.6   11.1	GX 301-2
 48.9711 -33.2381    2.8  40.6   65.9   7.3137   4.0 ------	UNKNOWN
 45.3210 -34.9063    3.4  40.0   60.7   5.7597   3.4 ------	UNKNOWN
 32.9795 -34.4489    2.9  44.2   46.8   7.2489   4.0 ------	UNKNOWN
132.3417 -23.2644    3.4  54.3  171.1   7.3190   3.4 ------	UNKNOWN
 53.9107 -62.2598    3.7  13.6   37.6   1.4560   3.1 ------	UNKNOWN
 79.4219 -64.7615    2.7   4.5   91.7   2.0298   4.3 ------	UNKNOWN
152.4237 -58.2969    0.4  30.6 -143.0  16.0617  30.8 ------	UNKNOWN
152.5041 -34.8297    2.9  50.5 -162.8   4.5991   4.0 ------	UNKNOWN
319.3148 -44.7473    3.0  58.9  -24.3  13.0258   3.8 ------	UNKNOWN
Plot creation:
Fri Nov 16 18:39:04 EST 2012