Special notes of this burst
Image
Pre-slew 15.0-350.0 keV image (Event data)
#   RAcent    DECcent   POSerr    Theta     Phi              Peak Cts       SNR   Name
   31.6187     7.4290   0.0067     5.6336   131.6612         1.4761689     28.678 TRIG_00538696

Foreground time interval of the image:
 -4.848  14.021 (delta_t =  18.869 [sec])
Background time interval of the image:
-239.880  -4.848 (delta_t = 235.032 [sec])
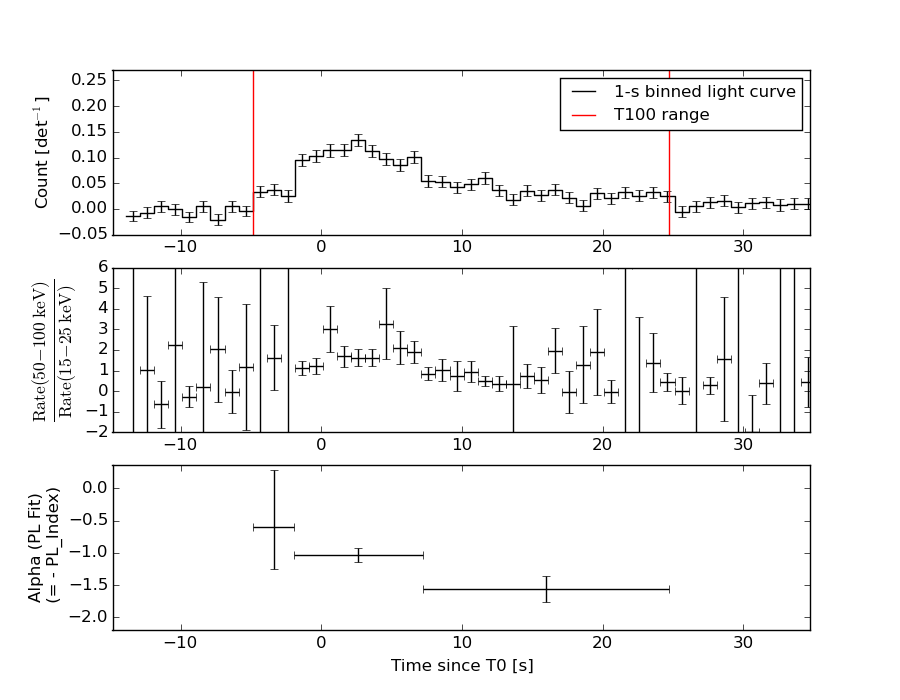
Lightcurves
Notes:
- 1) The mask-weighted light curves are using the flight position.
- 2) Multiple plots of different time binning/intervals are shown to cover all scenarios of short/long GRBs, rate/image triggers, and real/false positives.
- 3) For all the mask-weighted lightcurves, the y-axis units are counts/sec/det where a det is 0.4 x 0.4 = 0.16 sq cm.
- 4) The verticle lines correspond to following: green dotted lines are T50 interval, black dotted lines are T90 interval, blue solid line(s) is a spacecraft slew start time, and orange solid line(s) is a spacecraft slew end time.
- 5) Time of each bin is in the middle of the bin.
1 s binning
From T0-310 s to T0+310 s
From T100_start - 20 s to T100_end + 30 s
Full time interval

64 ms binning
Full time interval

From T100_start to T100_end

From T0-5 sec to T0+5 sec

16 ms binning
From T100_start-5 s to T100_start+5 s

Blue+Cyan dotted lines: Time interval of the scaled map
From 0.000000 to 1.024000
8 ms binning
From T100_start-3 s to T100_start+3 s
Blue+Cyan dotted lines: Time interval of the scaled map
From 0.000000 to 1.024000
2 ms binning
From T100_start-1 s to T100_start+1 s
Blue+Cyan dotted lines: Time interval of the scaled map
From 0.000000 to 1.024000
SN=5 or 10 sec. binning (whichever binning is satisfied first)
SN=5 or 10 sec. binning (T < 200 sec)

Quad-rate summed light curves (from T0-300s to T0+1000s)

The mask-weighted light curves based on cleaned DPHs

Spectral Evolution
Spectra
Notes:
- 1) The fitting includes the systematic errors.
- 2) When the burst includes telescope slew time periods, the fitting uses an average response file made from multiple 5-s response files through out the slew time plus single time preiod for the non-slew times, and weighted by the total counts in the corresponding time period using addrmf. An average response file is needed becuase a spectral fit using the pre-slew DRM will introduce some errors in both a spectral shape and a normalization if the PHA file contains a lot of the slew/post-slew time interval.
- 3) For fits to more complicated models (e.g. a power-law over a cutoff power-law), the BAT team has decided to require a chi-square improvement of more than 6 for each extra dof.
Time averaged spectrum fit using the average DRM
Power-law model

Time interval is from   -4.848 sec. to   24.756 sec.

Spectral model in power-law:
------------------------------------------------------------
Parameters  : value       lower 90%   higher 90%
Photon index: 1.22716     ( -0.102705   0.102188 )
Norm@50keV  : 3.61432E-03    ( -0.000210844   0.000210766 )
------------------------------------------------------------
#Fit statistic : Chi-Squared =          45.44 using 59 PHA bins.
# Reduced chi-squared =         0.7972 for     57 degrees of freedom
# Null hypothesis probability =   8.647746e-01

Photon flux (15-150 keV)    in 29.6 sec: 0.425930 ( -0.0251681  0.0252103 ) ph/cm2/s
Energy fluence (15-150 keV)             : 1.07726e-06 ( -7.15139e-08  7.20076e-08 ) ergs/cm2
Cutoff power-law model

Time interval is from   -4.848 sec. to   24.756 sec.
Spectral model in the cutoff power-law:
------------------------------------------------------------
Parameters  : value       lower 90%   higher 90%
Photon index: 0.717729     ( -0.44413   0.40101 )
Epeak [keV] : 130.751      ( -38.5408 254.41 )
Norm@50keV  : 6.39883E-03    ( -0.00226582   0.00395953 )
------------------------------------------------------------
#Fit statistic : Chi-Squared =          40.60 using 59 PHA bins.
# Reduced chi-squared =         0.7250 for     56 degrees of freedom
# Null hypothesis probability =   9.395139e-01

Photon flux (15-150 keV)    in 29.6 sec: 0.415480 ( -0.026493  0.026459 ) ph/cm2/s
Energy fluence (15-150 keV)             : 1.03375e-06 ( -8.01242e-08  8.00828e-08 ) ergs/cm2
Band function

Time interval is from   -4.848 sec. to   24.756 sec.

Spectral model in the Band function:
------------------------------------------------------------
Parameters  : value       lower 90%   higher 90%
alpha       : -0.717603   ( -0.361029   0.509627 )
beta        : -10.0000    ( 10   2.30926e-14 )
Epeak [keV] : 130.725      ( -30.2515 253.911 )
Norm@50keV   : 6.39914E-03    ( -0.00226631   0.003962 )
------------------------------------------------------------
#Fit statistic : Chi-Squared =          40.60 using 59 PHA bins.
# Reduced chi-squared =         0.7382 for     55 degrees of freedom
# Null hypothesis probability =   9.265205e-01

Photon flux (15-150 keV)    in 29.6 sec: 0.417863 (    ) ph/cm2/s
Energy fluence (15-150 keV)             : 0 ( 0  0 ) ergs/cm2
Single BB
Spectral model blackbody:
------------------------------------------------------------
Parameters  : value    Lower 90%  Upper 90%
kT [keV]    : 17.6817  (-1.34674  1.49244)
R^2/D10^2   : 2.90381E-02  (-0.00682769   0.00877698)
(R is the radius in km and D10 is the distance to the source in units of 10 kpc)
------------------------------------------------------------
#Fit statistic : Chi-Squared =          83.42 using 59 PHA bins.
# Reduced chi-squared =          1.464 for     57 degrees of freedom
# Null hypothesis probability =   1.283031e-02

Energy  Fluence     90% Error
[keV]   [erg/cm2]   [erg/cm2]
15- 25  5.411e-08   6.186e-09
25- 50  2.469e-07   2.097e-08
50-150  5.576e-07   6.053e-08
15-150  8.585e-07   6.038e-08
Thermal bremsstrahlung (OTTB)

Spectral model: thermal bremsstrahlung
------------------------------------------------------------
Parameters  : value         Lower 90%    Upper 90%
kT [keV]    : 200.000       (      )
Norm        : 1.74776       (-0.103065     0.103057)
------------------------------------------------------------
#Fit statistic : Chi-Squared =          67.67 using 59 PHA bins.
# Reduced chi-squared =          1.187 for     57 degrees of freedom
# Null hypothesis probability =   1.574614e-01

Energy  Fluence     90% Error
[keV]   [erg/cm2]   [erg/cm2]
15- 25  1.288e-07   8.318e-09
25- 50  2.478e-07   2.022e-08
50-150  5.434e-07   1.472e-07
15-150  9.200e-07   1.446e-07
Double BB

Spectral model: bbodyrad<1> + bbodyrad<2>
------------------------------------------------------------
Parameters  : value         Lower 90%    Upper 90%
kT1 [keV]   : 7.67544        (-1.67908      2.07516)
R1^2/D10^2  : 0.248178        (-0.123935      0.297033)
kT2 [keV]   : 27.8398        (-4.72415      8.75285)
R2^2/D10^2  : 5.33692E-03    (-0.00323515   0.00301041)
------------------------------------------------------------
#Fit statistic : Chi-Squared =          38.60 using 59 PHA bins.
# Reduced chi-squared =         0.7017 for     55 degrees of freedom
# Null hypothesis probability =   9.543491e-01

Energy  Fluence     90% Error
[keV]   [erg/cm2]   [erg/cm2]
15- 25  9.579e-08   3.034e-08
25- 50  2.429e-07   5.861e-08
50-150  7.001e-07   2.133e-07
15-150  1.039e-06   2.637e-07
Peak spectrum fit
Power-law model
Time interval is from    2.348 sec. to    3.348 sec.

Spectral model in power-law:
------------------------------------------------------------
Parameters  : value       lower 90%   higher 90%
Photon index: 1.04305     ( -0.231093   0.224571 )
Norm@50keV  : 8.96708E-03    ( -0.00118143   0.00118087 )
------------------------------------------------------------
#Fit statistic : Chi-Squared =          43.47 using 59 PHA bins.
# Reduced chi-squared =         0.7626 for     57 degrees of freedom
# Null hypothesis probability =   9.066785e-01

Photon flux (15-150 keV)    in 1 sec: 1.03514 ( -0.138019  0.138031 ) ph/cm2/s
Energy fluence (15-150 keV)             : 9.55293e-08 ( -1.42178e-08  1.43956e-08 ) ergs/cm2
Cutoff power-law model

Time interval is from    2.348 sec. to    3.348 sec.
Spectral model in the cutoff power-law:
------------------------------------------------------------
Parameters  : value       lower 90%   higher 90%
Photon index: 0.632248     ( -1.09592   0.524822 )
Epeak [keV] : 175.217      ( -175.247 -175.247 )
Norm@50keV  : 1.42126E-02    (     )
------------------------------------------------------------
#Fit statistic : Chi-Squared =          42.87 using 59 PHA bins.
# Reduced chi-squared =         0.7656 for     56 degrees of freedom
# Null hypothesis probability =   9.013033e-01

Photon flux (15-150 keV)    in 1 sec: 1.01933 ( -0.143113  0.14235 ) ph/cm2/s
Energy fluence (15-150 keV)             : 9.2567e-08 ( -1.62401e-08  1.5826e-08 ) ergs/cm2
Band function

Time interval is from    2.348 sec. to    3.348 sec.

Spectral model in the Band function:
------------------------------------------------------------
Parameters  : value       lower 90%   higher 90%
alpha       : 4.89221   ( -4.89221   -4.89221 )
beta        : -1.22640    ( -0.360023   0.286851 )
Epeak [keV] : 32.6704      ( -17.4483 8.04219 )
Norm@50keV   : 121.360    ( -15.8573   1.61446e+06 )
------------------------------------------------------------
#Fit statistic : Chi-Squared =          41.20 using 59 PHA bins.
# Reduced chi-squared =         0.7490 for     55 degrees of freedom
# Null hypothesis probability =   9.163151e-01

Photon flux (15-150 keV)    in 1 sec:  (    ) ph/cm2/s
Energy fluence (15-150 keV)             : 0 ( 0  0 ) ergs/cm2
Single BB
Spectral model blackbody:
------------------------------------------------------------
Parameters  : value    Lower 90%  Upper 90%
kT [keV]    : 19.0148  (-3.15483  4.0733)
R^2/D10^2   : 5.81499E-02  (-0.0268822   0.0464047)
(R is the radius in km and D10 is the distance to the source in units of 10 kpc)
------------------------------------------------------------
#Fit statistic : Chi-Squared =          50.59 using 59 PHA bins.
# Reduced chi-squared =         0.8876 for     57 degrees of freedom
# Null hypothesis probability =   7.126696e-01

Energy  Fluence     90% Error
[keV]   [erg/cm2]   [erg/cm2]
15- 25  4.131e-09   1.261e-09
25- 50  1.988e-08   4.215e-09
50-150  5.284e-08   1.450e-08
15-150  7.685e-08   1.553e-08
Thermal bremsstrahlung (OTTB)

Spectral model: thermal bremsstrahlung
------------------------------------------------------------
Parameters  : value         Lower 90%    Upper 90%
kT [keV]    : 200.000       (      )
Norm        : 4.12308       (-0.565084     0.565078)
------------------------------------------------------------
#Fit statistic : Chi-Squared =          55.58 using 59 PHA bins.
# Reduced chi-squared =         0.9751 for     57 degrees of freedom
# Null hypothesis probability =   5.283844e-01

Energy  Fluence     90% Error
[keV]   [erg/cm2]   [erg/cm2]
15- 25  1.027e-08   5.770e-09
25- 50  1.975e-08   1.117e-08
50-150  4.332e-08   2.426e-08
15-150  7.334e-08   4.074e-08
Double BB

Spectral model: bbodyrad<1> + bbodyrad<2>
------------------------------------------------------------
Parameters  : value         Lower 90%    Upper 90%
kT1 [keV]   : 10.8858        (-5.44502      4.69496)
R1^2/D10^2  : 0.226558        (-0.102176      0.463739)
kT2 [keV]   : 45.1289        (-56.6452      -82.7303)
R2^2/D10^2  : 2.83508E-03    (-0.000540659   0.0167986)
------------------------------------------------------------
#Fit statistic : Chi-Squared =          41.64 using 59 PHA bins.
# Reduced chi-squared =         0.7572 for     55 degrees of freedom
# Null hypothesis probability =   9.081076e-01

Energy  Fluence     90% Error
[keV]   [erg/cm2]   [erg/cm2]
15- 25  6.279e-09   3.656e-09
25- 50  2.042e-08   1.128e-08
50-150  6.321e-08   3.501e-08
15-150  8.992e-08   4.799e-08
Pre-slew spectrum (Pre-slew PHA with pre-slew DRM)
Power-law model

Spectral model in power-law:
------------------------------------------------------------
Parameters  : value       lower 90%   higher 90%
Photon index: 1.15080     ( -0.104255   0.103317 )
Norm@50keV  : 4.65068E-03    ( -0.000268565   0.000268563 )
------------------------------------------------------------
#Fit statistic : Chi-Squared =          43.23 using 59 PHA bins.
# Reduced chi-squared =         0.7584 for     57 degrees of freedom
# Null hypothesis probability =   9.110952e-01

Photon flux (15-150 keV)    in 18.87 sec: 0.542415 ( -0.0319507  0.0319795 ) ph/cm2/s
Energy fluence (15-150 keV)             : 9.03199e-07 ( -5.93088e-08  5.96837e-08 ) ergs/cm2
Cutoff power-law model

Spectral model in the cutoff power-law:
------------------------------------------------------------
Parameters  : value       lower 90%   higher 90%
Photon index: 0.910924     ( -0.416049   0.287645 )
Epeak [keV] : 242.244      ( -242.244 -242.244 )
Norm@50keV  : 6.05413E-03    ( -0.00158401   0.00336017 )
------------------------------------------------------------
#Fit statistic : Chi-Squared =          42.08 using 59 PHA bins.
# Reduced chi-squared =         0.7515 for     56 degrees of freedom
# Null hypothesis probability =   9.160274e-01

Photon flux (15-150 keV)    in 18.87 sec: 0.536186 ( -0.033449  0.033397 ) ph/cm2/s
Energy fluence (15-150 keV)             : 8.87199e-07 ( -6.55883e-08  6.5143e-08 ) ergs/cm2
Band function
Spectral model in the Band function:
------------------------------------------------------------
Parameters  : value       lower 90%   higher 90%
alpha       : 3.97519   ( -10.0052   -3.9752 )
beta        : -1.23148    ( -0.134473   0.125015 )
Epeak [keV] : 28.7367      ( -7.76398 2.93942 )
Norm@50keV   : 31.8334    ( -31.8341   449.956 )
------------------------------------------------------------
#Fit statistic : Chi-Squared =          39.84 using 59 PHA bins.
# Reduced chi-squared =         0.7244 for     55 degrees of freedom
# Null hypothesis probability =   9.381598e-01

Photon flux (15-150 keV)    in 18.87 sec:  (    ) ph/cm2/s
Energy fluence (15-150 keV)             : 0 ( 0  0 ) ergs/cm2
S(25-50 keV) vs. S(50-100 keV) plot

S(25-50 keV)  = 2.30e-07
S(50-100 keV) = 3.93e-07
T90 vs. Hardness ratio plot
T90                                   = 23.2999999523163 sec.
Hardness ratio (energy fluence ratio) = 1.7087
Color vs. Color plot

Count Ratio  (25-50 keV) / (15-25 keV) = 1.62006
Count Ratio (50-100 keV) / (15-25 keV) = 1.44029
Mask shadow pattern

IMX = -6.557039305708190E-02, IMY = -7.369490560028179E-02
TIME vs. PHA plot around the trigger time

Blue+Cyan dotted lines: Time interval of the scaled map
From 0.000000 to 1.024000
TIME vs. DetID plot around the trigger time
Blue+Cyan dotted lines: Time interval of the scaled map
From 0.000000 to 1.024000
100 us light curve (15-350 keV)

Blue+Cyan dotted lines: Time interval of the scaled map
From 0.000000 to 1.024000
Spacecraft aspect plot
Bright source in the pre-burst/pre-slew/post-slew images
Pre-burst image of 15-350 keV band
Time interval of the image:
-239.880000 -4.848000

# RAcent  DECcent POSerr Theta    Phi  PeakCts   SNR AngSep     Name
#  [deg]    [deg]    ['] [deg]  [deg]                   [']
 13.0976 -25.8087    3.3  36.5 -128.4   1.2004   3.5 ------	UNKNOWN
 40.1954 -48.9399    3.0  58.7 -159.1   5.5084   3.9 ------	UNKNOWN
 37.0708 -48.6900    2.7  57.9 -156.8   5.5866   4.3 ------	UNKNOWN
Pre-slew background subtracted image of 15-350 keV band
Time interval of the image:
-4.848000 14.020600

# RAcent  DECcent POSerr Theta    Phi  PeakCts   SNR AngSep     Name
#  [deg]    [deg]    ['] [deg]  [deg]                   [']
 31.6187   7.4289    0.4   5.6  131.7   1.4762  28.7 ------	UNKNOWN
 21.6096 -37.9665    2.3  46.6 -143.4   0.6187   5.0 ------	UNKNOWN
Post-slew image of 15-350 keV band
Time interval of the image:
36.020600 302.210000

# RAcent  DECcent POSerr Theta    Phi  PeakCts   SNR AngSep     Name
#  [deg]    [deg]    ['] [deg]  [deg]                   [']
355.3764  50.8920    3.3  52.8    3.8   2.9796   3.5 ------	UNKNOWN
339.0119  35.0182    2.6  55.5  -20.5   4.5811   4.5 ------	UNKNOWN
 42.8098 -49.7870    2.9  58.0 -156.8   6.7432   4.0 ------	UNKNOWN
Plot creation:
Sat May 30 17:55:07 EDT 2015