Click here for the BAT GCN circular template
Image
Pre-slew 15.0-350.0 keV image (Event data)

#   RAcent    DECcent   POSerr    Theta     Phi              Peak Cts       SNR   Name
  228.5290    55.3184   0.0077    22.9670   -50.0531         1.6264078     24.903 TRIG_00539563

Foreground time interval of the image:
 -6.852  10.717 (delta_t =  17.569 [sec])
Background time interval of the image:
-265.283 -250.525 (delta_t =  14.759 [sec])
-239.184  -6.852 (delta_t = 232.332 [sec])
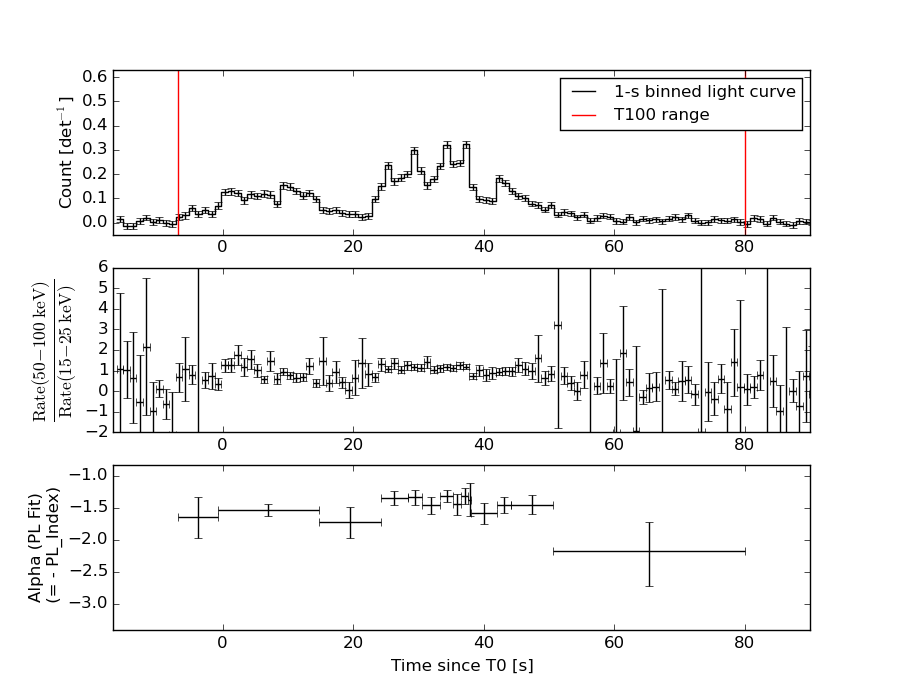
Lightcurves
Notes:
- 1) The mask-weighted light curves are using the flight position.
- 2) Multiple plots of different time binning/intervals are shown to cover all scenarios of short/long GRBs, rate/image triggers, and real/false positives.
- 3) For all the mask-weighted lightcurves, the y-axis units are counts/sec/det where a det is 0.4 x 0.4 = 0.16 sq cm.
- 4) The verticle lines correspond to following: green dotted lines are T50 interval, black dotted lines are T90 interval, blue solid line(s) is a spacecraft slew start time, and orange solid line(s) is a spacecraft slew end time.
- 5) Time of each bin is in the middle of the bin.
1 s binning
From T0-310 s to T0+310 s
From T100_start - 20 s to T100_end + 30 s

Full time interval

64 ms binning
Full time interval

From T100_start to T100_end

From T0-5 sec to T0+5 sec

16 ms binning
From T100_start-5 s to T100_start+5 s

Blue+Cyan dotted lines: Time interval of the scaled map
From 0.000000 to 0.512000
8 ms binning
From T100_start-3 s to T100_start+3 s

Blue+Cyan dotted lines: Time interval of the scaled map
From 0.000000 to 0.512000
2 ms binning
From T100_start-1 s to T100_start+1 s
Blue+Cyan dotted lines: Time interval of the scaled map
From 0.000000 to 0.512000
SN=5 or 10 sec. binning (whichever binning is satisfied first)

SN=5 or 10 sec. binning (T < 200 sec)

Quad-rate summed light curves (from T0-300s to T0+1000s)

The mask-weighted light curves based on cleaned DPHs

Spectral Evolution
Spectra
Notes:
- 1) The fitting includes the systematic errors.
- 2) When the burst includes telescope slew time periods, the fitting uses an average response file made from multiple 5-s response files through out the slew time plus single time preiod for the non-slew times, and weighted by the total counts in the corresponding time period using addrmf. An average response file is needed becuase a spectral fit using the pre-slew DRM will introduce some errors in both a spectral shape and a normalization if the PHA file contains a lot of the slew/post-slew time interval.
- 3) For fits to more complicated models (e.g. a power-law over a cutoff power-law), the BAT team has decided to require a chi-square improvement of more than 6 for each extra dof.
Time averaged spectrum fit using the average DRM
Power-law model

Time interval is from   -6.852 sec. to   79.964 sec.

Spectral model in power-law:
------------------------------------------------------------
Parameters  : value       lower 90%   higher 90%
Photon index: 1.50395     ( -0.0571706   0.0572506 )
Norm@50keV  : 5.59270E-03    ( -0.000159328   0.000159227 )
------------------------------------------------------------
#Fit statistic : Chi-Squared =          48.33 using 59 PHA bins.
# Reduced chi-squared =         0.8480 for     57 degrees of freedom
# Null hypothesis probability =   7.862816e-01

Photon flux (15-150 keV)    in 86.82 sec: 0.698933 ( -0.0215333  0.0216329 ) ph/cm2/s
Energy fluence (15-150 keV)             : 4.60327e-06 ( -1.42044e-07  1.4268e-07 ) ergs/cm2
Cutoff power-law model
Time interval is from   -6.852 sec. to   79.964 sec.
Spectral model in the cutoff power-law:
------------------------------------------------------------
Parameters  : value       lower 90%   higher 90%
Photon index: 1.50128     ( -0.216419   0.0590087 )
Epeak [keV] : 9998.60      (   )
Norm@50keV  : 5.60909E-03    ( -0.000159974   0.00142347 )
------------------------------------------------------------
#Fit statistic : Chi-Squared =          48.33 using 59 PHA bins.
# Reduced chi-squared =         0.8631 for     56 degrees of freedom
# Null hypothesis probability =   7.569991e-01

Photon flux (15-150 keV)    in 86.82 sec: 0.698538 ( -0.02146  0.021341 ) ph/cm2/s
Energy fluence (15-150 keV)             : 4.60362e-06 ( -1.3273e-07  1.40579e-07 ) ergs/cm2
Band function
Time interval is from   -6.852 sec. to   79.964 sec.

Spectral model in the Band function:
------------------------------------------------------------
Parameters  : value       lower 90%   higher 90%
alpha       : -0.555699   ( 1.03932   1.03932 )
beta        : -1.51386    ( 1.51043   0.0602351 )
Epeak [keV] : 37.2211      ( -36.5438 487.757 )
Norm@50keV   : 2.87257E-02    ( -0.0292082   550808 )
------------------------------------------------------------
#Fit statistic : Chi-Squared =          47.90 using 59 PHA bins.
# Reduced chi-squared =         0.8709 for     55 degrees of freedom
# Null hypothesis probability =   7.403183e-01

Photon flux (15-150 keV)    in 86.82 sec:  (    ) ph/cm2/s
Energy fluence (15-150 keV)             : 0 ( 0  0 ) ergs/cm2
Single BB
Spectral model blackbody:
------------------------------------------------------------
Parameters  : value    Lower 90%  Upper 90%
kT [keV]    : 16.4322  (  )
R^2/D10^2   : 5.44503E-02  (   )
(R is the radius in km and D10 is the distance to the source in units of 10 kpc)
------------------------------------------------------------
#Fit statistic : Chi-Squared =         327.15 using 59 PHA bins.
# Reduced chi-squared =         5.7395 for     57 degrees of freedom
# Null hypothesis probability =   1.436934e-39

Energy  Fluence     90% Error
[keV]   [erg/cm2]   [erg/cm2]
15- 25  2.623e-07   1.558e-08
25- 50  1.129e-06   4.081e-08
50-150  2.151e-06   1.237e-07
15-150  3.542e-06   1.220e-07
Thermal bremsstrahlung (OTTB)
Spectral model: thermal bremsstrahlung
------------------------------------------------------------
Parameters  : value         Lower 90%    Upper 90%
kT [keV]    : 200.000       (      )
Norm        : 2.84514       (-0.0806398     0.0806387)
------------------------------------------------------------
#Fit statistic : Chi-Squared =          58.65 using 59 PHA bins.
# Reduced chi-squared =          1.029 for     57 degrees of freedom
# Null hypothesis probability =   4.147995e-01

Energy  Fluence     90% Error
[keV]   [erg/cm2]   [erg/cm2]
15- 25  6.151e-07   1.901e-08
25- 50  1.183e-06   3.690e-08
50-150  2.595e-06   7.857e-08
15-150  4.394e-06   1.402e-07
Double BB
Spectral model: bbodyrad<1> + bbodyrad<2>
------------------------------------------------------------
Parameters  : value         Lower 90%    Upper 90%
kT1 [keV]   : 6.58598        (-0.658512      0.725861)
R1^2/D10^2  : 0.897015        (-0.284412      0.447911)
kT2 [keV]   : 27.0120        (-2.36063      3.01082)
R2^2/D10^2  : 8.30751E-03    (-0.00253932   0.00316951)
------------------------------------------------------------
#Fit statistic : Chi-Squared =          48.91 using 59 PHA bins.
# Reduced chi-squared =         0.8892 for     55 degrees of freedom
# Null hypothesis probability =   7.053387e-01

Energy  Fluence     90% Error
[keV]   [erg/cm2]   [erg/cm2]
15- 25  5.947e-07   5.787e-08
25- 50  1.131e-06   7.249e-08
50-150  2.832e-06   2.309e-07
15-150  4.558e-06   3.091e-07
Peak spectrum fit
Power-law model
Time interval is from   36.556 sec. to   37.556 sec.

Spectral model in power-law:
------------------------------------------------------------
Parameters  : value       lower 90%   higher 90%
Photon index: 1.31356     ( -0.128593   0.129308 )
Norm@50keV  : 2.24175E-02    ( -0.0015482   0.00154279 )
------------------------------------------------------------
#Fit statistic : Chi-Squared =          60.52 using 59 PHA bins.
# Reduced chi-squared =          1.062 for     57 degrees of freedom
# Null hypothesis probability =   3.499467e-01

Photon flux (15-150 keV)    in 1 sec: 2.68126 ( -0.182829  0.183015 ) ph/cm2/s
Energy fluence (15-150 keV)             : 2.20801e-07 ( -1.77985e-08  1.797e-08 ) ergs/cm2
Cutoff power-law model

Time interval is from   36.556 sec. to   37.556 sec.
Spectral model in the cutoff power-law:
------------------------------------------------------------
Parameters  : value       lower 90%   higher 90%
Photon index: 1.30911     ( -0.225458   0.130845 )
Epeak [keV] : 9999.28      ( -9999.36 -9999.36 )
Norm@50keV  : 2.25104E-02    ( -0.00557925   0.00699469 )
------------------------------------------------------------
#Fit statistic : Chi-Squared =          60.55 using 59 PHA bins.
# Reduced chi-squared =          1.081 for     56 degrees of freedom
# Null hypothesis probability =   3.150466e-01

Photon flux (15-150 keV)    in 1 sec: 2.68250 ( -0.18444  0.18128 ) ph/cm2/s
Energy fluence (15-150 keV)             : 2.20425e-07 ( -1.7369e-08  1.8038e-08 ) ergs/cm2
Band function

Time interval is from   36.556 sec. to   37.556 sec.

Spectral model in the Band function:
------------------------------------------------------------
Parameters  : value       lower 90%   higher 90%
alpha       : -1.06766   ( 1.06767   1.06767 )
beta        : -1.31354    ( -0.129461   0.128594 )
Epeak [keV] : 38.4848      ( -38.4829 -38.4829 )
Norm@50keV   : 4.24277E-02    ( -0.0164765   3.21411 )
------------------------------------------------------------
#Fit statistic : Chi-Squared =          60.52 using 59 PHA bins.
# Reduced chi-squared =          1.100 for     55 degrees of freedom
# Null hypothesis probability =   2.833449e-01

Photon flux (15-150 keV)    in 1 sec:  (    ) ph/cm2/s
Energy fluence (15-150 keV)             : 0 ( 0  0 ) ergs/cm2
Single BB
Spectral model blackbody:
------------------------------------------------------------
Parameters  : value    Lower 90%  Upper 90%
kT [keV]    : 17.4518  (  )
R^2/D10^2   : 0.182227  (   )
(R is the radius in km and D10 is the distance to the source in units of 10 kpc)
------------------------------------------------------------
#Fit statistic : Chi-Squared =         129.82 using 59 PHA bins.
# Reduced chi-squared =         2.2776 for     57 degrees of freedom
# Null hypothesis probability =   1.322427e-07

Energy  Fluence     90% Error
[keV]   [erg/cm2]   [erg/cm2]
15- 25  1.122e-08   1.438e-09
25- 50  5.068e-08   4.985e-09
50-150  1.111e-07   1.490e-08
15-150  1.730e-07   1.650e-08
Thermal bremsstrahlung (OTTB)
Spectral model: thermal bremsstrahlung
------------------------------------------------------------
Parameters  : value         Lower 90%    Upper 90%
kT [keV]    : 200.000       (      )
Norm        : 10.8470       (-0.747914     0.74792)
------------------------------------------------------------
#Fit statistic : Chi-Squared =          72.90 using 59 PHA bins.
# Reduced chi-squared =          1.279 for     57 degrees of freedom
# Null hypothesis probability =   7.626689e-02

Energy  Fluence     90% Error
[keV]   [erg/cm2]   [erg/cm2]
15- 25  2.719e-08   2.300e-09
25- 50  5.230e-08   8.545e-09
50-150  1.147e-07   3.796e-08
15-150  1.942e-07   5.583e-08
Double BB

Spectral model: bbodyrad<1> + bbodyrad<2>
------------------------------------------------------------
Parameters  : value         Lower 90%    Upper 90%
kT1 [keV]   : 6.32609        (-1.21611      1.43359)
R1^2/D10^2  : 3.83978        (-1.97337      4.8251)
kT2 [keV]   : 31.3742        (-5.6782      9.50771)
R2^2/D10^2  : 2.37018E-02    (-0.0129537   0.0212247)
------------------------------------------------------------
#Fit statistic : Chi-Squared =          58.63 using 59 PHA bins.
# Reduced chi-squared =          1.066 for     55 degrees of freedom
# Null hypothesis probability =   3.438516e-01

Energy  Fluence     90% Error
[keV]   [erg/cm2]   [erg/cm2]
15- 25  2.550e-08   8.125e-09
25- 50  4.680e-08   9.425e-09
50-150  1.549e-07   4.028e-08
15-150  2.272e-07   5.810e-08
Pre-slew spectrum (Pre-slew PHA with pre-slew DRM)
Power-law model

Spectral model in power-law:
------------------------------------------------------------
Parameters  : value       lower 90%   higher 90%
Photon index: 1.49082     ( -0.105779   0.106326 )
Norm@50keV  : 6.06570E-03    ( -0.000357756   0.000356444 )
------------------------------------------------------------
#Fit statistic : Chi-Squared =          57.60 using 59 PHA bins.
# Reduced chi-squared =          1.010 for     57 degrees of freedom
# Null hypothesis probability =   4.530136e-01

Photon flux (15-150 keV)    in 17.57 sec: 0.755363 ( -0.0440985  0.0442101 ) ph/cm2/s
Energy fluence (15-150 keV)             : 1.01255e-06 ( -6.61795e-08  6.66904e-08 ) ergs/cm2
Cutoff power-law model

Spectral model in the cutoff power-law:
------------------------------------------------------------
Parameters  : value       lower 90%   higher 90%
Photon index: 1.34539     ( -0.412242   0.200101 )
Epeak [keV] : 224.048      ( -224.048 -224.048 )
Norm@50keV  : 7.18381E-03    ( -0.00143024   0.00426892 )
------------------------------------------------------------
#Fit statistic : Chi-Squared =          57.18 using 59 PHA bins.
# Reduced chi-squared =          1.021 for     56 degrees of freedom
# Null hypothesis probability =   4.311141e-01

Photon flux (15-150 keV)    in 17.57 sec: 0.749153 ( -0.046901  0.046624 ) ph/cm2/s
Energy fluence (15-150 keV)             : 9.99506e-07 ( -7.53876e-08  7.47182e-08 ) ergs/cm2
Band function
Spectral model in the Band function:
------------------------------------------------------------
Parameters  : value       lower 90%   higher 90%
alpha       : -0.202915   ( 0.886403   0.886403 )
beta        : -1.55075    ( 1.55523   0.14867 )
Epeak [keV] : 40.1251      ( -40.0644 210.524 )
Norm@50keV   : 4.68693E-02    ( -0.0484061   275.355 )
------------------------------------------------------------
#Fit statistic : Chi-Squared =          56.47 using 59 PHA bins.
# Reduced chi-squared =          1.027 for     55 degrees of freedom
# Null hypothesis probability =   4.199192e-01

Photon flux (15-150 keV)    in 17.57 sec: 0.747014 (    ) ph/cm2/s
Energy fluence (15-150 keV)             : 0 ( 0  0 ) ergs/cm2
S(25-50 keV) vs. S(50-100 keV) plot

S(25-50 keV)  = 1.14e-06
S(50-100 keV) = 1.61e-06
T90 vs. Hardness ratio plot

T90                                   = 52.2519999742508 sec.
Hardness ratio (energy fluence ratio) = 1.41228
Color vs. Color plot
Count Ratio  (25-50 keV) / (15-25 keV) = 1.24381
Count Ratio (50-100 keV) / (15-25 keV) = 0.971596
Mask shadow pattern
IMX = 2.721098443244023E-01, IMY = 3.248983524118090E-01
TIME vs. PHA plot around the trigger time

Blue+Cyan dotted lines: Time interval of the scaled map
From 0.000000 to 0.512000
TIME vs. DetID plot around the trigger time

Blue+Cyan dotted lines: Time interval of the scaled map
From 0.000000 to 0.512000
100 us light curve (15-350 keV)
Blue+Cyan dotted lines: Time interval of the scaled map
From 0.000000 to 0.512000
Spacecraft aspect plot
Bright source in the pre-burst/pre-slew/post-slew images
Pre-burst image of 15-350 keV band
Time interval of the image:
-265.283400 -250.524600
-239.184000 -6.852000

# RAcent  DECcent POSerr Theta    Phi  PeakCts   SNR AngSep     Name
#  [deg]    [deg]    ['] [deg]  [deg]                   [']
254.3577  35.4718    6.1  35.4 -100.5   0.9621   1.9    9.2	Her X-1
299.6630  35.2264    5.0  38.5 -163.4   0.7384   2.3    3.9	Cyg X-1
308.1664  40.9669    2.0  35.2 -177.1   1.7043   5.8    2.7	Cyg X-3
326.1504  38.2272    6.0  43.3  164.6   0.9178   1.9    5.8	Cyg X-2
301.7294  14.7887    3.6  58.8 -159.1   4.8897   3.3 ------	UNKNOWN
289.2860  16.1550    4.4  55.2 -145.3   3.7771   2.6 ------	UNKNOWN
Pre-slew background subtracted image of 15-350 keV band
Time interval of the image:
-6.852000 10.716620

# RAcent  DECcent POSerr Theta    Phi  PeakCts   SNR AngSep     Name
#  [deg]    [deg]    ['] [deg]  [deg]                   [']
254.3243  35.3422    4.1  35.5 -100.5   0.3060   2.8    6.5	Her X-1
299.3521  35.2577   22.8  38.4 -163.0   0.0400   0.5   12.1	Cyg X-1
307.9435  40.9315    6.0  35.2 -176.8  -0.1357  -1.9    7.7	Cyg X-3
326.1039  38.2229   20.6  43.3  164.6   0.0624   0.6    6.7	Cyg X-2
335.2550  42.1814    2.3  42.8  152.9   0.6186   5.1 ------	UNKNOWN
228.5290  55.3184    0.5  23.0  -50.1   1.6262  24.9 ------	UNKNOWN
184.2642  39.0602    2.0  52.0  -20.5   0.7921   5.7 ------	UNKNOWN
293.9580  17.4747    2.5  54.7 -150.9   0.9980   4.7 ------	UNKNOWN
Post-slew image of 15-350 keV band
Time interval of the image:
55.516600 422.916630

# RAcent  DECcent POSerr Theta    Phi  PeakCts   SNR AngSep     Name
#  [deg]    [deg]    ['] [deg]  [deg]                   [']
254.5355  35.2875   61.2  26.8 -130.0  -0.0656  -0.2    5.0	Her X-1
299.6225  35.1479   24.6  51.4 -175.5   0.3325   0.5    3.6	Cyg X-1
307.9888  41.0136    4.5  51.8  173.3   2.2782   2.5    6.6	Cyg X-3
320.1975  72.0841    3.0  39.0  131.8   2.5220   3.8 ------	UNKNOWN
246.5705  46.0696    2.4  14.7 -135.8   1.3006   4.7 ------	UNKNOWN
183.5023  12.1576    4.3  55.5  -20.4   3.0020   2.7 ------	UNKNOWN
184.8294   7.5450    3.9  58.9  -24.4   6.6944   3.0 ------	UNKNOWN
285.9965  18.1193    2.6  56.9 -150.6   6.7404   4.5 ------	UNKNOWN
Plot creation:
Sat May 30 17:52:03 EDT 2015