Special notes of this burst
Image
Pre-slew 15.0-350.0 keV image (Event data)
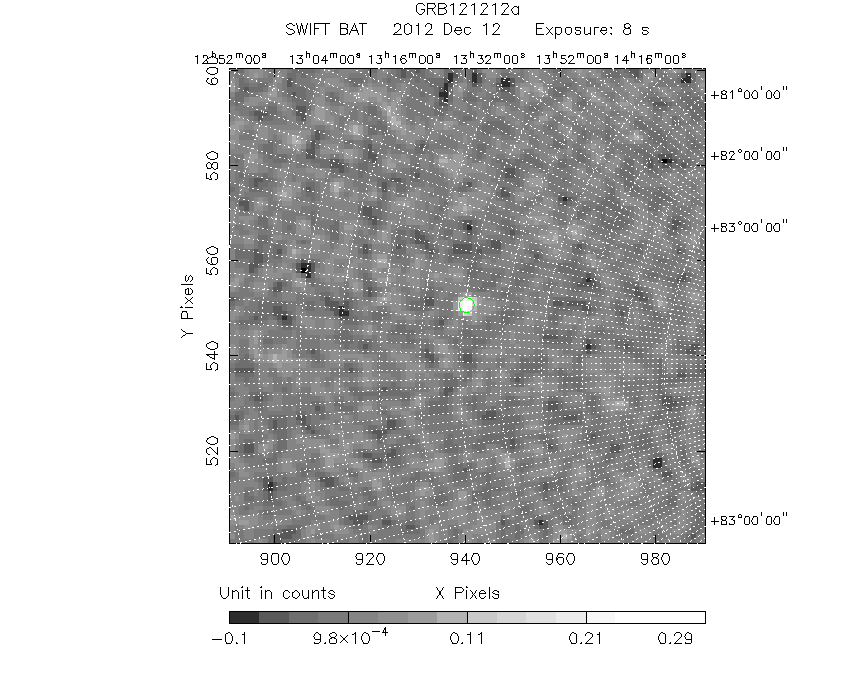
#   RAcent    DECcent   POSerr    Theta     Phi              Peak Cts       SNR   Name
  177.7715    78.0463   0.0173    11.3716  -129.3365         0.3368584     11.057 TRIG_00541371

Foreground time interval of the image:
 -1.484   6.628 (delta_t =   8.112 [sec])
Background time interval of the image:
-239.360  -1.484 (delta_t = 237.876 [sec])
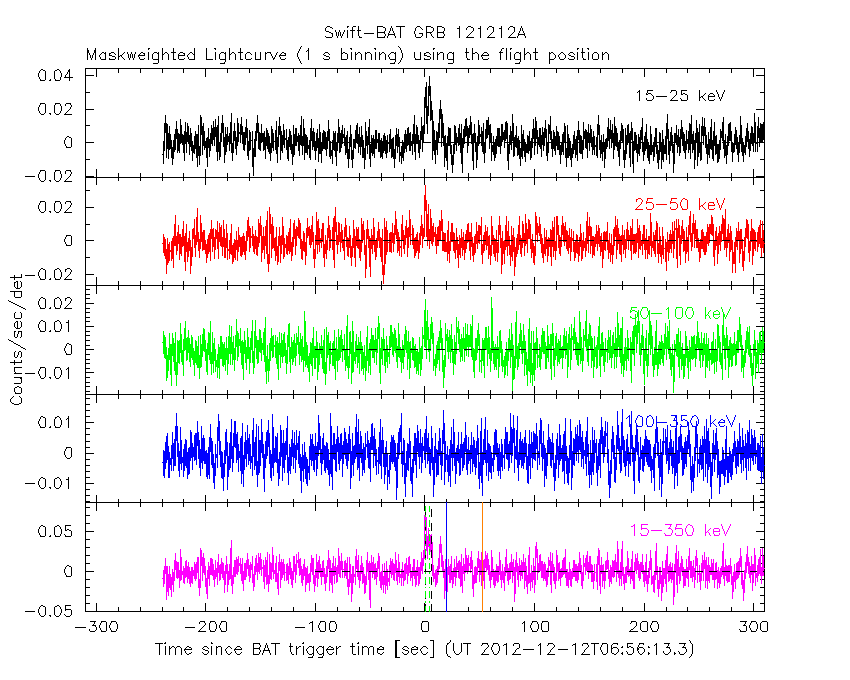
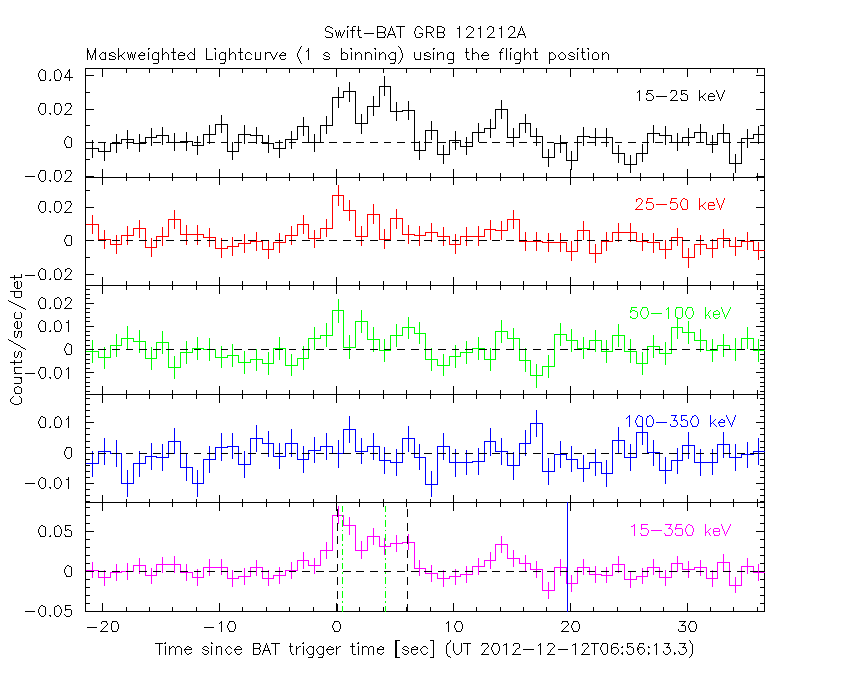
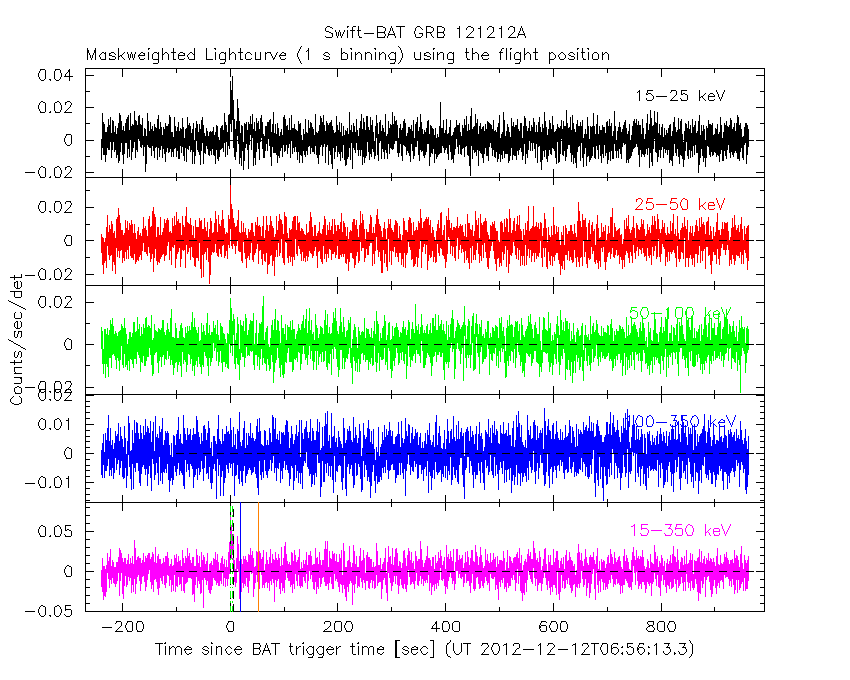
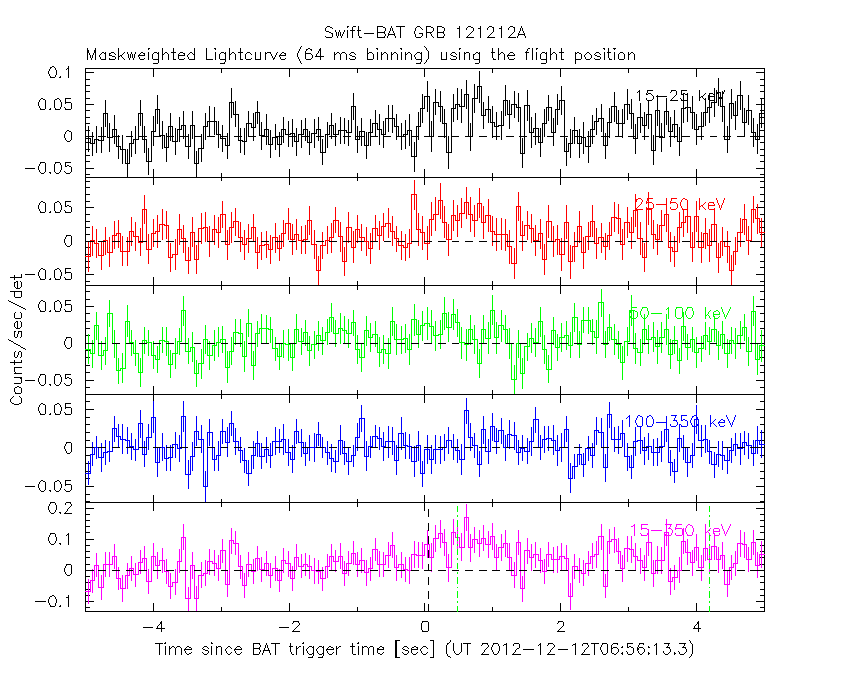
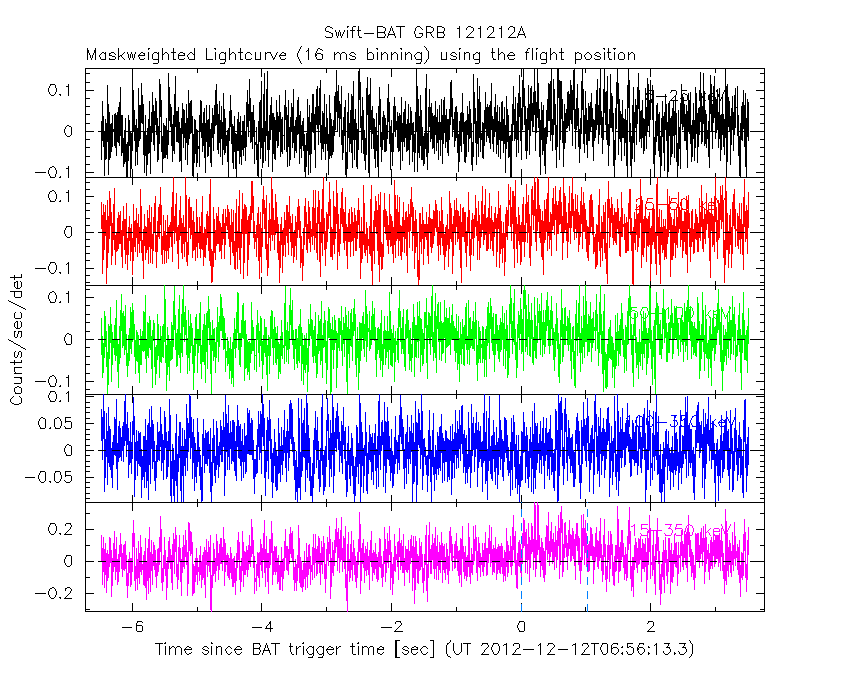
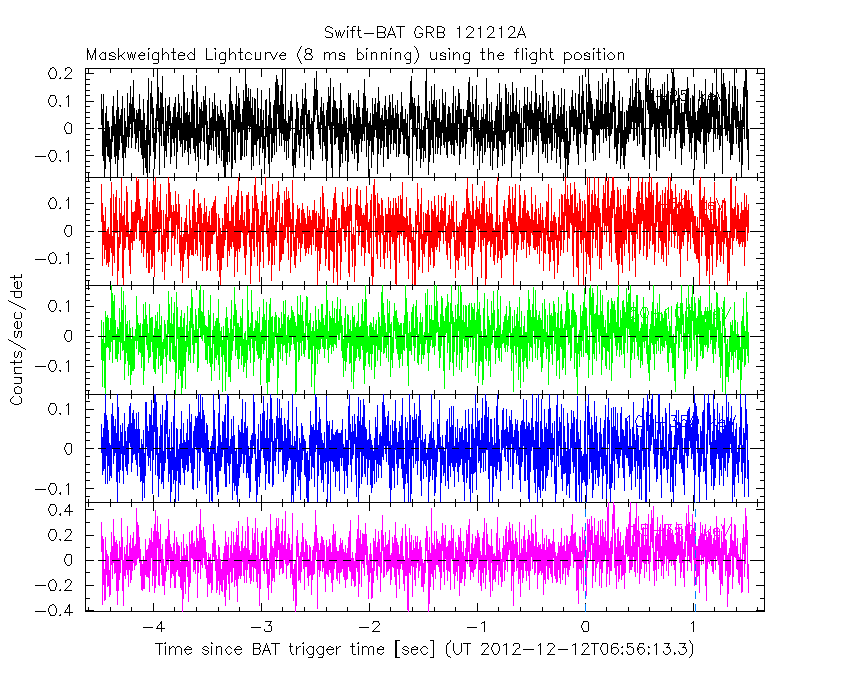
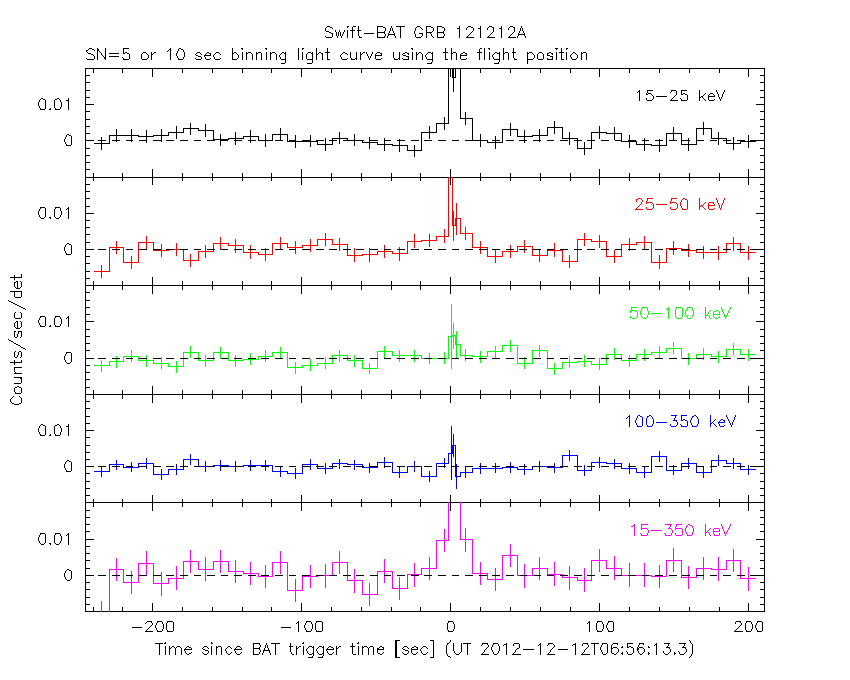
Lightcurves
Notes:
- 1) The mask-weighted light curves are using the flight position.
- 2) Multiple plots of different time binning/intervals are shown to cover all scenarios of short/long GRBs, rate/image triggers, and real/false positives.
- 3) For all the mask-weighted lightcurves, the y-axis units are counts/sec/det where a det is 0.4 x 0.4 = 0.16 sq cm.
- 4) The verticle lines correspond to following: green dotted lines are T50 interval, black dotted lines are T90 interval, blue solid line(s) is a spacecraft slew start time, and orange solid line(s) is a spacecraft slew end time.
- 5) Time of each bin is in the middle of the bin.
1 s binning
From T0-310 s to T0+310 s
From T100_start - 20 s to T100_end + 30 s
Full time interval
64 ms binning
Full time interval

From T100_start to T100_end
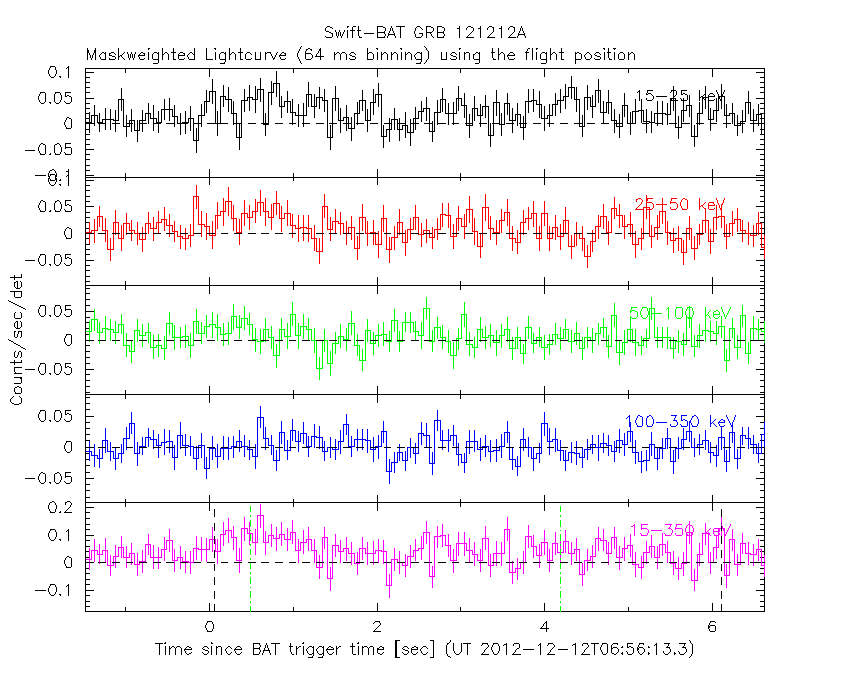
From T0-5 sec to T0+5 sec
16 ms binning
From T100_start-5 s to T100_start+5 s
Blue+Cyan dotted lines: Time interval of the scaled map
From 0.000000 to 1.024000
8 ms binning
From T100_start-3 s to T100_start+3 s
Blue+Cyan dotted lines: Time interval of the scaled map
From 0.000000 to 1.024000
2 ms binning
From T100_start-1 s to T100_start+1 s
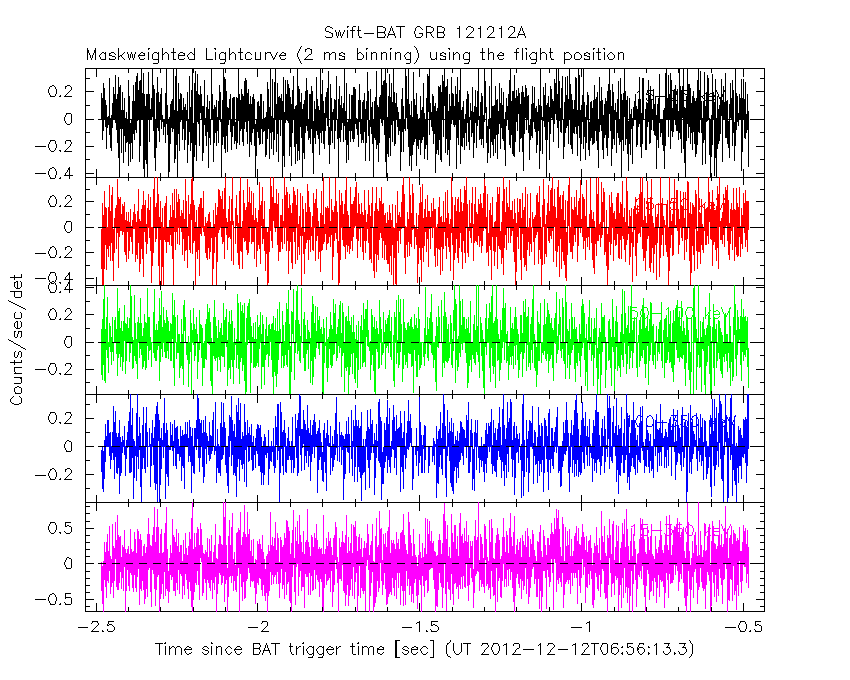
Blue+Cyan dotted lines: Time interval of the scaled map
From 0.000000 to 1.024000
SN=5 or 10 sec. binning (whichever binning is satisfied first)

SN=5 or 10 sec. binning (T < 200 sec)
Quad-rate summed light curves (from T0-300s to T0+1000s)

The mask-weighted light curves based on cleaned DPHs

Spectral Evolution

Spectra
Notes:
- 1) The fitting includes the systematic errors.
- 2) When the burst includes telescope slew time periods, the fitting uses an average response file made from multiple 5-s response files through out the slew time plus single time preiod for the non-slew times, and weighted by the total counts in the corresponding time period using addrmf. An average response file is needed becuase a spectral fit using the pre-slew DRM will introduce some errors in both a spectral shape and a normalization if the PHA file contains a lot of the slew/post-slew time interval.
- 3) For fits to more complicated models (e.g. a power-law over a cutoff power-law), the BAT team has decided to require a chi-square improvement of more than 6 for each extra dof.
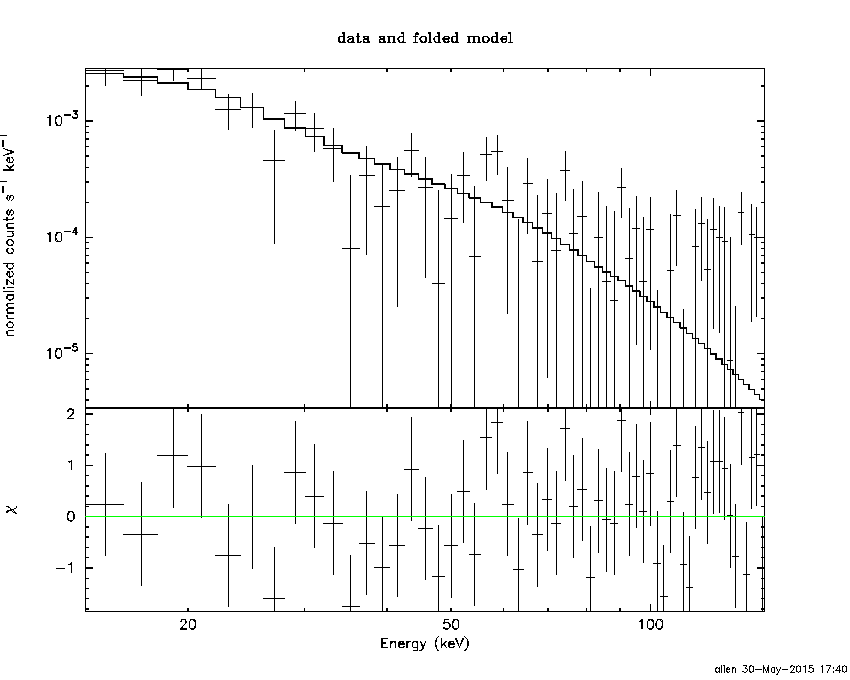
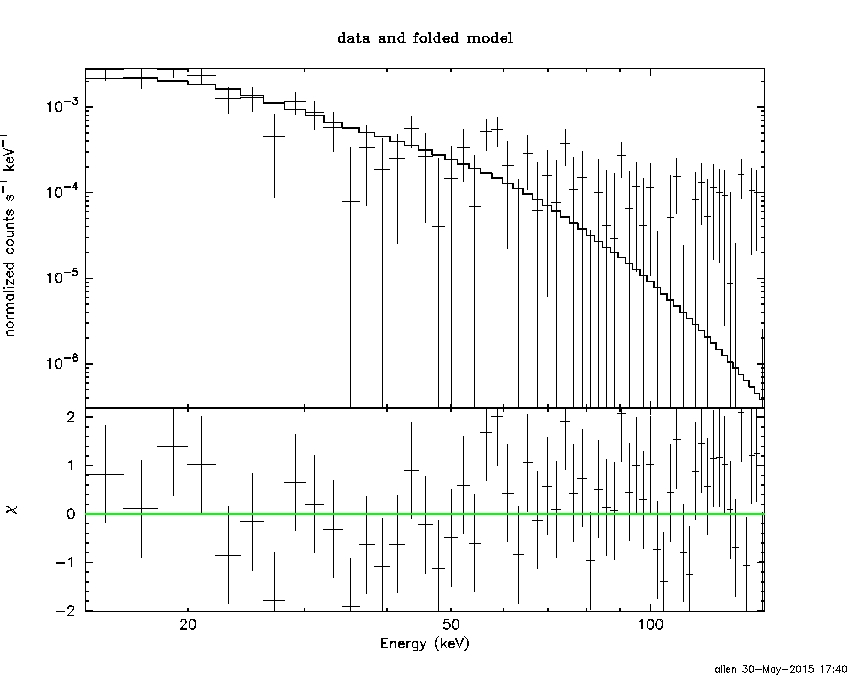
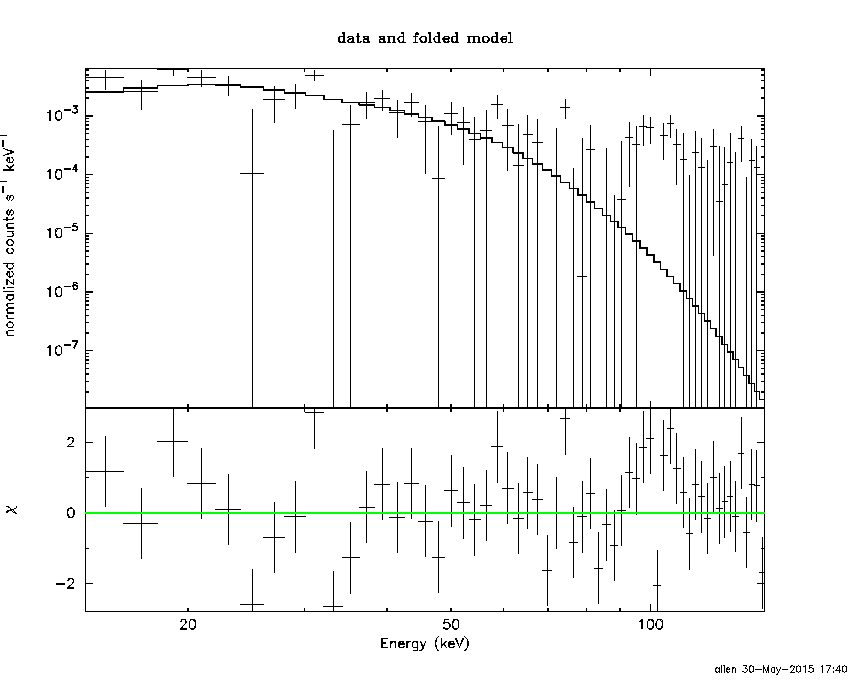
Time averaged spectrum fit using the average DRM
Power-law model

Time interval is from   -1.484 sec. to    6.628 sec.

Spectral model in power-law:
------------------------------------------------------------
Parameters  : value       lower 90%   higher 90%
Photon index: 2.50435     ( -0.349053   0.403059 )
Norm@50keV  : 1.71165E-03    ( -0.000475395   0.000468431 )
------------------------------------------------------------
#Fit statistic : Chi-Squared =          55.82 using 59 PHA bins.
# Reduced chi-squared =         0.9793 for     57 degrees of freedom
# Null hypothesis probability =   5.194698e-01

Photon flux (15-150 keV)    in 8.112 sec: 0.337143 ( -0.0463148  0.0463397 ) ph/cm2/s
Energy fluence (15-150 keV)             : 1.39001e-07 ( -2.63569e-08  2.81675e-08 ) ergs/cm2
Cutoff power-law model

Time interval is from   -1.484 sec. to    6.628 sec.
Spectral model in the cutoff power-law:
------------------------------------------------------------
Parameters  : value       lower 90%   higher 90%
Photon index: 1.98430     (     )
Epeak [keV] : 1.43317      ( -0.858517 22.0848 )
Norm@50keV  : 3.24979E-03    (     )
------------------------------------------------------------
#Fit statistic : Chi-Squared =          58.65 using 59 PHA bins.
# Reduced chi-squared =          1.047 for     56 degrees of freedom
# Null hypothesis probability =   3.785155e-01

Photon flux (15-150 keV)    in 8.112 sec: 0.336247 ( -0.045962  0.046743 ) ph/cm2/s
Energy fluence (15-150 keV)             : 1.37601e-07 ( 0  0 ) ergs/cm2
Band function
Time interval is from   -1.484 sec. to    6.628 sec.

Spectral model in the Band function:
------------------------------------------------------------
Parameters  : value       lower 90%   higher 90%
alpha       : -1.65973   ( 1.66042   1.66042 )
beta        : -2.50214    ( -0.427496   0.347938 )
Epeak [keV] : 6.49418      ( -6.14802 9969.94 )
Norm@50keV   : 1.03497E-02    ( -0.0108816   1.63131e+06 )
------------------------------------------------------------
#Fit statistic : Chi-Squared =          55.83 using 59 PHA bins.
# Reduced chi-squared =          1.015 for     55 degrees of freedom
# Null hypothesis probability =   4.435858e-01

Photon flux (15-150 keV)    in 8.112 sec:  (    ) ph/cm2/s
Energy fluence (15-150 keV)             : 0 ( 0  0 ) ergs/cm2
Single BB
Spectral model blackbody:
------------------------------------------------------------
Parameters  : value    Lower 90%  Upper 90%
kT [keV]    : 5.40639  (-0.961643  1.26056)
R^2/D10^2   : 1.79501  (-1.07408   2.65337)
(R is the radius in km and D10 is the distance to the source in units of 10 kpc)
------------------------------------------------------------
#Fit statistic : Chi-Squared =          74.15 using 59 PHA bins.
# Reduced chi-squared =          1.301 for     57 degrees of freedom
# Null hypothesis probability =   6.301992e-02

Energy  Fluence     90% Error
[keV]   [erg/cm2]   [erg/cm2]
15- 25  4.792e-08   1.373e-08
25- 50  3.777e-08   1.188e-08
50-150  2.211e-09   1.426e-09
15-150  8.790e-08   2.062e-08
Thermal bremsstrahlung (OTTB)
Spectral model: thermal bremsstrahlung
------------------------------------------------------------
Parameters  : value         Lower 90%    Upper 90%
kT [keV]    : 29.5727       (-11.2514      21.5743)
Norm        : 2.65664       (-0.880354     1.66585)
------------------------------------------------------------
#Fit statistic : Chi-Squared =          62.61 using 59 PHA bins.
# Reduced chi-squared =          1.098 for     57 degrees of freedom
# Null hypothesis probability =   2.838653e-01

Energy  Fluence     90% Error
[keV]   [erg/cm2]   [erg/cm2]
15- 25  4.354e-08   8.408e-09
25- 50  4.935e-08   1.069e-08
50-150  2.652e-08   1.448e-08
15-150  1.194e-07   2.498e-08
Double BB
Spectral model: bbodyrad<1> + bbodyrad<2>
------------------------------------------------------------
Parameters  : value         Lower 90%    Upper 90%
kT1 [keV]   : 4.11702        (-0.837293      0.983781)
R1^2/D10^2  : 5.57678        (-3.51394      11.8888)
kT2 [keV]   : 24.6577        (-9.32733      27.9647)
R2^2/D10^2  : 3.46914E-03    (-0.00306037   0.0159034)
------------------------------------------------------------
#Fit statistic : Chi-Squared =          51.25 using 59 PHA bins.
# Reduced chi-squared =         0.9319 for     55 degrees of freedom
# Null hypothesis probability =   6.185152e-01

Energy  Fluence     90% Error
[keV]   [erg/cm2]   [erg/cm2]
15- 25  5.022e-08   2.629e-08
25- 50  3.537e-08   1.464e-08
50-150  7.645e-08   4.580e-08
15-150  1.620e-07   7.337e-08
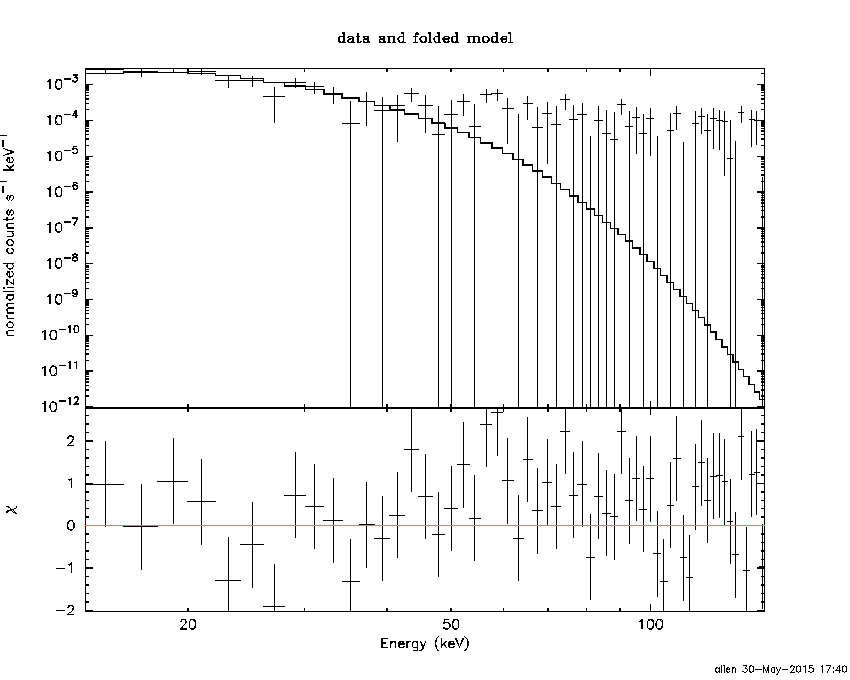
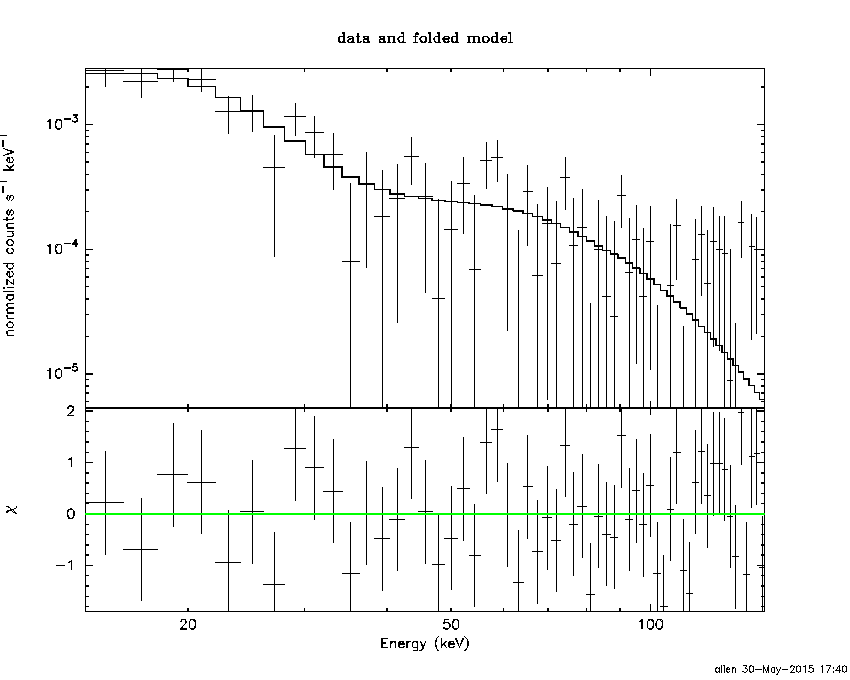
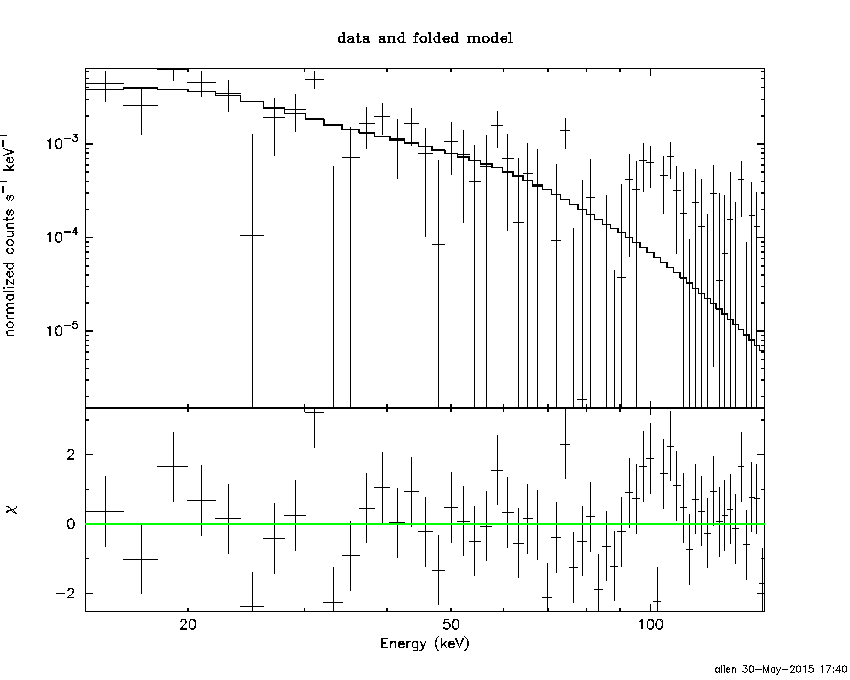
Peak spectrum fit
Power-law model

Time interval is from    0.016 sec. to    1.016 sec.

Spectral model in power-law:
------------------------------------------------------------
Parameters  : value       lower 90%   higher 90%
Photon index: 2.05188     ( -0.340627   0.382349 )
Norm@50keV  : 4.88023E-03    ( -0.00125844   0.00120546 )
------------------------------------------------------------
#Fit statistic : Chi-Squared =          81.43 using 59 PHA bins.
# Reduced chi-squared =          1.429 for     57 degrees of freedom
# Null hypothesis probability =   1.853773e-02

Photon flux (15-150 keV)    in 1 sec: 0.750052 ( -0.132495  0.132523 ) ph/cm2/s
Energy fluence (15-150 keV)             : 4.51548e-08 ( -1.02606e-08  1.08055e-08 ) ergs/cm2
Cutoff power-law model
Time interval is from    0.016 sec. to    1.016 sec.
Spectral model in the cutoff power-law:
------------------------------------------------------------
Parameters  : value       lower 90%   higher 90%
Photon index: 2.14502     ( -2.0733   0.0201207 )
Epeak [keV] : 69.1936      (   )
Norm@50keV  : 4.28166E-03    (     )
------------------------------------------------------------
#Fit statistic : Chi-Squared =          81.41 using 59 PHA bins.
# Reduced chi-squared =          1.454 for     56 degrees of freedom
# Null hypothesis probability =   1.491978e-02

Photon flux (15-150 keV)    in 1 sec: 0.749807 ( -0.132327  0.132109 ) ph/cm2/s
Energy fluence (15-150 keV)             : 4.50711e-08 ( -1.32378e-08  1.07892e-08 ) ergs/cm2
Band function
Time interval is from    0.016 sec. to    1.016 sec.

Spectral model in the Band function:
------------------------------------------------------------
Parameters  : value       lower 90%   higher 90%
alpha       : 2.32665   ( -2.32769   -2.32769 )
beta        : -2.12208    ( -2.04282   0.382854 )
Epeak [keV] : 20.1189      ( -20.1458 27.0588 )
Norm@50keV   : 20.9990    ( -21.0133   1396.59 )
------------------------------------------------------------
#Fit statistic : Chi-Squared =          81.20 using 59 PHA bins.
# Reduced chi-squared =          1.476 for     55 degrees of freedom
# Null hypothesis probability =   1.234111e-02

Photon flux (15-150 keV)    in 1 sec:  (    ) ph/cm2/s
Energy fluence (15-150 keV)             : 0 ( 0  0 ) ergs/cm2
Single BB
Spectral model blackbody:
------------------------------------------------------------
Parameters  : value    Lower 90%  Upper 90%
kT [keV]    : 8.68061  (-1.64427  1.98893)
R^2/D10^2   : 0.602667  (-0.332748   0.760739)
(R is the radius in km and D10 is the distance to the source in units of 10 kpc)
------------------------------------------------------------
#Fit statistic : Chi-Squared =          87.20 using 59 PHA bins.
# Reduced chi-squared =          1.530 for     57 degrees of freedom
# Null hypothesis probability =   6.162584e-03

Energy  Fluence     90% Error
[keV]   [erg/cm2]   [erg/cm2]
15- 25  8.668e-09   2.785e-09
25- 50  1.740e-08   6.192e-09
50-150  5.934e-09   3.041e-09
15-150  3.200e-08   9.240e-09
Thermal bremsstrahlung (OTTB)
Spectral model: thermal bremsstrahlung
------------------------------------------------------------
Parameters  : value         Lower 90%    Upper 90%
kT [keV]    : 55.6453       (-23.5454      59.4321)
Norm        : 4.06686       (-1.11617     1.6528)
------------------------------------------------------------
#Fit statistic : Chi-Squared =          82.00 using 59 PHA bins.
# Reduced chi-squared =          1.439 for     57 degrees of freedom
# Null hypothesis probability =   1.670906e-02

Energy  Fluence     90% Error
[keV]   [erg/cm2]   [erg/cm2]
15- 25  1.009e-08   2.368e-09
25- 50  1.499e-08   3.965e-09
50-150  1.599e-08   9.173e-09
15-150  4.107e-08   1.337e-08
Double BB
------------------------------------------------------------
Parameters  : value         Lower 90%    Upper 90%
kT1 [keV]   : 7.50304        (      )
R1^2/D10^2  : 0.979736        (-0.574086      4.10416)
kT2 [keV]   : 96.2223        (-97.445      -97.4451)
R2^2/D10^2  : 2.20057E-04    (-0.000186319   0.404048)
------------------------------------------------------------
#Fit statistic : Chi-Squared =          82.85 using 59 PHA bins.
#Fit statistic : Chi-Squared =          81.37 using 59 PHA bins.
# Reduced chi-squared =          1.506 for     55 degrees of freedom
# Reduced chi-squared =          1.480 for     55 degrees of freedom
# Null hypothesis probability =   8.970645e-03
# Null hypothesis probability =   1.194321e-02

Energy  Fluence     90% Error
[keV]   [erg/cm2]   [erg/cm2]
15- 25  1.037e-08   5.590e-09
25- 50  1.483e-08   8.005e-09
50-150  1.145e-08   7.215e-09
15-150  3.666e-08   1.915e-08
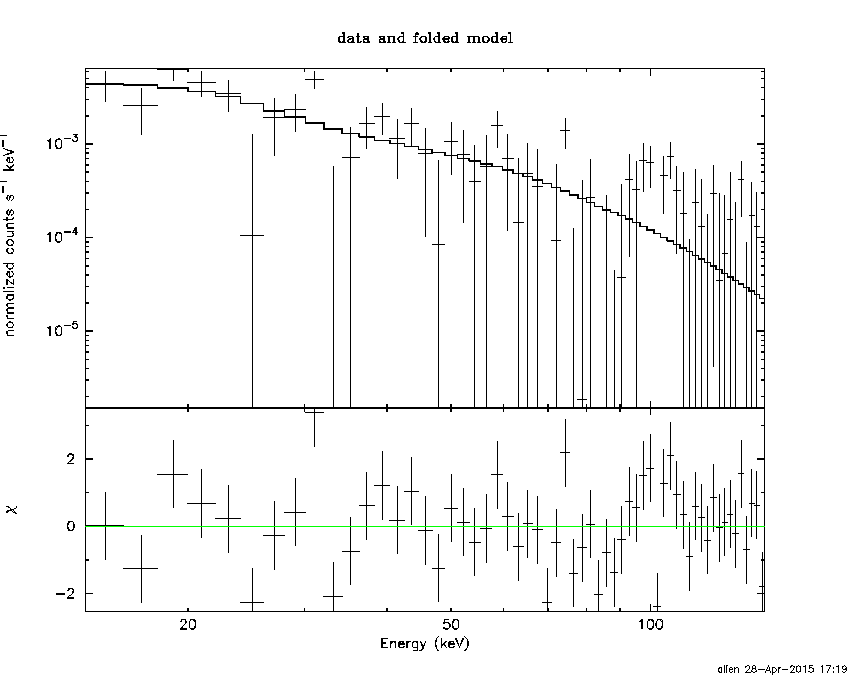
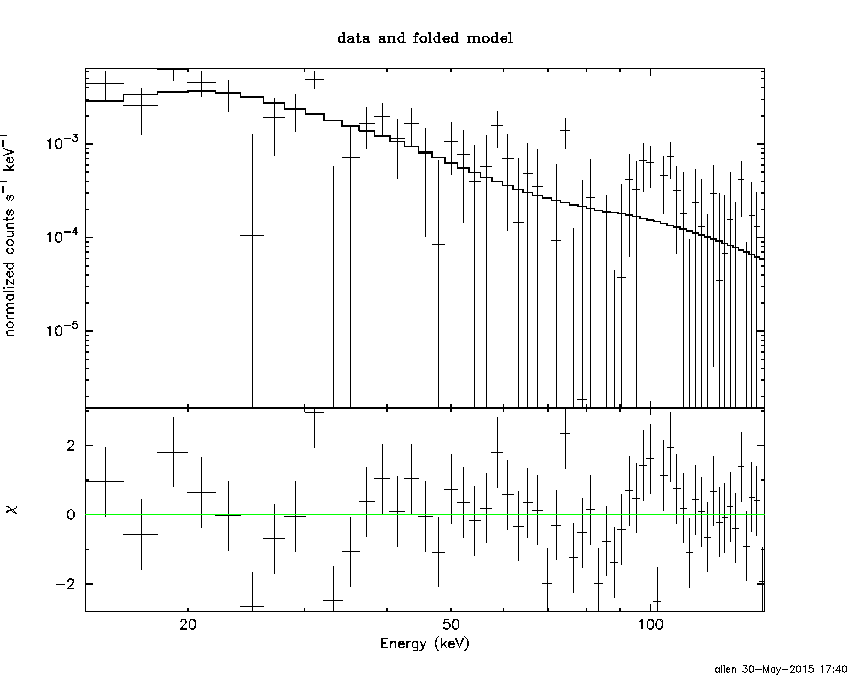
Pre-slew spectrum (Pre-slew PHA with pre-slew DRM)
Power-law model

Spectral model in power-law:
------------------------------------------------------------
Parameters  : value       lower 90%   higher 90%
Photon index: 2.50435     ( -0.349053   0.403059 )
Norm@50keV  : 1.71165E-03    ( -0.000475395   0.000468431 )
------------------------------------------------------------
#Fit statistic : Chi-Squared =          55.82 using 59 PHA bins.
# Reduced chi-squared =         0.9793 for     57 degrees of freedom
# Null hypothesis probability =   5.194698e-01

Photon flux (15-150 keV)    in 8.112 sec: 0.337143 ( -0.0463148  0.0463397 ) ph/cm2/s
Energy fluence (15-150 keV)             : 1.39001e-07 ( -2.63569e-08  2.81675e-08 ) ergs/cm2
Cutoff power-law model
Spectral model in the cutoff power-law:
------------------------------------------------------------
Parameters  : value       lower 90%   higher 90%
Photon index: 1.98430     (     )
Epeak [keV] : 1.43317      ( -0.858517 22.0848 )
Norm@50keV  : 3.24979E-03    (     )
------------------------------------------------------------
#Fit statistic : Chi-Squared =          58.65 using 59 PHA bins.
# Reduced chi-squared =          1.047 for     56 degrees of freedom
# Null hypothesis probability =   3.785155e-01

Photon flux (15-150 keV)    in 8.112 sec: 0.336247 ( -0.045962  0.046743 ) ph/cm2/s
Energy fluence (15-150 keV)             : 1.37601e-07 ( 0  0 ) ergs/cm2
Band function

Spectral model in the Band function:
------------------------------------------------------------
Parameters  : value       lower 90%   higher 90%
alpha       : -1.65973   ( 1.66042   1.66042 )
beta        : -2.50214    ( -0.427496   0.347938 )
Epeak [keV] : 6.49418      ( -6.14802 9969.94 )
Norm@50keV   : 1.03497E-02    ( -0.0108816   1.63145e+06 )
------------------------------------------------------------
#Fit statistic : Chi-Squared =          55.83 using 59 PHA bins.
# Reduced chi-squared =          1.015 for     55 degrees of freedom
# Null hypothesis probability =   4.435858e-01

Photon flux (15-150 keV)    in 8.112 sec:  (    ) ph/cm2/s
Energy fluence (15-150 keV)             : 0 ( 0  0 ) ergs/cm2
S(25-50 keV) vs. S(50-100 keV) plot
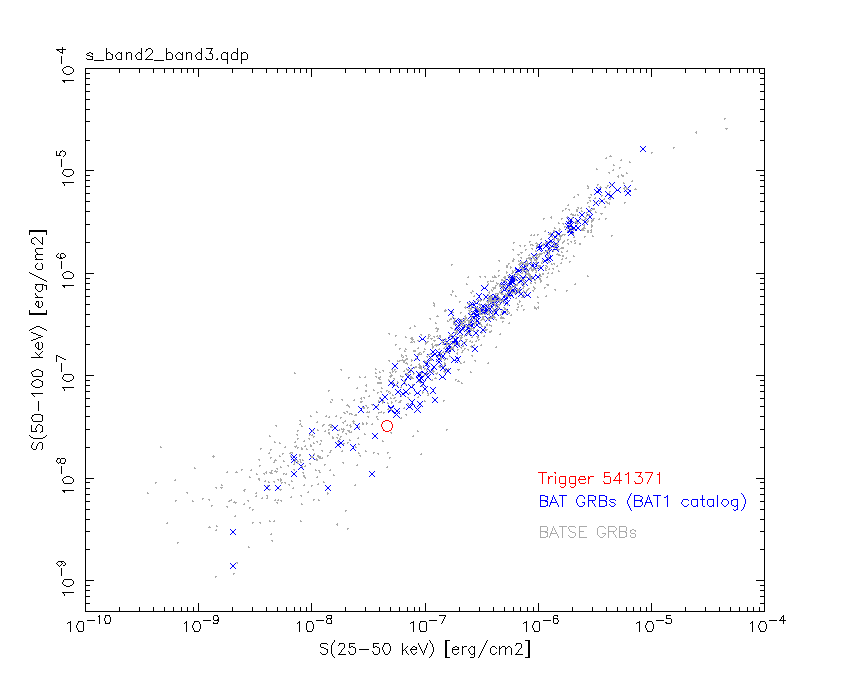
S(25-50 keV)  = 4.61e-08
S(50-100 keV) = 3.25e-08
T90 vs. Hardness ratio plot

T90                                   = 6.05599993467331 sec.
Hardness ratio (energy fluence ratio) = 0.704989
Color vs. Color plot
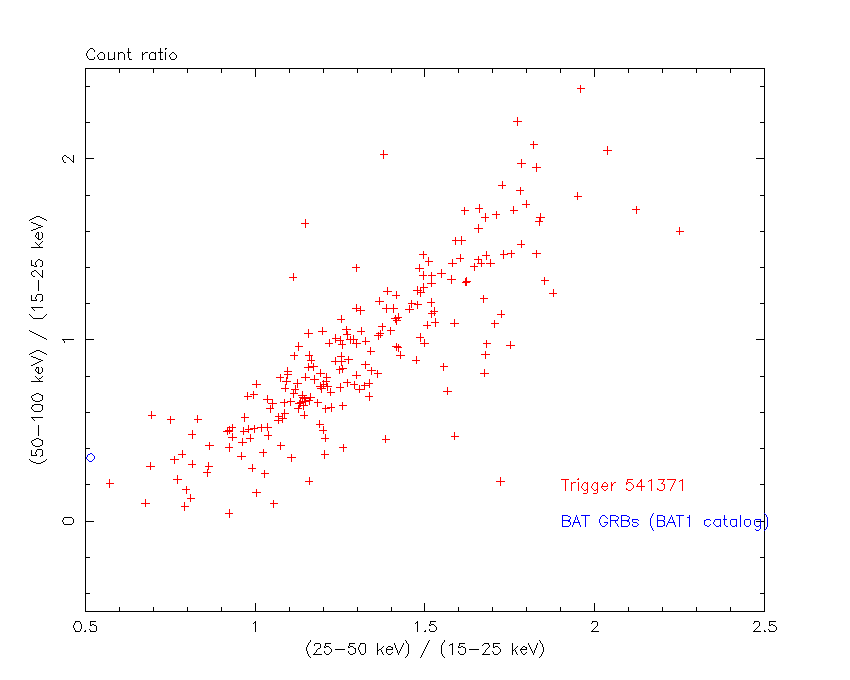
Count Ratio  (25-50 keV) / (15-25 keV) = 0.515351
Count Ratio (50-100 keV) / (15-25 keV) = 0.350781
Mask shadow pattern
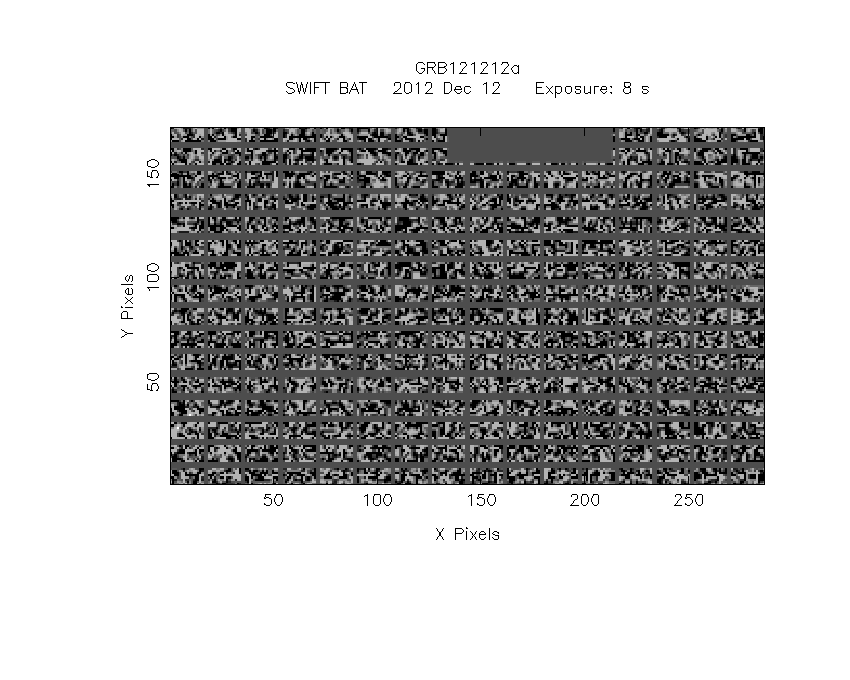
IMX = -1.274847275817709E-01, IMY = 1.555538891043082E-01
TIME vs. PHA plot around the trigger time

Blue+Cyan dotted lines: Time interval of the scaled map
From 0.000000 to 1.024000
TIME vs. DetID plot around the trigger time
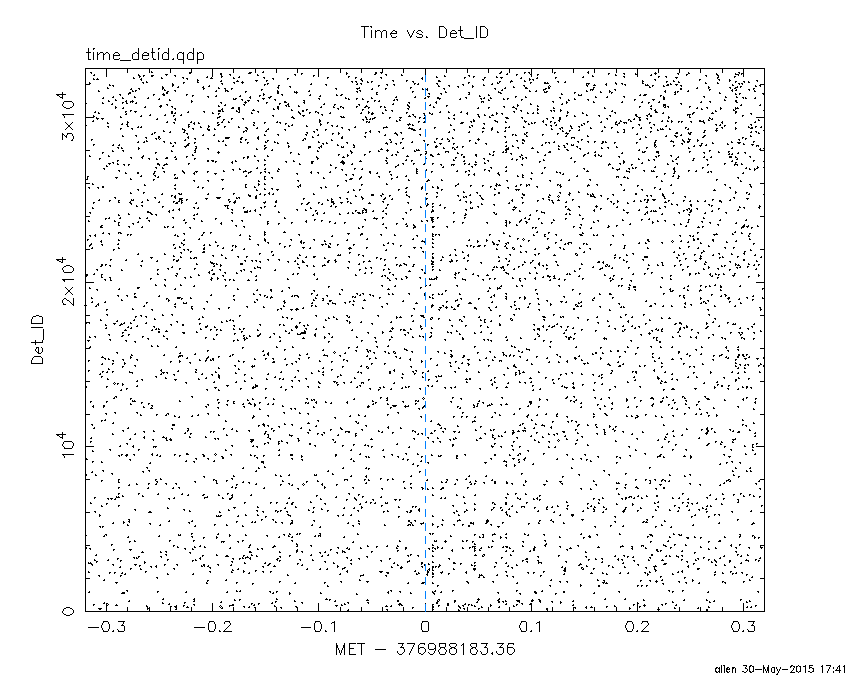
Blue+Cyan dotted lines: Time interval of the scaled map
From 0.000000 to 1.024000
100 us light curve (15-350 keV)

Blue+Cyan dotted lines: Time interval of the scaled map
From 0.000000 to 1.024000
Spacecraft aspect plot

Bright source in the pre-burst/pre-slew/post-slew images
Pre-burst image of 15-350 keV band
Time interval of the image:
-239.360000 -1.484000

# RAcent  DECcent POSerr Theta    Phi  PeakCts   SNR AngSep     Name
#  [deg]    [deg]    ['] [deg]  [deg]                   [']
191.3707  58.4989    3.2  21.0  -59.3   0.7480   3.6 ------	UNKNOWN
Pre-slew background subtracted image of 15-350 keV band
Time interval of the image:
-1.484000 6.628000

# RAcent  DECcent POSerr Theta    Phi  PeakCts   SNR AngSep     Name
#  [deg]    [deg]    ['] [deg]  [deg]                   [']
 89.2251  43.5893    2.1  39.3  100.9   0.6570   5.5 ------	UNKNOWN
177.7715  78.0464    1.0  11.4 -129.3   0.3368  11.1 ------	UNKNOWN
200.1355  41.0122    2.1  38.8  -49.6   0.2606   5.4 ------	UNKNOWN
Post-slew image of 15-350 keV band
Time interval of the image:
52.140600 962.650000

# RAcent  DECcent POSerr Theta    Phi  PeakCts   SNR AngSep     Name
#  [deg]    [deg]    ['] [deg]  [deg]                   [']
308.1062  40.9857   12.4  57.3 -149.3   4.2938   0.9    2.0	Cyg X-3
142.2753  42.8759    3.0  37.9   31.4   3.4631   3.8 ------	UNKNOWN
165.9449  24.5777    2.8  53.7    0.9   6.4963   4.1 ------	UNKNOWN
179.5741  29.6310    2.6  48.4  -14.6   4.8714   4.4 ------	UNKNOWN
293.5919  66.4343    3.1  30.6 -147.5   2.0527   3.7 ------	UNKNOWN
267.1842  69.8916    2.7  23.2 -131.6   2.3325   4.3 ------	UNKNOWN
193.2666  33.5628    5.1  45.0  -30.8   2.2474   2.3 ------	UNKNOWN
322.3046  40.4961    4.0  59.6 -161.7  16.9274   2.9 ------	UNKNOWN
Plot creation:
Sat May 30 17:41:31 EDT 2015