Special notes of this burst
Image
Pre-slew 15.0-350.0 keV image (Event data)
#   RAcent    DECcent   POSerr    Theta     Phi              Peak Cts       SNR   Name
  168.6199   -30.4130   0.0164    47.4554   -14.6502         0.2510439     11.608 TRIG_00544027

Foreground time interval of the image:
 -0.364   0.796 (delta_t =   1.160 [sec])
Background time interval of the image:
-239.920  -0.364 (delta_t = 239.556 [sec])
Lightcurves
Notes:
- 1) The mask-weighted light curves are using the flight position.
- 2) Multiple plots of different time binning/intervals are shown to cover all scenarios of short/long GRBs, rate/image triggers, and real/false positives.
- 3) For all the mask-weighted lightcurves, the y-axis units are counts/sec/det where a det is 0.4 x 0.4 = 0.16 sq cm.
- 4) The verticle lines correspond to following: green dotted lines are T50 interval, black dotted lines are T90 interval, blue solid line(s) is a spacecraft slew start time, and orange solid line(s) is a spacecraft slew end time.
- 5) Time of each bin is in the middle of the bin.
1 s binning
From T0-310 s to T0+310 s
From T100_start - 20 s to T100_end + 30 s

Full time interval

64 ms binning
Full time interval

From T100_start to T100_end

From T0-5 sec to T0+5 sec

16 ms binning
From T100_start-5 s to T100_start+5 s

Blue+Cyan dotted lines: Time interval of the scaled map
From 0.000000 to 1.024000
8 ms binning
From T100_start-3 s to T100_start+3 s

Blue+Cyan dotted lines: Time interval of the scaled map
From 0.000000 to 1.024000
2 ms binning
From T100_start-1 s to T100_start+1 s
Blue+Cyan dotted lines: Time interval of the scaled map
From 0.000000 to 1.024000
SN=5 or 10 sec. binning (whichever binning is satisfied first)
SN=5 or 10 sec. binning (T < 200 sec)

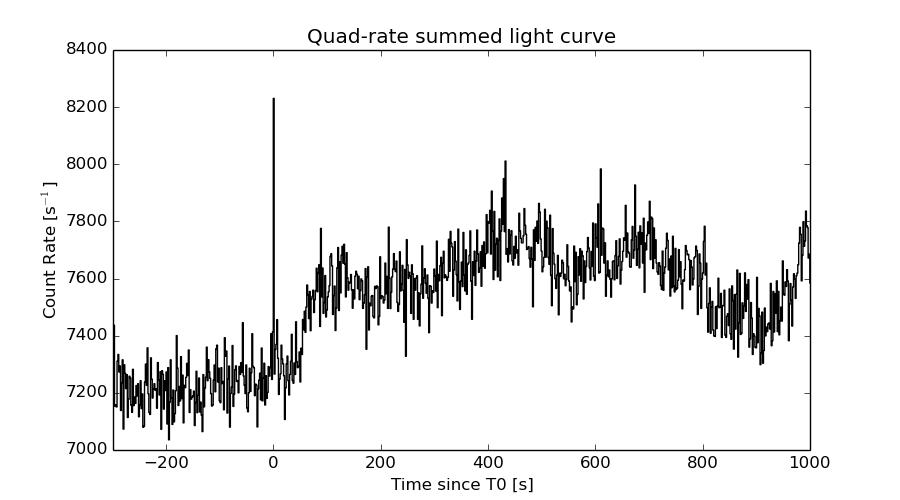
Quad-rate summed light curves (from T0-300s to T0+1000s)
Spectral Evolution

Spectra
Notes:
- 1) The fitting includes the systematic errors.
- 2) When the burst includes telescope slew time periods, the fitting uses an average response file made from multiple 5-s response files through out the slew time plus single time preiod for the non-slew times, and weighted by the total counts in the corresponding time period using addrmf. An average response file is needed becuase a spectral fit using the pre-slew DRM will introduce some errors in both a spectral shape and a normalization if the PHA file contains a lot of the slew/post-slew time interval.
- 3) For fits to more complicated models (e.g. a power-law over a cutoff power-law), the BAT team has decided to require a chi-square improvement of more than 6 for each extra dof.
Time averaged spectrum fit using the average DRM
Power-law model

Time interval is from   -0.364 sec. to    0.796 sec.

Spectral model in power-law:
------------------------------------------------------------
Parameters  : value       lower 90%   higher 90%
Photon index: 1.50354     ( -0.289473   0.289525 )
Norm@50keV  : 1.29155E-02    ( -0.00205451   0.0020439 )
------------------------------------------------------------
#Fit statistic : Chi-Squared =          67.39 using 59 PHA bins.
# Reduced chi-squared =          1.182 for     57 degrees of freedom
# Null hypothesis probability =   1.633144e-01

Photon flux (15-150 keV)    in 1.16 sec: 1.61390 ( -0.2662  0.267313 ) ph/cm2/s
Energy fluence (15-150 keV)             : 1.42044e-07 ( -2.43221e-08  2.44569e-08 ) ergs/cm2
Cutoff power-law model

Time interval is from   -0.364 sec. to    0.796 sec.
Spectral model in the cutoff power-law:
------------------------------------------------------------
Parameters  : value       lower 90%   higher 90%
Photon index: 1.51920     ( -0.309131   0.275563 )
Epeak [keV] : 9999.36      ( -9999.36 -9999.36 )
Norm@50keV  : 1.28474E-02    ( -0.00204749   0.00871891 )
------------------------------------------------------------
#Fit statistic : Chi-Squared =          67.42 using 59 PHA bins.
# Reduced chi-squared =          1.204 for     56 degrees of freedom
# Null hypothesis probability =   1.411831e-01

Photon flux (15-150 keV)    in 1.16 sec: 1.62552 ( -0.28163  0.25768 ) ph/cm2/s
Energy fluence (15-150 keV)             : 1.41836e-07 ( -2.41002e-08  2.38276e-08 ) ergs/cm2
Band function

Time interval is from   -0.364 sec. to    0.796 sec.

Spectral model in the Band function:
------------------------------------------------------------
Parameters  : value       lower 90%   higher 90%
alpha       : 4.87822   ( -4.87822   -4.87822 )
beta        : -1.59753    ( -0.356754   0.324265 )
Epeak [keV] : 24.6754      ( -24.6754 6.61169 )
Norm@50keV   : 1224.27    ( -190.893   7.6226e+06 )
------------------------------------------------------------
#Fit statistic : Chi-Squared =          66.32 using 59 PHA bins.
# Reduced chi-squared =          1.206 for     55 degrees of freedom
# Null hypothesis probability =   1.409610e-01

Photon flux (15-150 keV)    in 1.16 sec:  (    ) ph/cm2/s
Energy fluence (15-150 keV)             : 0 ( 0  0 ) ergs/cm2
Single BB

Spectral model blackbody:
------------------------------------------------------------
Parameters  : value    Lower 90%  Upper 90%
kT [keV]    : 14.7933  (-4.58445  7.35734)
R^2/D10^2   : 0.179935  (-0.174871   0.490425)
(R is the radius in km and D10 is the distance to the source in units of 10 kpc)
------------------------------------------------------------
#Fit statistic : Chi-Squared =          90.95 using 59 PHA bins.
# Reduced chi-squared =          1.596 for     57 degrees of freedom
# Null hypothesis probability =   2.850851e-03

Energy  Fluence     90% Error
[keV]   [erg/cm2]   [erg/cm2]
15- 25  9.584e-09   3.452e-09
25- 50  3.759e-08   1.105e-08
50-150  5.564e-08   1.976e-08
15-150  1.028e-07   2.611e-08
Thermal bremsstrahlung (OTTB)
Spectral model: thermal bremsstrahlung
------------------------------------------------------------
Parameters  : value         Lower 90%    Upper 90%
kT [keV]    : 199.362       (-84.9278      -199.363)
Norm        : 6.59700       (-1.04125     1.04358)
------------------------------------------------------------
#Fit statistic : Chi-Squared =          69.21 using 59 PHA bins.
# Reduced chi-squared =          1.214 for     57 degrees of freedom
# Null hypothesis probability =   1.288490e-01

Energy  Fluence     90% Error
[keV]   [erg/cm2]   [erg/cm2]
15- 25  1.906e-08   1.086e-08
25- 50  3.666e-08   2.042e-08
50-150  8.039e-08   4.520e-08
15-150  1.361e-07   7.673e-08
Double BB
Spectral model: bbodyrad<1> + bbodyrad<2>
------------------------------------------------------------
Parameters  : value         Lower 90%    Upper 90%
kT1 [keV]   : 6.82278        (-1.57586      2.06355)
R1^2/D10^2  : 2.47624        (-1.57203      4.53307)
kT2 [keV]   : 49.0024        (-19.6593      -49.0024)
R2^2/D10^2  : 3.40127E-03    (-0.00314705   0.0115086)
------------------------------------------------------------
#Fit statistic : Chi-Squared =          61.67 using 59 PHA bins.
# Reduced chi-squared =          1.121 for     55 degrees of freedom
# Null hypothesis probability =   2.499490e-01

Energy  Fluence     90% Error
[keV]   [erg/cm2]   [erg/cm2]
15- 25  2.195e-08   1.210e-08
25- 50  3.478e-08   1.878e-08
50-150  9.464e-08   5.265e-08
15-150  1.514e-07   7.023e-08
Peak spectrum fit
Power-law model
Time interval is from   -0.208 sec. to    0.792 sec.

Spectral model in power-law:
------------------------------------------------------------
Parameters  : value       lower 90%   higher 90%
Photon index: 1.46916     ( -0.306643   0.305271 )
Norm@50keV  : 1.34529E-02    ( -0.00223013   0.00222174 )
------------------------------------------------------------
#Fit statistic : Chi-Squared =          56.84 using 59 PHA bins.
# Reduced chi-squared =         0.9973 for     57 degrees of freedom
# Null hypothesis probability =   4.809236e-01

Photon flux (15-150 keV)    in 1 sec: 1.66591 ( -0.288117  0.289472 ) ph/cm2/s
Energy fluence (15-150 keV)             : 1.2829e-07 ( -2.29968e-08  2.31268e-08 ) ergs/cm2
Cutoff power-law model
Time interval is from   -0.208 sec. to    0.792 sec.
Spectral model in the cutoff power-law:
------------------------------------------------------------
Parameters  : value       lower 90%   higher 90%
Photon index: 1.48332     ( -0.324387   0.292173 )
Epeak [keV] : 9999.34      ( -9999.36 -9999.36 )
Norm@50keV  : 1.34731E-02    ( -0.00222688   0.00954666 )
------------------------------------------------------------
#Fit statistic : Chi-Squared =          56.86 using 59 PHA bins.
# Reduced chi-squared =          1.015 for     56 degrees of freedom
# Null hypothesis probability =   4.426384e-01

Photon flux (15-150 keV)    in 1 sec: 1.67873 ( -0.30003  0.27914 ) ph/cm2/s
Energy fluence (15-150 keV)             : 1.28045e-07 ( -2.2633e-08  2.2399e-08 ) ergs/cm2
Band function

Time interval is from   -0.208 sec. to    0.792 sec.

Spectral model in the Band function:
------------------------------------------------------------
Parameters  : value       lower 90%   higher 90%
alpha       : 4.91640   ( -4.9164   -4.9164 )
beta        : -1.55643    ( -0.386112   0.339685 )
Epeak [keV] : 24.6883      ( -24.6883 6.90967 )
Norm@50keV   : 1313.49    ( -214.535   7.766e+06 )
------------------------------------------------------------
#Fit statistic : Chi-Squared =          55.95 using 59 PHA bins.
# Reduced chi-squared =          1.017 for     55 degrees of freedom
# Null hypothesis probability =   4.390547e-01

Photon flux (15-150 keV)    in 1 sec:  (    ) ph/cm2/s
Energy fluence (15-150 keV)             : 0 ( 0  0 ) ergs/cm2
Single BB
Spectral model blackbody:
------------------------------------------------------------
Parameters  : value    Lower 90%  Upper 90%
kT [keV]    : 15.6588  (-5.00781  8.05546)
R^2/D10^2   : 0.153197  (-0.149217   0.439862)
(R is the radius in km and D10 is the distance to the source in units of 10 kpc)
------------------------------------------------------------
#Fit statistic : Chi-Squared =          78.21 using 59 PHA bins.
# Reduced chi-squared =          1.372 for     57 degrees of freedom
# Null hypothesis probability =   3.262445e-02

Energy  Fluence     90% Error
[keV]   [erg/cm2]   [erg/cm2]
15- 25  7.803e-09   2.975e-09
25- 50  3.222e-08   9.270e-09
50-150  5.476e-08   1.925e-08
15-150  9.479e-08   2.643e-08
Thermal bremsstrahlung (OTTB)

Spectral model: thermal bremsstrahlung
------------------------------------------------------------
Parameters  : value         Lower 90%    Upper 90%
kT [keV]    : 199.363       (-83.1004      -199.363)
Norm        : 6.84103       (-1.13291     1.13291)
------------------------------------------------------------
#Fit statistic : Chi-Squared =          58.71 using 59 PHA bins.
# Reduced chi-squared =          1.030 for     57 degrees of freedom
# Null hypothesis probability =   4.124824e-01

Energy  Fluence     90% Error
[keV]   [erg/cm2]   [erg/cm2]
15- 25  1.704e-08   1.013e-08
25- 50  3.277e-08   1.844e-08
50-150  7.187e-08   4.073e-08
15-150  1.217e-07   6.880e-08
Double BB

Spectral model: bbodyrad<1> + bbodyrad<2>
------------------------------------------------------------
Parameters  : value         Lower 90%    Upper 90%
kT1 [keV]   : 6.87133        (-1.70377      2.28592)
R1^2/D10^2  : 2.44801        (-1.61896      3.04166)
kT2 [keV]   : 50.1637        (-20.8392      -50.1619)
R2^2/D10^2  : 3.41490E-03    (-0.00318612   0.0121837)
------------------------------------------------------------
#Fit statistic : Chi-Squared =          51.80 using 59 PHA bins.
# Reduced chi-squared =         0.9419 for     55 degrees of freedom
# Null hypothesis probability =   5.975477e-01

Energy  Fluence     90% Error
[keV]   [erg/cm2]   [erg/cm2]
15- 25  1.914e-08   1.083e-08
25- 50  3.082e-08   1.610e-08
50-150  8.669e-08   4.795e-08
15-150  1.366e-07   6.793e-08
Pre-slew spectrum (Pre-slew PHA with pre-slew DRM)
Power-law model

Spectral model in power-law:
------------------------------------------------------------
Parameters  : value       lower 90%   higher 90%
Photon index: 1.50354     ( -0.289473   0.289525 )
Norm@50keV  : 1.29155E-02    ( -0.00205451   0.0020439 )
------------------------------------------------------------
#Fit statistic : Chi-Squared =          67.39 using 59 PHA bins.
# Reduced chi-squared =          1.182 for     57 degrees of freedom
# Null hypothesis probability =   1.633144e-01

Photon flux (15-150 keV)    in 1.16 sec: 1.61390 ( -0.2662  0.267313 ) ph/cm2/s
Energy fluence (15-150 keV)             : 1.42044e-07 ( -2.43221e-08  2.44569e-08 ) ergs/cm2
Cutoff power-law model

Spectral model in the cutoff power-law:
------------------------------------------------------------
Parameters  : value       lower 90%   higher 90%
Photon index: 1.51920     ( -0.309131   0.275563 )
Epeak [keV] : 9999.36      ( -9999.36 -9999.36 )
Norm@50keV  : 1.28474E-02    ( -0.00204749   0.00871891 )
------------------------------------------------------------
#Fit statistic : Chi-Squared =          67.42 using 59 PHA bins.
# Reduced chi-squared =          1.204 for     56 degrees of freedom
# Null hypothesis probability =   1.411831e-01

Photon flux (15-150 keV)    in 1.16 sec: 1.62552 ( -0.28163  0.25768 ) ph/cm2/s
Energy fluence (15-150 keV)             : 1.41836e-07 ( -2.41002e-08  2.38276e-08 ) ergs/cm2
Band function
Spectral model in the Band function:
------------------------------------------------------------
Parameters  : value       lower 90%   higher 90%
alpha       : 4.87822   ( -4.87822   -4.87822 )
beta        : -1.59753    ( -0.356754   0.324265 )
Epeak [keV] : 24.6754      ( -24.6754 6.61169 )
Norm@50keV   : 1224.27    ( -190.893   7.6226e+06 )
------------------------------------------------------------
#Fit statistic : Chi-Squared =          66.32 using 59 PHA bins.
# Reduced chi-squared =          1.206 for     55 degrees of freedom
# Null hypothesis probability =   1.409610e-01

Photon flux (15-150 keV)    in 1.16 sec:  (    ) ph/cm2/s
Energy fluence (15-150 keV)             : 0 ( 0  0 ) ergs/cm2
S(25-50 keV) vs. S(50-100 keV) plot

S(25-50 keV)  = 3.52e-08
S(50-100 keV) = 4.96e-08
T90 vs. Hardness ratio plot
T90                                   = 1.01199996471405 sec.
Hardness ratio (energy fluence ratio) = 1.40909
Color vs. Color plot

Count Ratio  (25-50 keV) / (15-25 keV) = 0.895246
Count Ratio (50-100 keV) / (15-25 keV) = 0.82923
Mask shadow pattern
IMX = 1.054177635931437E+00, IMY = 2.755788578305471E-01
TIME vs. PHA plot around the trigger time
Blue+Cyan dotted lines: Time interval of the scaled map
From 0.000000 to 1.024000
TIME vs. DetID plot around the trigger time
Blue+Cyan dotted lines: Time interval of the scaled map
From 0.000000 to 1.024000
100 us light curve (15-350 keV)
Blue+Cyan dotted lines: Time interval of the scaled map
From 0.000000 to 1.024000
Spacecraft aspect plot

Bright source in the pre-burst/pre-slew/post-slew images
Pre-burst image of 15-350 keV band
Time interval of the image:
-239.920000 -0.364000

# RAcent  DECcent POSerr Theta    Phi  PeakCts   SNR AngSep     Name
#  [deg]    [deg]    ['] [deg]  [deg]                   [']
124.3890   3.6443    2.8  40.4   67.0   2.5276   4.1 ------	UNKNOWN
143.7577 -10.1489    4.2  33.2   28.6   0.6230   2.8 ------	UNKNOWN
163.1025  42.1210    2.8  25.4  171.1   0.7106   4.1 ------	UNKNOWN
216.2534  59.8671    3.3  57.4 -160.1   2.8886   3.5 ------	UNKNOWN
Pre-slew background subtracted image of 15-350 keV band
Time interval of the image:
-0.364000 0.796000

# RAcent  DECcent POSerr Theta    Phi  PeakCts   SNR AngSep     Name
#  [deg]    [deg]    ['] [deg]  [deg]                   [']
125.3233  30.6914    2.5  37.3  110.5   0.1205   4.5 ------	UNKNOWN
156.9944 -32.7443    2.4  49.9   -1.5   0.1185   4.7 ------	UNKNOWN
168.6199 -30.4130    1.0  47.5  -14.7   0.2511  11.6 ------	UNKNOWN
216.3456  62.3988    2.3  58.5 -162.8   0.2839   5.0 ------	UNKNOWN
Post-slew image of 15-350 keV band
Time interval of the image:
84.380590 850.680590

# RAcent  DECcent POSerr Theta    Phi  PeakCts   SNR AngSep     Name
#  [deg]    [deg]    ['] [deg]  [deg]                   [']
135.4862 -40.5738    2.3  28.6   31.6   2.8298   5.1    2.2	Vela X-1
170.3884 -60.7970   18.0  30.4  -30.2   0.3180   0.6   10.7	Cen X-3
186.6787 -62.7789    0.6  34.4  -43.0  10.0087  17.9    0.8	GX 301-2
 99.1702 -52.1340    3.5  54.2   16.7   8.3702   3.3 ------	UNKNOWN
123.4099 -58.7572    3.3  41.6    5.2   2.2411   3.6 ------	UNKNOWN
152.6216 -58.3417    2.1  30.0  -11.6   2.5677   5.4 ------	UNKNOWN
111.7145 -74.1780    3.2  52.0  -11.6   4.1899   3.6 ------	UNKNOWN
176.9814 -61.9745    2.3  32.0  -35.9   2.3622   5.0 ------	UNKNOWN
220.3736 -74.2808    3.8  50.8  -44.4   6.3457   3.0 ------	UNKNOWN
Plot creation:
Sat May 30 17:37:58 EDT 2015