Special notes of this burst
Image
Pre-slew 15.0-50.0 keV image (Event data)

#RAcent DECcent POSerr Theta  Phi  Peak_Cts  SNR Name
190.100 -50.594 0.000 46.761 -11.874 0.761 7.353 TRIG_00544347

Image time interval: 0.000 to 64.000 [sec]
Lightcurves
Notes:
- 1) The mask-weighted light curves are using the flight position.
- 2) Multiple plots of different time binning/intervals are shown to cover all scenarios of short/long GRBs, rate/image triggers, and real/false positives.
- 3) For all the mask-weighted lightcurves, the y-axis units are counts/sec/det where a det is 0.4 x 0.4 = 0.16 sq cm.
- 4) The verticle lines correspond to following: green dotted lines are T50 interval, black dotted lines are T90 interval, blue solid line(s) is a spacecraft slew start time, and orange solid line(s) is a spacecraft slew end time.
- 5) Time of each bin is in the middle of the bin.
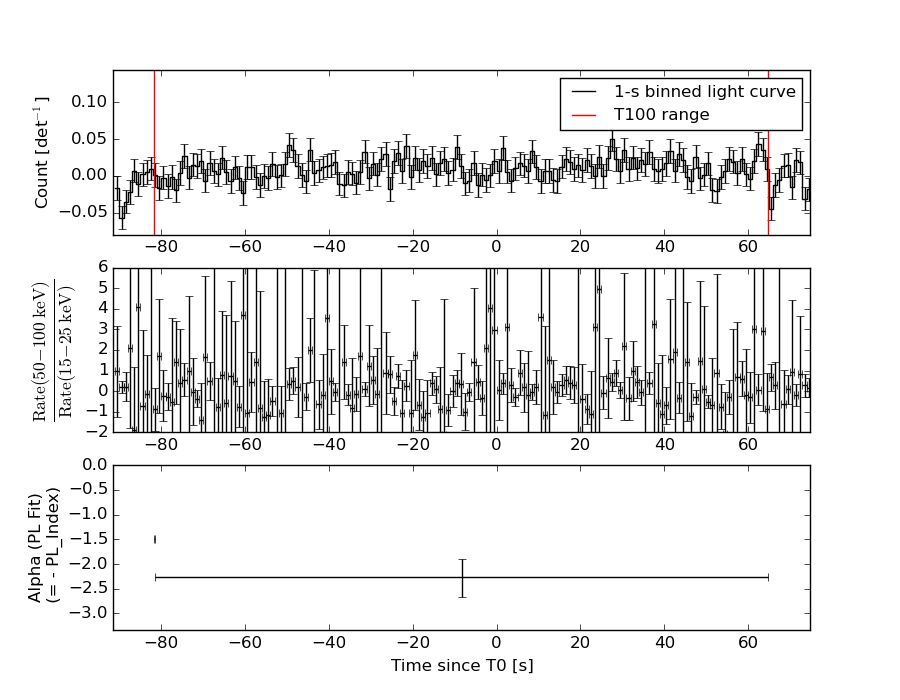
1 s binning
From T0-310 s to T0+310 s

From T100_start - 20 s to T100_end + 30 s

Full time interval
64 ms binning
Full time interval

From T100_start to T100_end

From T0-5 sec to T0+5 sec

16 ms binning
From T100_start-5 s to T100_start+5 s
Blue+Cyan dotted lines: Time interval of the scaled map
From 0.000000 to 64.000000
8 ms binning
From T100_start-3 s to T100_start+3 s

Blue+Cyan dotted lines: Time interval of the scaled map
From 0.000000 to 64.000000
2 ms binning
From T100_start-1 s to T100_start+1 s
Blue+Cyan dotted lines: Time interval of the scaled map
From 0.000000 to 64.000000
SN=5 or 10 sec. binning (whichever binning is satisfied first)
SN=5 or 10 sec. binning (T < 200 sec)

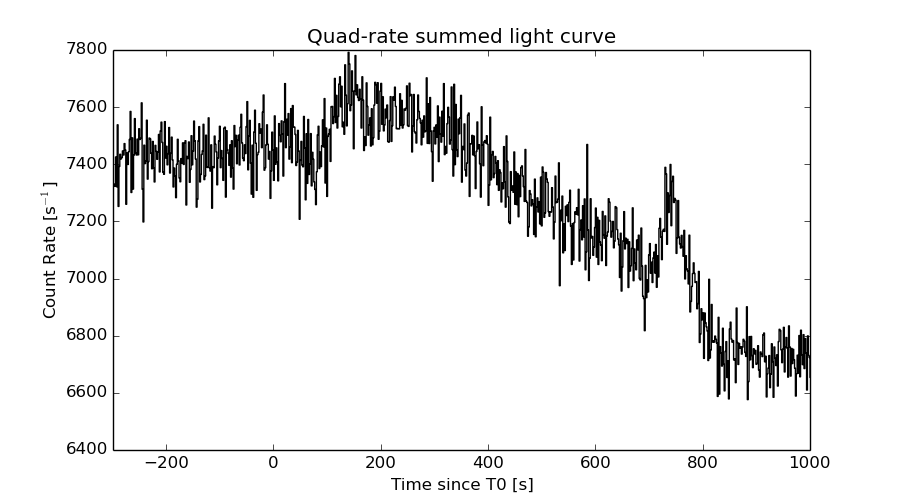
Quad-rate summed light curves (from T0-300s to T0+1000s)
Spectral Evolution
Spectra
Notes:
- 1) The fitting includes the systematic errors.
- 2) When the burst includes telescope slew time periods, the fitting uses an average response file made from multiple 5-s response files through out the slew time plus single time preiod for the non-slew times, and weighted by the total counts in the corresponding time period using addrmf. An average response file is needed becuase a spectral fit using the pre-slew DRM will introduce some errors in both a spectral shape and a normalization if the PHA file contains a lot of the slew/post-slew time interval.
- 3) For fits to more complicated models (e.g. a power-law over a cutoff power-law), the BAT team has decided to require a chi-square improvement of more than 6 for each extra dof.
Time averaged spectrum fit using the average DRM
Power-law model

Time interval is from  -81.668 sec. to   64.808 sec.

Spectral model in power-law:
------------------------------------------------------------
Parameters  : value       lower 90%   higher 90%
Photon index: 2.27276     ( -0.360417   0.417668 )
Norm@50keV  : 6.02974E-04    ( -0.000172336   0.000166365 )
------------------------------------------------------------
#Fit statistic : Chi-Squared =          59.98 using 59 PHA bins.
# Reduced chi-squared =          1.052 for     57 degrees of freedom
# Null hypothesis probability =   3.680674e-01

Photon flux (15-150 keV)    in 146.5 sec: 0.103802 ( -0.0200021  0.0200027 ) ph/cm2/s
Energy fluence (15-150 keV)             : 8.40057e-07 ( -1.94571e-07  2.03682e-07 ) ergs/cm2
Cutoff power-law model
Time interval is from  -81.668 sec. to   64.808 sec.
Spectral model in the cutoff power-law:
------------------------------------------------------------
Parameters  : value       lower 90%   higher 90%
Photon index: 1.31623     ( -2.38051   0.762889 )
Epeak [keV] : 27.5542      (   )
Norm@50keV  : 2.29966E-03    (     )
------------------------------------------------------------
#Fit statistic : Chi-Squared =          58.86 using 59 PHA bins.
# Reduced chi-squared =          1.051 for     56 degrees of freedom
# Null hypothesis probability =   3.712441e-01

Photon flux (15-150 keV)    in 146.5 sec: 0.101225 ( -0.0202567  0.020352 ) ph/cm2/s
Energy fluence (15-150 keV)             : 7.75539e-07 ( -1.98661e-07  2.25554e-07 ) ergs/cm2
Band function

Time interval is from  -81.668 sec. to   64.808 sec.

Spectral model in the Band function:
------------------------------------------------------------
Parameters  : value       lower 90%   higher 90%
alpha       : -0.493761   ( -1.93184   1.80084 )
beta        : -2.69748    ( 9.37167   19.3717 )
Epeak [keV] : 26.9961      ( -10.9006 26.7626 )
Norm@50keV   : 9.22879E-03    ( -0.00942681   131.67 )
------------------------------------------------------------
#Fit statistic : Chi-Squared =          58.75 using 59 PHA bins.
# Reduced chi-squared =          1.068 for     55 degrees of freedom
# Null hypothesis probability =   3.398710e-01

Photon flux (15-150 keV)    in 146.5 sec:  (    ) ph/cm2/s
Energy fluence (15-150 keV)             : 0 ( 0  0 ) ergs/cm2
Single BB

Spectral model blackbody:
------------------------------------------------------------
Parameters  : value    Lower 90%  Upper 90%
kT [keV]    : 8.07756  (-1.66808  2.17829)
R^2/D10^2   : 0.110177  (-0.0677487   0.170995)
(R is the radius in km and D10 is the distance to the source in units of 10 kpc)
------------------------------------------------------------
#Fit statistic : Chi-Squared =          62.53 using 59 PHA bins.
# Reduced chi-squared =          1.097 for     57 degrees of freedom
# Null hypothesis probability =   2.863749e-01

Energy  Fluence     90% Error
[keV]   [erg/cm2]   [erg/cm2]
15- 25  1.918e-07   7.527e-08
25- 50  3.413e-07   1.182e-07
50-150  9.250e-08   5.292e-08
15-150  6.256e-07   1.951e-07
Thermal bremsstrahlung (OTTB)

Spectral model: thermal bremsstrahlung
------------------------------------------------------------
Parameters  : value         Lower 90%    Upper 90%
kT [keV]    : 43.1154       (-16.7885      33.9175)
Norm        : 0.644657       (-0.194961     0.313927)
------------------------------------------------------------
#Fit statistic : Chi-Squared =          58.86 using 59 PHA bins.
# Reduced chi-squared =          1.033 for     57 degrees of freedom
# Null hypothesis probability =   4.073501e-01

Energy  Fluence     90% Error
[keV]   [erg/cm2]   [erg/cm2]
15- 25  2.221e-07   5.193e-08
25- 50  3.015e-07   9.310e-08
50-150  2.527e-07   1.409e-07
15-150  7.763e-07   2.713e-07
Double BB
Spectral model: bbodyrad<1> + bbodyrad<2>
------------------------------------------------------------
Parameters  : value         Lower 90%    Upper 90%
kT1 [keV]   : 5.71728        (-3.7867      2.59132)
R1^2/D10^2  : 0.328871        (-0.164525      52.2407)
kT2 [keV]   : 17.0214        (-15.2923      64.178)
R2^2/D10^2  : 3.22035E-03    (-0.00322976   0.0733709)
------------------------------------------------------------
#Fit statistic : Chi-Squared =          58.44 using 59 PHA bins.
# Reduced chi-squared =          1.063 for     55 degrees of freedom
# Null hypothesis probability =   3.503159e-01

Energy  Fluence     90% Error
[keV]   [erg/cm2]   [erg/cm2]
15- 25  2.224e-07   1.304e-07
25- 50  2.976e-07   1.559e-07
50-150  2.681e-07   1.616e-07
15-150  7.881e-07   3.937e-07
Peak spectrum fit
Power-law model

Time interval is from  -49.752 sec. to  -48.752 sec.

Spectral model in power-law:
------------------------------------------------------------
Parameters  : value       lower 90%   higher 90%
Photon index: 1.35264     ( -1.58497   1.07898 )
Norm@50keV  : 3.59194E-03    ( -0.00359188   0.00178758 )
------------------------------------------------------------
#Fit statistic : Chi-Squared =          56.87 using 59 PHA bins.
# Reduced chi-squared =         0.9976 for     57 degrees of freedom
# Null hypothesis probability =   4.800957e-01

Photon flux (15-150 keV)    in 1 sec: 0.432961 ( -0.432961  0.238389 ) ph/cm2/s
Energy fluence (15-150 keV)             : 3.50637e-08 ( -3.50637e-08  1.87778e-08 ) ergs/cm2
Cutoff power-law model

Time interval is from  -49.752 sec. to  -48.752 sec.
Spectral model in the cutoff power-law:
------------------------------------------------------------
Parameters  : value       lower 90%   higher 90%
Photon index: 1.39803     (     )
Epeak [keV] : 9999.36      (   )
Norm@50keV  : 3.60413E-03    (     )
------------------------------------------------------------
#Fit statistic : Chi-Squared =          56.88 using 59 PHA bins.
# Reduced chi-squared =          1.016 for     56 degrees of freedom
# Null hypothesis probability =   4.422373e-01

Photon flux (15-150 keV)    in 1 sec: 0.439355 ( -0.439355  0.228092 ) ph/cm2/s
Energy fluence (15-150 keV)             : 3.45755e-08 ( -1.80743e-08  1.86876e-08 ) ergs/cm2
Band function

Time interval is from  -49.752 sec. to  -48.752 sec.

Spectral model in the Band function:
------------------------------------------------------------
Parameters  : value       lower 90%   higher 90%
alpha       : 4.96769   ( -4.96769   -4.96769 )
beta        : -1.48130    ( -2.4575   1.67759 )
Epeak [keV] : 27.7831      ( -27.7831 71.9357 )
Norm@50keV   : 171.863    ( -85.0209   5.60496e+06 )
------------------------------------------------------------
#Fit statistic : Chi-Squared =          56.76 using 59 PHA bins.
# Reduced chi-squared =          1.032 for     55 degrees of freedom
# Null hypothesis probability =   4.092761e-01

Photon flux (15-150 keV)    in 1 sec:  (    ) ph/cm2/s
Energy fluence (15-150 keV)             : 0 ( 0  0 ) ergs/cm2
Single BB

Spectral model blackbody:
------------------------------------------------------------
Parameters  : value    Lower 90%  Upper 90%
kT [keV]    : 11.5854  (-11.6767  -11.6767)
R^2/D10^2   : 0.116300  (-0.110731   2.62372)
(R is the radius in km and D10 is the distance to the source in units of 10 kpc)
------------------------------------------------------------
#Fit statistic : Chi-Squared =          59.67 using 59 PHA bins.
# Reduced chi-squared =          1.047 for     57 degrees of freedom
# Null hypothesis probability =   3.790093e-01

Energy  Fluence     90% Error
[keV]   [erg/cm2]   [erg/cm2]
15- 25  3.289e-09   2.299e-09
25- 50  9.925e-09   6.345e-09
50-150  7.819e-09   7.065e-09
15-150  2.103e-08   1.543e-08
Thermal bremsstrahlung (OTTB)

Spectral model: thermal bremsstrahlung
------------------------------------------------------------
Parameters  : value         Lower 90%    Upper 90%
kT [keV]    : 199.363       (-199.363      -199.363)
Norm        : 1.80664       (-0.916372     1.55016)
------------------------------------------------------------
#Fit statistic : Chi-Squared =          57.30 using 59 PHA bins.
# Reduced chi-squared =          1.005 for     57 degrees of freedom
# Null hypothesis probability =   4.640123e-01

Energy  Fluence     90% Error
[keV]   [erg/cm2]   [erg/cm2]
15- 25  4.499e-09   3.114e-09
25- 50  8.654e-09   5.720e-09
50-150  1.898e-08   1.272e-08
15-150  3.213e-08   2.165e-08
Double BB
------------------------------------------------------------
Parameters  : value         Lower 90%    Upper 90%
kT1 [keV]   : 7.40696        (-4.20293      6.97457)
R1^2/D10^2  : 0.534453        (-0.412585      1.24617)
kT2 [keV]   : 198.566        (-198.572      -198.572)
R2^2/D10^2  : 9.11157E-05    (-6.3283e-05   0.00813751)
------------------------------------------------------------
#Fit statistic : Chi-Squared =          54.83 using 59 PHA bins.
#Fit statistic : Chi-Squared =          54.80 using 59 PHA bins.
# Reduced chi-squared =         0.9969 for     55 degrees of freedom
# Reduced chi-squared =         0.9964 for     55 degrees of freedom
# Null hypothesis probability =   4.810473e-01
# Null hypothesis probability =   4.821333e-01

Energy  Fluence     90% Error
[keV]   [erg/cm2]   [erg/cm2]
15- 25  4.740e-09   2.912e-09
25- 50  8.767e-09   5.360e-09
50-150  2.480e-08   6.895e-09
15-150  3.831e-08   1.266e-08
Pre-slew spectrum (Pre-slew PHA with pre-slew DRM)
Power-law model

Spectral model in power-law:
------------------------------------------------------------
Parameters  : value       lower 90%   higher 90%
Photon index: 2.27276     ( -0.360417   0.417668 )
Norm@50keV  : 6.02974E-04    ( -0.000172336   0.000166365 )
------------------------------------------------------------
#Fit statistic : Chi-Squared =          59.98 using 59 PHA bins.
# Reduced chi-squared =          1.052 for     57 degrees of freedom
# Null hypothesis probability =   3.680674e-01

Photon flux (15-150 keV)    in 146.5 sec: 0.103802 ( -0.0200021  0.0200027 ) ph/cm2/s
Energy fluence (15-150 keV)             : 8.40057e-07 ( -1.94571e-07  2.03682e-07 ) ergs/cm2
Cutoff power-law model

Spectral model in the cutoff power-law:
------------------------------------------------------------
Parameters  : value       lower 90%   higher 90%
Photon index: 1.31623     ( -2.38051   0.762889 )
Epeak [keV] : 27.5542      (   )
Norm@50keV  : 2.29966E-03    (     )
------------------------------------------------------------
#Fit statistic : Chi-Squared =          58.86 using 59 PHA bins.
# Reduced chi-squared =          1.051 for     56 degrees of freedom
# Null hypothesis probability =   3.712441e-01

Photon flux (15-150 keV)    in 146.5 sec: 0.101225 ( -0.0202567  0.020352 ) ph/cm2/s
Energy fluence (15-150 keV)             : 7.75539e-07 ( -1.98661e-07  2.25554e-07 ) ergs/cm2
Band function

Spectral model in the Band function:
------------------------------------------------------------
Parameters  : value       lower 90%   higher 90%
alpha       : -0.493761   ( -1.90502   1.80079 )
beta        : -2.69748    ( 9.37167   19.3717 )
Epeak [keV] : 26.9961      ( -10.9006 27.1276 )
Norm@50keV   : 9.22879E-03    ( -0.00942681   131.659 )
------------------------------------------------------------
#Fit statistic : Chi-Squared =          58.75 using 59 PHA bins.
# Reduced chi-squared =          1.068 for     55 degrees of freedom
# Null hypothesis probability =   3.398710e-01

Photon flux (15-150 keV)    in 146.5 sec:  (    ) ph/cm2/s
Energy fluence (15-150 keV)             : 0 ( 0  0 ) ergs/cm2
S(25-50 keV) vs. S(50-100 keV) plot

S(25-50 keV)  = 2.70e-07
S(50-100 keV) = 2.23e-07
T90 vs. Hardness ratio plot
T90                                   = 111.459999978542 sec.
Hardness ratio (energy fluence ratio) = 0.825926
Color vs. Color plot

Count Ratio  (25-50 keV) / (15-25 keV) = 1.04712
Count Ratio (50-100 keV) / (15-25 keV) = 0.435941
Mask shadow pattern

IMX = 1.04067554344, IMY = 0.218813653751
TIME vs. PHA plot around the trigger time
Blue+Cyan dotted lines: Time interval of the scaled map
From 0.000000 to 64.000000
TIME vs. DetID plot around the trigger time
Blue+Cyan dotted lines: Time interval of the scaled map
From 0.000000 to 64.000000
100 us light curve (15-350 keV)

Blue+Cyan dotted lines: Time interval of the scaled map
From 0.000000 to 64.000000
Spacecraft aspect plot

Bright source in the pre-burst/pre-slew/post-slew images
Pre-burst image of 15-350 keV band
Time interval of the image:
-239.000000 -81.668000

# RAcent  DECcent POSerr Theta    Phi  PeakCts   SNR AngSep     Name
#  [deg]    [deg]    ['] [deg]  [deg]                   [']
190.2549 -55.7770    2.7  51.9  -12.7   1.3468   4.2 ------	UNKNOWN
207.2234 -52.9096    3.1  50.0  -25.7   1.1644   3.7 ------	UNKNOWN
Pre-slew background subtracted image of 15-350 keV band
Time interval of the image:
-81.668000 64.808000

# RAcent  DECcent POSerr Theta    Phi  PeakCts   SNR AngSep     Name
#  [deg]    [deg]    ['] [deg]  [deg]                   [']
159.9629  15.9233    2.2  39.9  104.8   3.0019   5.1 ------	UNKNOWN
170.6407  -4.0121    2.8  24.2   73.1   0.8231   4.1 ------	UNKNOWN
191.4245  13.7812    2.8  18.1  153.1   0.6555   4.2 ------	UNKNOWN
181.6243 -41.6512    2.2  39.5   -0.4   1.1223   5.2 ------	UNKNOWN
Post-slew image of 15-350 keV band
Time interval of the image:
135.100600 696.600590

# RAcent  DECcent POSerr Theta    Phi  PeakCts   SNR AngSep     Name
#  [deg]    [deg]    ['] [deg]  [deg]                   [']
135.6297 -40.4453    9.8  38.6   69.6   1.3202   1.2    8.0	Vela X-1
170.2159 -60.4193  108.8  14.8   27.0  -0.0335  -0.1   12.6	Cen X-3
186.8366 -62.7413    1.7  12.3   -6.9   2.2936   6.7    5.2	GX 301-2
189.6647 -11.6281    2.7  39.0  165.4   2.2529   4.4 ------	UNKNOWN
194.2606 -54.8874    3.5   5.0  -42.8   1.0349   3.3 ------	UNKNOWN
210.9862 -52.5695    2.4  13.1  -87.2   1.5028   4.9 ------	UNKNOWN
356.7008 -70.3188    3.9  58.7  -19.2   5.7396   3.0 ------	UNKNOWN
296.2785 -65.8617    3.4  50.7  -44.4   5.7534   3.4 ------	UNKNOWN
Plot creation:
Thu Oct  8 20:16:03 EDT 2015