Click here for the BAT GCN circular template
Image
Pre-slew 15.0-350.0 keV image (Event data)

#   RAcent    DECcent   POSerr    Theta     Phi              Peak Cts       SNR   Name
  194.2387    59.0135   0.0167    21.4740  -140.8054         0.9834746     11.468 TRIG_00546731

Foreground time interval of the image:
  0.192  57.117 (delta_t =  56.925 [sec])
Background time interval of the image:
-239.584   0.192 (delta_t = 239.776 [sec])
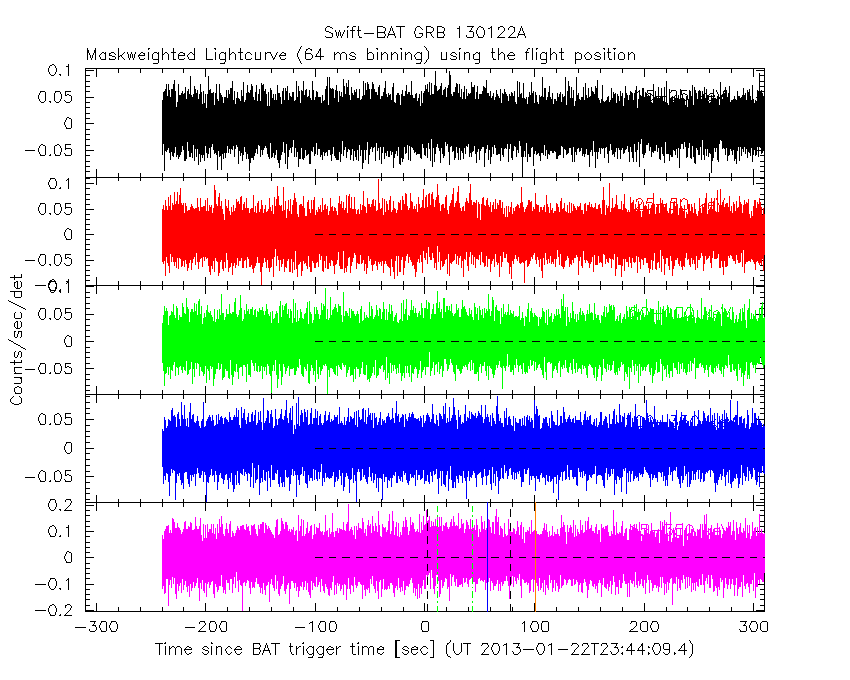
Lightcurves
Notes:
- 1) The mask-weighted light curves are using the flight position.
- 2) Multiple plots of different time binning/intervals are shown to cover all scenarios of short/long GRBs, rate/image triggers, and real/false positives.
- 3) For all the mask-weighted lightcurves, the y-axis units are counts/sec/det where a det is 0.4 x 0.4 = 0.16 sq cm.
- 4) The verticle lines correspond to following: green dotted lines are T50 interval, black dotted lines are T90 interval, blue solid line(s) is a spacecraft slew start time, and orange solid line(s) is a spacecraft slew end time.
- 5) Time of each bin is in the middle of the bin.
1 s binning
From T0-310 s to T0+310 s

From T100_start - 20 s to T100_end + 30 s

Full time interval

64 ms binning
Full time interval
From T100_start to T100_end

From T0-5 sec to T0+5 sec

16 ms binning
From T100_start-5 s to T100_start+5 s

Blue+Cyan dotted lines: Time interval of the scaled map
From 0.000000 to 12.160000
8 ms binning
From T100_start-3 s to T100_start+3 s

Blue+Cyan dotted lines: Time interval of the scaled map
From 0.000000 to 12.160000
2 ms binning
From T100_start-1 s to T100_start+1 s
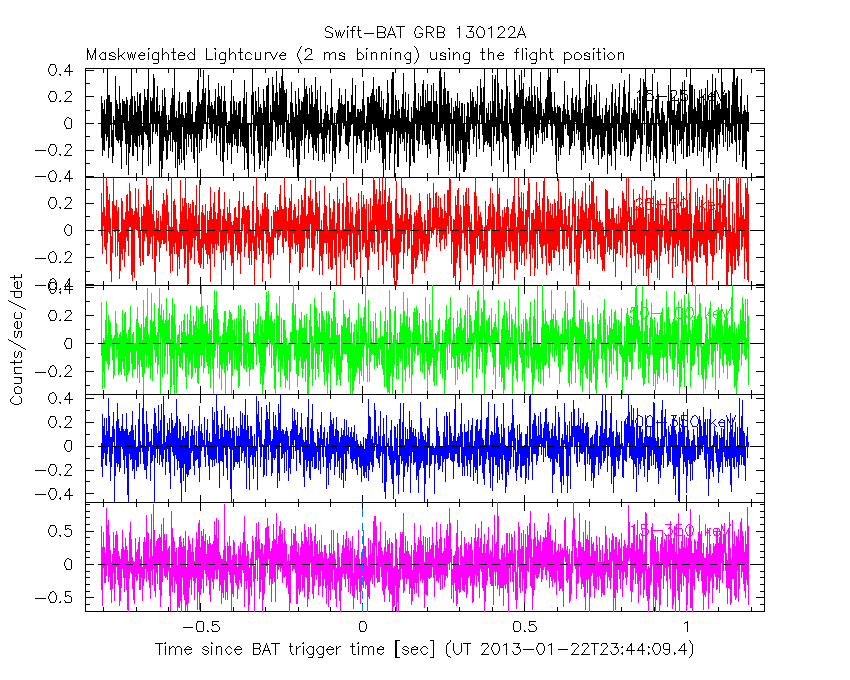
Blue+Cyan dotted lines: Time interval of the scaled map
From 0.000000 to 12.160000
SN=5 or 10 sec. binning (whichever binning is satisfied first)

SN=5 or 10 sec. binning (T < 200 sec)

Quad-rate summed light curves (from T0-300s to T0+1000s)

Spectral Evolution

Spectra
Notes:
- 1) The fitting includes the systematic errors.
- 2) When the burst includes telescope slew time periods, the fitting uses an average response file made from multiple 5-s response files through out the slew time plus single time preiod for the non-slew times, and weighted by the total counts in the corresponding time period using addrmf. An average response file is needed becuase a spectral fit using the pre-slew DRM will introduce some errors in both a spectral shape and a normalization if the PHA file contains a lot of the slew/post-slew time interval.
- 3) For fits to more complicated models (e.g. a power-law over a cutoff power-law), the BAT team has decided to require a chi-square improvement of more than 6 for each extra dof.
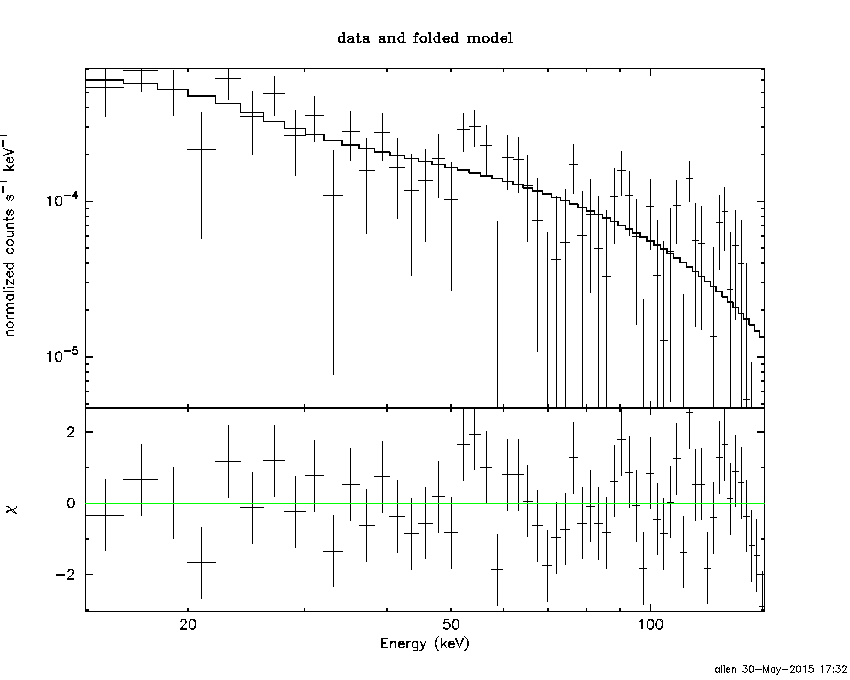
Time averaged spectrum fit using the average DRM
Power-law model

Time interval is from    0.192 sec. to   89.280 sec.

Spectral model in power-law:
------------------------------------------------------------
Parameters  : value       lower 90%   higher 90%
Photon index: 1.16667     ( -0.24401   0.239031 )
Norm@50keV  : 9.14650E-04    ( -0.000112194   0.000112194 )
------------------------------------------------------------
#Fit statistic : Chi-Squared =          79.06 using 59 PHA bins.
# Reduced chi-squared =          1.387 for     57 degrees of freedom
# Null hypothesis probability =   2.820375e-02

Photon flux (15-150 keV)    in 89.09 sec: 0.106885 ( -0.0134733  0.0135308 ) ph/cm2/s
Energy fluence (15-150 keV)             : 8.34688e-07 ( -1.17243e-07  1.18704e-07 ) ergs/cm2
Cutoff power-law model

Time interval is from    0.192 sec. to   89.280 sec.
Spectral model in the cutoff power-law:
------------------------------------------------------------
Parameters  : value       lower 90%   higher 90%
Photon index: 2.85826     ( -0.136432   0.231508 )
Epeak [keV] : 250.274      ( -9999.36 -9999.36 )
Norm@50keV  : 1.15738E-04    (     )
------------------------------------------------------------
#Fit statistic : Chi-Squared =          77.23 using 59 PHA bins.
# Reduced chi-squared =          1.379 for     56 degrees of freedom
# Null hypothesis probability =   3.153284e-02

Photon flux (15-150 keV)    in 89.09 sec: 0.107098 ( -0.0136649  0.01329 ) ph/cm2/s
Energy fluence (15-150 keV)             : 8.35355e-07 ( -1.17698e-07  1.14122e-07 ) ergs/cm2
Band function

Time interval is from    0.192 sec. to   89.280 sec.

Spectral model in the Band function:
------------------------------------------------------------
Parameters  : value       lower 90%   higher 90%
alpha       : -0.952735   ( 0.952735   0.952735 )
beta        : -1.16666    ( -0.238849   0.244287 )
Epeak [keV] : 50.6874      ( -50.6874 -50.6874 )
Norm@50keV   : 1.58656E-03    ( -0.000673527   52890.3 )
------------------------------------------------------------
#Fit statistic : Chi-Squared =          79.06 using 59 PHA bins.
# Reduced chi-squared =          1.437 for     55 degrees of freedom
# Null hypothesis probability =   1.844911e-02

Photon flux (15-150 keV)    in 89.09 sec:  (    ) ph/cm2/s
Energy fluence (15-150 keV)             : 0 ( 0  0 ) ergs/cm2
Single BB

Spectral model blackbody:
------------------------------------------------------------
Parameters  : value    Lower 90%  Upper 90%
kT [keV]    : 20.8894  (-3.79113  5.05455)
R^2/D10^2   : 4.14726E-03  (-0.0020227   0.00374444)
(R is the radius in km and D10 is the distance to the source in units of 10 kpc)
------------------------------------------------------------
#Fit statistic : Chi-Squared =          99.66 using 59 PHA bins.
# Reduced chi-squared =          1.748 for     57 degrees of freedom
# Null hypothesis probability =   4.078767e-04

Energy  Fluence     90% Error
[keV]   [erg/cm2]   [erg/cm2]
15- 25  3.053e-08   8.896e-09
25- 50  1.564e-07   3.020e-08
50-150  5.085e-07   1.170e-07
15-150  6.954e-07   1.351e-07
Thermal bremsstrahlung (OTTB)

Spectral model: thermal bremsstrahlung
------------------------------------------------------------
Parameters  : value         Lower 90%    Upper 90%
kT [keV]    : 200.000       (      )
Norm        : 0.438257       (-0.0551337     0.0551279)
------------------------------------------------------------
#Fit statistic : Chi-Squared =          87.74 using 59 PHA bins.
# Reduced chi-squared =          1.539 for     57 degrees of freedom
# Null hypothesis probability =   5.523250e-03

Energy  Fluence     90% Error
[keV]   [erg/cm2]   [erg/cm2]
15- 25  9.722e-08   5.412e-08
25- 50  1.870e-07   1.043e-07
50-150  4.102e-07   2.258e-07
15-150  6.944e-07   3.815e-07
Double BB

Spectral model: bbodyrad<1> + bbodyrad<2>
------------------------------------------------------------
Parameters  : value         Lower 90%    Upper 90%
kT1 [keV]   : 5.23581        (-2.18112      3.74994)
R1^2/D10^2  : 0.291937        (-0.247769      1.80041)
kT2 [keV]   : 31.3733        (-8.34328      25.3639)
R2^2/D10^2  : 1.08015E-03    (-0.000863428   0.00112196)
------------------------------------------------------------
#Fit statistic : Chi-Squared =          78.86 using 59 PHA bins.
# Reduced chi-squared =          1.434 for     55 degrees of freedom
# Null hypothesis probability =   1.912462e-02

Energy  Fluence     90% Error
[keV]   [erg/cm2]   [erg/cm2]
15- 25  9.020e-08   4.867e-08
25- 50  1.459e-07   5.637e-08
50-150  6.203e-07   2.976e-07
15-150  8.563e-07   3.397e-07
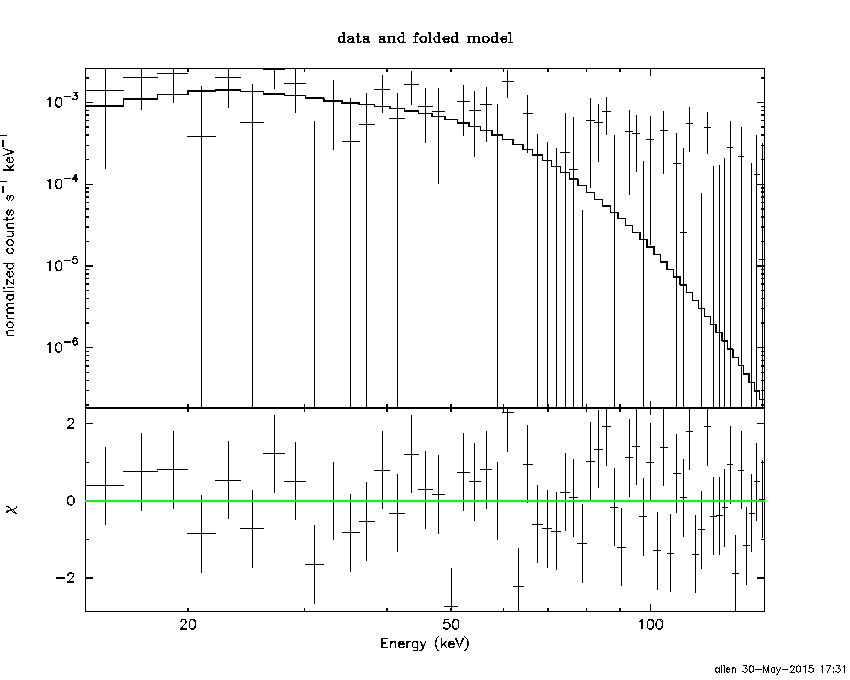
Peak spectrum fit
Power-law model

Time interval is from   10.852 sec. to   11.852 sec.

Spectral model in power-law:
------------------------------------------------------------
Parameters  : value       lower 90%   higher 90%
Photon index: 1.70281     ( -0.509971   0.573132 )
Norm@50keV  : 3.29334E-03    ( -0.00118352   0.00112283 )
------------------------------------------------------------
#Fit statistic : Chi-Squared =          67.50 using 59 PHA bins.
# Reduced chi-squared =          1.184 for     57 degrees of freedom
# Null hypothesis probability =   1.610657e-01

Photon flux (15-150 keV)    in 1 sec: 0.437823 ( -0.129932  0.129932 ) ph/cm2/s
Energy fluence (15-150 keV)             : 3.04852e-08 ( -1.08907e-08  1.15508e-08 ) ergs/cm2
Cutoff power-law model

Time interval is from   10.852 sec. to   11.852 sec.
Spectral model in the cutoff power-law:
------------------------------------------------------------
Parameters  : value       lower 90%   higher 90%
Photon index: 0.848537     ( -3.77638   1.35776 )
Epeak [keV] : 58.7239      (   )
Norm@50keV  : 9.98558E-03    (     )
------------------------------------------------------------
#Fit statistic : Chi-Squared =          67.03 using 59 PHA bins.
# Reduced chi-squared =          1.197 for     56 degrees of freedom
# Null hypothesis probability =   1.486060e-01

Photon flux (15-150 keV)    in 1 sec: 0.426191 ( -0.132786  0.13292 ) ph/cm2/s
Energy fluence (15-150 keV)             : 2.80717e-08 ( -1.10713e-08  1.29173e-08 ) ergs/cm2
Band function

Time interval is from   10.852 sec. to   11.852 sec.

Spectral model in the Band function:
------------------------------------------------------------
Parameters  : value       lower 90%   higher 90%
alpha       : -0.946671   ( -1.05619   4.6319 )
beta        : -9.37167    ( 9.37167   19.3717 )
Epeak [keV] : 61.5861      ( -32.5252 -61.574 )
Norm@50keV   : 8.72077E-03    ( -0.00872344   0.0286756 )
------------------------------------------------------------
#Fit statistic : Chi-Squared =          67.03 using 59 PHA bins.
# Reduced chi-squared =          1.219 for     55 degrees of freedom
# Null hypothesis probability =   1.281177e-01

Photon flux (15-150 keV)    in 1 sec: 0.432525 (    ) ph/cm2/s
Energy fluence (15-150 keV)             : 2.84e-08 ( 0  0 ) ergs/cm2
Single BB
Spectral model blackbody:
------------------------------------------------------------
Parameters  : value    Lower 90%  Upper 90%
kT [keV]    : 11.6326  (-3.39564  5.22639)
R^2/D10^2   : 0.123211  (-0.123257   0.306936)
(R is the radius in km and D10 is the distance to the source in units of 10 kpc)
------------------------------------------------------------
#Fit statistic : Chi-Squared =          68.49 using 59 PHA bins.
# Reduced chi-squared =          1.202 for     57 degrees of freedom
# Null hypothesis probability =   1.416615e-01

Energy  Fluence     90% Error
[keV]   [erg/cm2]   [erg/cm2]
15- 25  3.515e-09   2.184e-09
25- 50  1.066e-08   6.535e-09
50-150  8.489e-09   5.825e-09
15-150  2.266e-08   1.401e-08
Thermal bremsstrahlung (OTTB)

Spectral model: thermal bremsstrahlung
------------------------------------------------------------
Parameters  : value         Lower 90%    Upper 90%
kT [keV]    : 121.301       (-77.3163      -118.394)
Norm        : 1.86740       (-0.600905     0.975921)
------------------------------------------------------------
#Fit statistic : Chi-Squared =          67.14 using 59 PHA bins.
# Reduced chi-squared =          1.178 for     57 degrees of freedom
# Null hypothesis probability =   1.685416e-01

Energy  Fluence     90% Error
[keV]   [erg/cm2]   [erg/cm2]
15- 25  4.862e-09   2.861e-09
25- 50  8.714e-09   5.265e-09
50-150  1.563e-08   1.162e-08
15-150  2.921e-08   1.890e-08
Double BB

Spectral model: bbodyrad<1> + bbodyrad<2>
------------------------------------------------------------
Parameters  : value         Lower 90%    Upper 90%
kT1 [keV]   : 4.38761        (-4.40475      -4.40475)
R1^2/D10^2  : 2.04459        (-1.99408      -1.99408)
kT2 [keV]   : 15.3348        (-6.38139      -15.3907)
R2^2/D10^2  : 3.84211E-02    (-0.0377198   0.264402)
------------------------------------------------------------
#Fit statistic : Chi-Squared =          67.20 using 59 PHA bins.
# Reduced chi-squared =          1.222 for     55 degrees of freedom
# Null hypothesis probability =   1.252065e-01

Energy  Fluence     90% Error
[keV]   [erg/cm2]   [erg/cm2]
15- 25  4.745e-09   2.341e-09
25- 50  8.973e-09   5.460e-09
50-150  1.237e-08   8.180e-09
15-150  2.609e-08   1.434e-08
Pre-slew spectrum (Pre-slew PHA with pre-slew DRM)
Power-law model

Spectral model in power-law:
------------------------------------------------------------
Parameters  : value       lower 90%   higher 90%
Photon index: 1.38574     ( -0.239271   0.240404 )
Norm@50keV  : 1.16658E-03    ( -0.000147476   0.000145968 )
------------------------------------------------------------
#Fit statistic : Chi-Squared =          75.48 using 59 PHA bins.
# Reduced chi-squared =          1.324 for     57 degrees of freedom
# Null hypothesis probability =   5.115209e-02

Photon flux (15-150 keV)    in 56.92 sec: 0.141615 ( -0.0174724  0.0175046 ) ph/cm2/s
Energy fluence (15-150 keV)             : 6.4352e-07 ( -9.32452e-08  9.48606e-08 ) ergs/cm2
Cutoff power-law model
Spectral model in the cutoff power-law:
------------------------------------------------------------
Parameters  : value       lower 90%   higher 90%
Photon index: 2.71165     ( -0.400459   0.230797 )
Epeak [keV] : 220.245      ( -9999.36 -9999.36 )
Norm@50keV  : 2.44502E-04    (     )
------------------------------------------------------------
#Fit statistic : Chi-Squared =          72.85 using 59 PHA bins.
# Reduced chi-squared =          1.301 for     56 degrees of freedom
# Null hypothesis probability =   6.456051e-02

Photon flux (15-150 keV)    in 56.92 sec: 0.141866 ( -0.008853  0.01727 ) ph/cm2/s
Energy fluence (15-150 keV)             : 6.45461e-07 ( -9.53057e-08  8.83569e-08 ) ergs/cm2
Band function

Spectral model in the Band function:
------------------------------------------------------------
Parameters  : value       lower 90%   higher 90%
alpha       : -1.12942   ( 1.12942   1.12942 )
beta        : -1.38570    ( 1.3857   0.239228 )
Epeak [keV] : 32.3739      ( -32.3739 -32.3739 )
Norm@50keV   : 2.30519E-03    ( -0.00128079   0.0262372 )
------------------------------------------------------------
#Fit statistic : Chi-Squared =          75.48 using 59 PHA bins.
# Reduced chi-squared =          1.372 for     55 degrees of freedom
# Null hypothesis probability =   3.481863e-02

Photon flux (15-150 keV)    in 56.92 sec:  (    ) ph/cm2/s
Energy fluence (15-150 keV)             : 0 ( 0  0 ) ergs/cm2
S(25-50 keV) vs. S(50-100 keV) plot

S(25-50 keV)  = 1.72e-07
S(50-100 keV) = 3.06e-07
T90 vs. Hardness ratio plot

T90                                   = 76.5440000295639 sec.
Hardness ratio (energy fluence ratio) = 1.77907
Color vs. Color plot

Count Ratio  (25-50 keV) / (15-25 keV) = 1.21168
Count Ratio (50-100 keV) / (15-25 keV) = 1.45939
Mask shadow pattern

IMX = -3.048755972089129E-01, IMY = 2.486025731066294E-01
TIME vs. PHA plot around the trigger time

Blue+Cyan dotted lines: Time interval of the scaled map
From 0.000000 to 12.160000
TIME vs. DetID plot around the trigger time

Blue+Cyan dotted lines: Time interval of the scaled map
From 0.000000 to 12.160000
100 us light curve (15-350 keV)
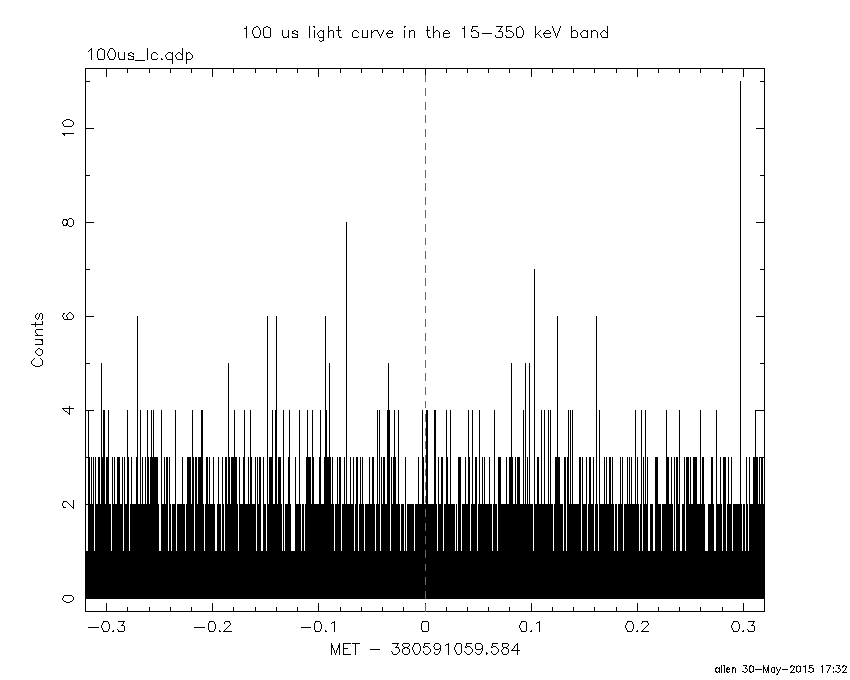
Blue+Cyan dotted lines: Time interval of the scaled map
From 0.000000 to 12.160000
Spacecraft aspect plot

Bright source in the pre-burst/pre-slew/post-slew images
Pre-burst image of 15-350 keV band
Time interval of the image:
-239.584000 0.192000

# RAcent  DECcent POSerr Theta    Phi  PeakCts   SNR AngSep     Name
#  [deg]    [deg]    ['] [deg]  [deg]                   [']
171.0049  22.4459    2.8  18.8   31.0   0.7265   4.1 ------	UNKNOWN
325.1058  80.8847    2.8  57.3 -160.1   3.8716   4.1 ------	UNKNOWN
218.5698   6.1148    2.8  50.8  -44.6   4.3880   4.1 ------	UNKNOWN
Pre-slew background subtracted image of 15-350 keV band
Time interval of the image:
0.192000 57.116600

# RAcent  DECcent POSerr Theta    Phi  PeakCts   SNR AngSep     Name
#  [deg]    [deg]    ['] [deg]  [deg]                   [']
149.3035  38.1036    2.4  21.3  106.5   0.5065   4.9 ------	UNKNOWN
183.0109   3.0342    2.1  38.0    4.0   0.6513   5.5 ------	UNKNOWN
188.0817  19.2218    2.2  23.4  -13.6   0.4367   5.2 ------	UNKNOWN
194.2387  59.0135    1.0  21.5 -140.8   0.9835  11.5 ------	UNKNOWN
Post-slew image of 15-350 keV band
Time interval of the image:
100.716600 658.416600

# RAcent  DECcent POSerr Theta    Phi  PeakCts   SNR AngSep     Name
#  [deg]    [deg]    ['] [deg]  [deg]                   [']
146.2622  34.7103    2.0  39.5   81.7   7.9602   5.6 ------	UNKNOWN
 92.3526  66.7958    2.4  41.7  152.6   3.2735   4.7 ------	UNKNOWN
 36.3611  65.6343    4.0  54.3  177.0   3.6971   2.9 ------	UNKNOWN
 31.0675  63.4191    3.2  56.9  179.1   7.6069   3.6 ------	UNKNOWN
212.9313   4.7833    4.0  56.1  -14.6   3.7946   2.9 ------	UNKNOWN
234.2710  17.4584    5.0  50.7  -44.5   4.3829   2.4 ------	UNKNOWN
263.9512  47.7286    5.6  41.0  -98.0   3.8004   2.1 ------	UNKNOWN
Plot creation:
Sat May 30 17:32:32 EDT 2015