Special notes of this burst
Image
Pre-slew 15.0-350.0 keV image (Event data)
#   RAcent    DECcent   POSerr    Theta     Phi              Peak Cts       SNR   Name
  173.9579    15.0314   0.0136    33.1253    28.1078         0.4901496     14.093 TRIG_00547420

Foreground time interval of the image:
 -0.280   4.368 (delta_t =   4.648 [sec])
Background time interval of the image:
-239.072  -0.280 (delta_t = 238.792 [sec])
Lightcurves
Notes:
- 1) The mask-weighted light curves are using the flight position.
- 2) Multiple plots of different time binning/intervals are shown to cover all scenarios of short/long GRBs, rate/image triggers, and real/false positives.
- 3) For all the mask-weighted lightcurves, the y-axis units are counts/sec/det where a det is 0.4 x 0.4 = 0.16 sq cm.
- 4) The verticle lines correspond to following: green dotted lines are T50 interval, black dotted lines are T90 interval, blue solid line(s) is a spacecraft slew start time, and orange solid line(s) is a spacecraft slew end time.
- 5) Time of each bin is in the middle of the bin.
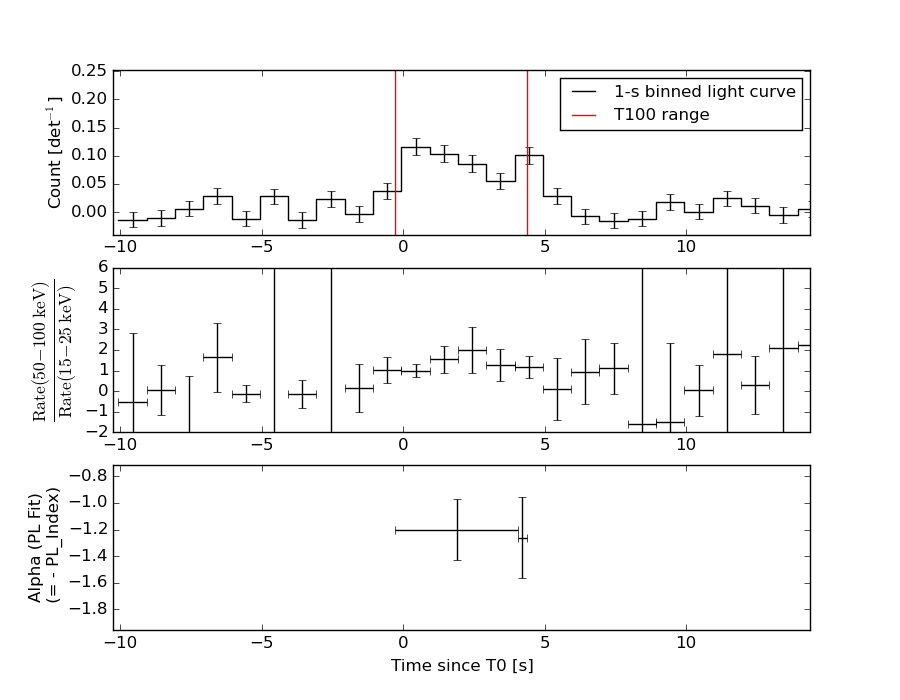
1 s binning
From T0-310 s to T0+310 s
From T100_start - 20 s to T100_end + 30 s
Full time interval

64 ms binning
Full time interval
From T100_start to T100_end

From T0-5 sec to T0+5 sec
16 ms binning
From T100_start-5 s to T100_start+5 s

Blue+Cyan dotted lines: Time interval of the scaled map
From 0.000000 to 2.048000
8 ms binning
From T100_start-3 s to T100_start+3 s

Blue+Cyan dotted lines: Time interval of the scaled map
From 0.000000 to 2.048000
2 ms binning
From T100_start-1 s to T100_start+1 s

Blue+Cyan dotted lines: Time interval of the scaled map
From 0.000000 to 2.048000
SN=5 or 10 sec. binning (whichever binning is satisfied first)
SN=5 or 10 sec. binning (T < 200 sec)

Quad-rate summed light curves (from T0-300s to T0+1000s)
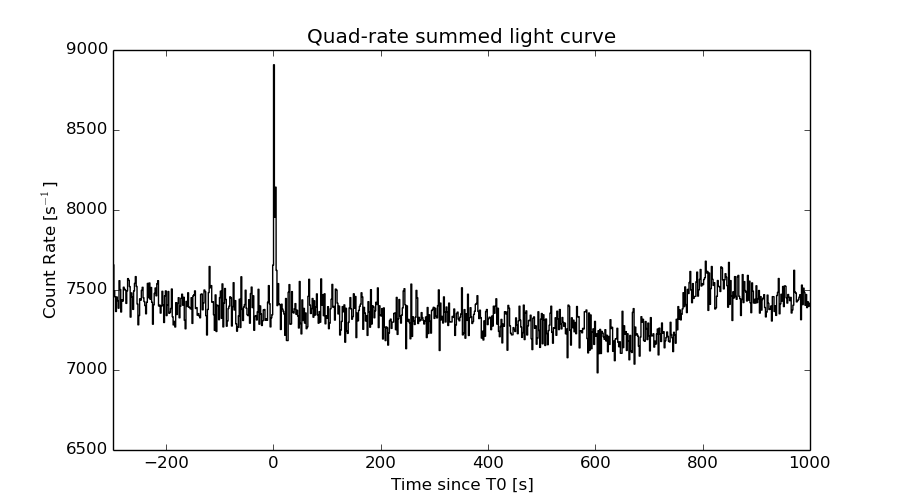
The mask-weighted light curves based on cleaned DPHs

Spectral Evolution
Spectra
Notes:
- 1) The fitting includes the systematic errors.
- 2) When the burst includes telescope slew time periods, the fitting uses an average response file made from multiple 5-s response files through out the slew time plus single time preiod for the non-slew times, and weighted by the total counts in the corresponding time period using addrmf. An average response file is needed becuase a spectral fit using the pre-slew DRM will introduce some errors in both a spectral shape and a normalization if the PHA file contains a lot of the slew/post-slew time interval.
- 3) For fits to more complicated models (e.g. a power-law over a cutoff power-law), the BAT team has decided to require a chi-square improvement of more than 6 for each extra dof.
Time averaged spectrum fit using the average DRM
Power-law model
Time interval is from   -0.280 sec. to    4.368 sec.

Spectral model in power-law:
------------------------------------------------------------
Parameters  : value       lower 90%   higher 90%
Photon index: 1.14808     ( -0.206772   0.20185 )
Norm@50keV  : 7.06300E-03    ( -0.000776536   0.000774146 )
------------------------------------------------------------
#Fit statistic : Chi-Squared =          54.19 using 59 PHA bins.
# Reduced chi-squared =         0.9507 for     57 degrees of freedom
# Null hypothesis probability =   5.810726e-01

Photon flux (15-150 keV)    in 4.648 sec: 0.823492 ( -0.0941589  0.0944548 ) ph/cm2/s
Energy fluence (15-150 keV)             : 3.38152e-07 ( -4.05059e-08  4.07197e-08 ) ergs/cm2
Cutoff power-law model

Time interval is from   -0.280 sec. to    4.368 sec.
Spectral model in the cutoff power-law:
------------------------------------------------------------
Parameters  : value       lower 90%   higher 90%
Photon index: 1.14334     ( -0.53136   0.255735 )
Epeak [keV] : 1.00000E+04      (   )
Norm@50keV  : 7.09869E-03    (     )
------------------------------------------------------------
#Fit statistic : Chi-Squared =          54.21 using 59 PHA bins.
# Reduced chi-squared =         0.9680 for     56 degrees of freedom
# Null hypothesis probability =   5.430444e-01

Photon flux (15-150 keV)    in 4.648 sec: 0.823534 ( -0.094342  0.094068 ) ph/cm2/s
Energy fluence (15-150 keV)             : 3.37237e-07 ( -3.964e-08  4.13291e-08 ) ergs/cm2
Band function

Time interval is from   -0.280 sec. to    4.368 sec.

Spectral model in the Band function:
------------------------------------------------------------
Parameters  : value       lower 90%   higher 90%
alpha       : -0.917771   ( 0.917771   0.917771 )
beta        : -1.14804    ( 1.14804   0.206921 )
Epeak [keV] : 54.0495      ( -54.0494 -54.0494 )
Norm@50keV   : 1.24728E-02    ( -0.00617741   1.05286 )
------------------------------------------------------------
#Fit statistic : Chi-Squared =          54.19 using 59 PHA bins.
# Reduced chi-squared =         0.9853 for     55 degrees of freedom
# Null hypothesis probability =   5.054541e-01

Photon flux (15-150 keV)    in 4.648 sec:  (    ) ph/cm2/s
Energy fluence (15-150 keV)             : 0 ( 0  0 ) ergs/cm2
Single BB
Spectral model blackbody:
------------------------------------------------------------
Parameters  : value    Lower 90%  Upper 90%
kT [keV]    : 20.6905  (-3.11711  3.95892)
R^2/D10^2   : 3.35664E-02  (-0.0144528   0.0237259)
(R is the radius in km and D10 is the distance to the source in units of 10 kpc)
------------------------------------------------------------
#Fit statistic : Chi-Squared =          75.69 using 59 PHA bins.
# Reduced chi-squared =          1.328 for     57 degrees of freedom
# Null hypothesis probability =   4.944297e-02

Energy  Fluence     90% Error
[keV]   [erg/cm2]   [erg/cm2]
15- 25  1.270e-08   2.868e-09
25- 50  6.466e-08   1.153e-08
50-150  2.060e-07   4.137e-08
15-150  2.834e-07   4.351e-08
Thermal bremsstrahlung (OTTB)

Spectral model: thermal bremsstrahlung
------------------------------------------------------------
Parameters  : value         Lower 90%    Upper 90%
kT [keV]    : 200.000       (      )
Norm        : 3.42795       (-0.384834     0.384797)
------------------------------------------------------------
#Fit statistic : Chi-Squared =          66.55 using 59 PHA bins.
# Reduced chi-squared =          1.168 for     57 degrees of freedom
# Null hypothesis probability =   1.812867e-01

Energy  Fluence     90% Error
[keV]   [erg/cm2]   [erg/cm2]
15- 25  3.969e-08   2.213e-08
25- 50  7.634e-08   4.216e-08
50-150  1.674e-07   9.124e-08
15-150  2.835e-07   1.549e-07
Double BB
Spectral model: bbodyrad<1> + bbodyrad<2>
------------------------------------------------------------
Parameters  : value         Lower 90%    Upper 90%
kT1 [keV]   : 6.49788        (-2.67933      6.03144)
R1^2/D10^2  : 0.921575        (-0.779534      3.01728)
kT2 [keV]   : 32.4120        (-9.17271      139.397)
R2^2/D10^2  : 7.25458E-03    (-0.00677814   0.0136726)
------------------------------------------------------------
#Fit statistic : Chi-Squared =          56.16 using 59 PHA bins.
# Reduced chi-squared =          1.021 for     55 degrees of freedom
# Null hypothesis probability =   4.312019e-01

Energy  Fluence     90% Error
[keV]   [erg/cm2]   [erg/cm2]
15- 25  3.199e-08   1.680e-08
25- 50  6.510e-08   2.690e-08
50-150  2.446e-07   1.189e-07
15-150  3.417e-07   1.462e-07
Peak spectrum fit
Power-law model

Time interval is from   -0.280 sec. to    0.720 sec.

Spectral model in power-law:
------------------------------------------------------------
Parameters  : value       lower 90%   higher 90%
Photon index: 1.36914     ( -0.396304   0.396311 )
Norm@50keV  : 7.97515E-03    ( -0.00169539   0.00167233 )
------------------------------------------------------------
#Fit statistic : Chi-Squared =          50.32 using 59 PHA bins.
# Reduced chi-squared =         0.8829 for     57 degrees of freedom
# Null hypothesis probability =   7.219014e-01

Photon flux (15-150 keV)    in 1 sec: 0.964641 ( -0.201008  0.201547 ) ph/cm2/s
Energy fluence (15-150 keV)             : 7.75637e-08 ( -1.85935e-08  1.90366e-08 ) ergs/cm2
Cutoff power-law model

Time interval is from   -0.280 sec. to    0.720 sec.
Spectral model in the cutoff power-law:
------------------------------------------------------------
Parameters  : value       lower 90%   higher 90%
Photon index: 1.37775     ( -0.410222   0.388011 )
Epeak [keV] : 9999.36      ( -9999.36 -9999.36 )
Norm@50keV  : 7.95675E-03    ( -0.00169462   0.0130005 )
------------------------------------------------------------
#Fit statistic : Chi-Squared =          50.33 using 59 PHA bins.
# Reduced chi-squared =         0.8988 for     56 degrees of freedom
# Null hypothesis probability =   6.883309e-01

Photon flux (15-150 keV)    in 1 sec: 0.966503 ( -0.203799  0.199597 ) ph/cm2/s
Energy fluence (15-150 keV)             : 7.75879e-08 ( -1.86312e-08  1.86414e-08 ) ergs/cm2
Band function

Time interval is from   -0.280 sec. to    0.720 sec.

Spectral model in the Band function:
------------------------------------------------------------
Parameters  : value       lower 90%   higher 90%
alpha       : 4.97249   ( -4.97249   -4.97249 )
beta        : -1.47842    ( -0.541713   0.448011 )
Epeak [keV] : 25.2525      ( -25.2525 7.87335 )
Norm@50keV   : 697.167    ( -142.686   4.449e+06 )
------------------------------------------------------------
#Fit statistic : Chi-Squared =          49.79 using 59 PHA bins.
# Reduced chi-squared =         0.9053 for     55 degrees of freedom
# Null hypothesis probability =   6.732588e-01

Photon flux (15-150 keV)    in 1 sec:  (    ) ph/cm2/s
Energy fluence (15-150 keV)             : 0 ( 0  0 ) ergs/cm2
Single BB

Spectral model blackbody:
------------------------------------------------------------
Parameters  : value    Lower 90%  Upper 90%
kT [keV]    : 18.8779  (-6.37618  9.31184)
R^2/D10^2   : 4.90303E-02  (-0.0344597   0.142201)
(R is the radius in km and D10 is the distance to the source in units of 10 kpc)
------------------------------------------------------------
#Fit statistic : Chi-Squared =          61.49 using 59 PHA bins.
# Reduced chi-squared =          1.079 for     57 degrees of freedom
# Null hypothesis probability =   3.185773e-01

Energy  Fluence     90% Error
[keV]   [erg/cm2]   [erg/cm2]
15- 25  3.443e-09   1.647e-09
25- 50  1.648e-08   7.905e-09
50-150  4.311e-08   2.234e-08
15-150  6.304e-08   3.213e-08
Thermal bremsstrahlung (OTTB)
Spectral model: thermal bremsstrahlung
------------------------------------------------------------
Parameters  : value         Lower 90%    Upper 90%
kT [keV]    : 199.360       (-96.4017      -199.362)
Norm        : 3.93980       (-0.817171     0.818942)
------------------------------------------------------------
#Fit statistic : Chi-Squared =          51.60 using 59 PHA bins.
# Reduced chi-squared =         0.9053 for     57 degrees of freedom
# Null hypothesis probability =   6.770859e-01

Energy  Fluence     90% Error
[keV]   [erg/cm2]   [erg/cm2]
15- 25  9.810e-09   5.710e-09
25- 50  1.887e-08   1.079e-08
50-150  4.139e-08   2.397e-08
15-150  7.007e-08   4.114e-08
Double BB
Spectral model: bbodyrad<1> + bbodyrad<2>
------------------------------------------------------------
Parameters  : value         Lower 90%    Upper 90%
kT1 [keV]   : 5.70652        (-1.67023      1.88161)
R1^2/D10^2  : 2.48510        (-1.93793      7.64693)
kT2 [keV]   : 35.3206        (-13.0854      47.095)
R2^2/D10^2  : 6.01729E-03    (-0.00517598   0.0105519)
------------------------------------------------------------
#Fit statistic : Chi-Squared =          47.02 using 59 PHA bins.
# Reduced chi-squared =         0.8550 for     55 degrees of freedom
# Null hypothesis probability =   7.691932e-01

Energy  Fluence     90% Error
[keV]   [erg/cm2]   [erg/cm2]
15- 25  1.103e-08   6.520e-09
25- 50  1.582e-08   8.785e-09
50-150  5.693e-08   3.476e-08
15-150  8.378e-08   4.587e-08
Pre-slew spectrum (Pre-slew PHA with pre-slew DRM)
Power-law model

Spectral model in power-law:
------------------------------------------------------------
Parameters  : value       lower 90%   higher 90%
Photon index: 1.14808     ( -0.206772   0.20185 )
Norm@50keV  : 7.06300E-03    ( -0.000776536   0.000774146 )
------------------------------------------------------------
#Fit statistic : Chi-Squared =          54.19 using 59 PHA bins.
# Reduced chi-squared =         0.9507 for     57 degrees of freedom
# Null hypothesis probability =   5.810726e-01

Photon flux (15-150 keV)    in 4.648 sec: 0.823492 ( -0.0941589  0.0944548 ) ph/cm2/s
Energy fluence (15-150 keV)             : 3.38152e-07 ( -4.05059e-08  4.07197e-08 ) ergs/cm2
Cutoff power-law model

Spectral model in the cutoff power-law:
------------------------------------------------------------
Parameters  : value       lower 90%   higher 90%
Photon index: 1.14334     ( -0.53136   0.255735 )
Epeak [keV] : 1.00000E+04      (   )
Norm@50keV  : 7.09869E-03    (     )
------------------------------------------------------------
#Fit statistic : Chi-Squared =          54.21 using 59 PHA bins.
# Reduced chi-squared =         0.9680 for     56 degrees of freedom
# Null hypothesis probability =   5.430444e-01

Photon flux (15-150 keV)    in 4.648 sec: 0.823534 ( -0.094342  0.094068 ) ph/cm2/s
Energy fluence (15-150 keV)             : 3.37237e-07 ( -3.964e-08  4.13291e-08 ) ergs/cm2
Band function
Spectral model in the Band function:
------------------------------------------------------------
Parameters  : value       lower 90%   higher 90%
alpha       : -0.917771   ( 0.917771   0.917771 )
beta        : -1.14804    ( 1.14804   0.206921 )
Epeak [keV] : 54.0495      ( -54.0494 -54.0494 )
Norm@50keV   : 1.24728E-02    ( -0.00575568   8.3341 )
------------------------------------------------------------
#Fit statistic : Chi-Squared =          54.19 using 59 PHA bins.
# Reduced chi-squared =         0.9853 for     55 degrees of freedom
# Null hypothesis probability =   5.054541e-01

Photon flux (15-150 keV)    in 4.648 sec:  (    ) ph/cm2/s
Energy fluence (15-150 keV)             : 0 ( 0  0 ) ergs/cm2
S(25-50 keV) vs. S(50-100 keV) plot

S(25-50 keV)  = 6.88e-08
S(50-100 keV) = 1.24e-07
T90 vs. Hardness ratio plot

T90                                   = 4.29999995231628 sec.
Hardness ratio (energy fluence ratio) = 1.80233
Color vs. Color plot
Count Ratio  (25-50 keV) / (15-25 keV) = 1.44155
Count Ratio (50-100 keV) / (15-25 keV) = 1.42835
Mask shadow pattern

IMX = 5.755639469620980E-01, IMY = -3.074235065807378E-01
TIME vs. PHA plot around the trigger time
Blue+Cyan dotted lines: Time interval of the scaled map
From 0.000000 to 2.048000
TIME vs. DetID plot around the trigger time
Blue+Cyan dotted lines: Time interval of the scaled map
From 0.000000 to 2.048000
100 us light curve (15-350 keV)

Blue+Cyan dotted lines: Time interval of the scaled map
From 0.000000 to 2.048000
Spacecraft aspect plot

Bright source in the pre-burst/pre-slew/post-slew images
Pre-burst image of 15-350 keV band
Time interval of the image:
-239.072000 -0.280000

# RAcent  DECcent POSerr Theta    Phi  PeakCts   SNR AngSep     Name
#  [deg]    [deg]    ['] [deg]  [deg]                   [']
154.5202  79.7038    2.3  32.2 -152.4   1.1161   5.0 ------	UNKNOWN
207.5532  17.2154    3.1  42.8  -23.5   1.0909   3.7 ------	UNKNOWN
227.3521  28.3508    4.1  47.2  -53.2   2.6283   2.8 ------	UNKNOWN
Pre-slew background subtracted image of 15-350 keV band
Time interval of the image:
-0.280000 4.368000

# RAcent  DECcent POSerr Theta    Phi  PeakCts   SNR AngSep     Name
#  [deg]    [deg]    ['] [deg]  [deg]                   [']
173.9579  15.0314    0.8  33.1   28.1   0.4902  14.1 ------	UNKNOWN
 53.7705  63.8383    2.6  57.8 -174.4   0.5451   4.4 ------	UNKNOWN
Post-slew image of 15-350 keV band
Time interval of the image:
92.828590 645.928600

# RAcent  DECcent POSerr Theta    Phi  PeakCts   SNR AngSep     Name
#  [deg]    [deg]    ['] [deg]  [deg]                   [']
159.7254  57.1423    3.2  43.5  160.3   2.8171   3.7 ------	UNKNOWN
163.8046 -25.0413    2.5  41.3    5.4   2.1777   4.5 ------	UNKNOWN
193.6337  70.6935    3.0  57.0  179.1   8.6760   3.9 ------	UNKNOWN
204.2786 -26.2490    4.0  50.7  -44.4   5.0944   2.9 ------	UNKNOWN
212.7305   0.2382    2.2  41.1  -81.0   8.2294   5.2 ------	UNKNOWN
214.0993   4.2619    3.1  41.0  -87.5   6.3316   3.8 ------	UNKNOWN
Plot creation:
Sat May 30 17:29:09 EDT 2015