Special notes of this burst
Image
Pre-slew 15.0-350.0 keV image (Event data)

#   RAcent    DECcent   POSerr    Theta     Phi              Peak Cts       SNR   Name
  279.4751   -11.6816   0.0127    55.8867    -8.8617         9.9180040     15.153 TRIG_00550457

Foreground time interval of the image:
-11.299 154.176 (delta_t = 165.475 [sec])
Background time interval of the image:
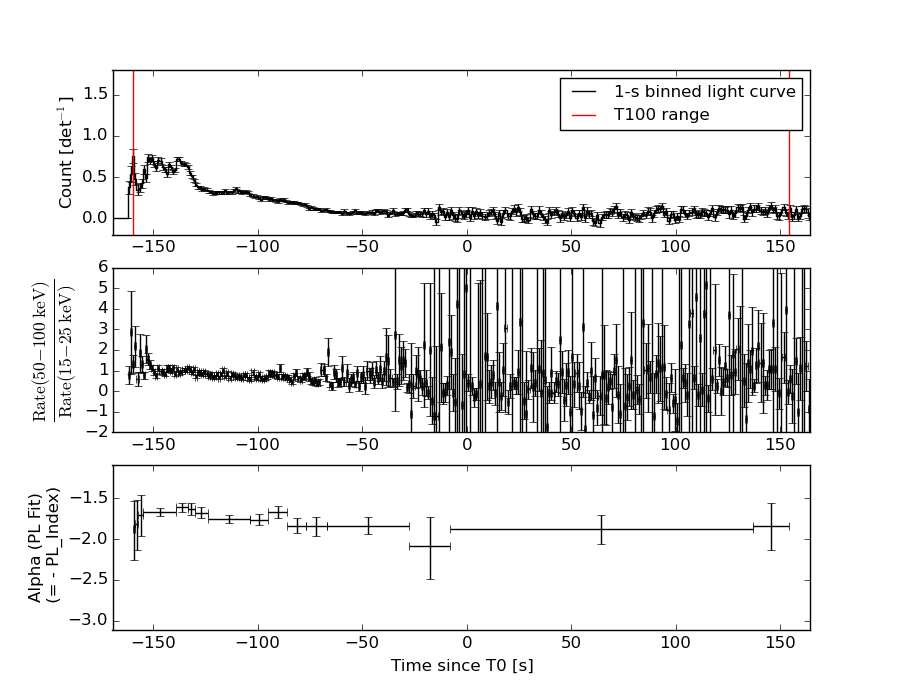
Lightcurves
Notes:
- 1) The mask-weighted light curves are using the flight position.
- 2) Multiple plots of different time binning/intervals are shown to cover all scenarios of short/long GRBs, rate/image triggers, and real/false positives.
- 3) For all the mask-weighted lightcurves, the y-axis units are counts/sec/det where a det is 0.4 x 0.4 = 0.16 sq cm.
- 4) The verticle lines correspond to following: green dotted lines are T50 interval, black dotted lines are T90 interval, blue solid line(s) is a spacecraft slew start time, and orange solid line(s) is a spacecraft slew end time.
- 5) Time of each bin is in the middle of the bin.
1 s binning
From T0-310 s to T0+310 s

From T100_start - 20 s to T100_end + 30 s
Full time interval

64 ms binning
Full time interval
From T100_start to T100_end
From T0-5 sec to T0+5 sec

16 ms binning
From T100_start-5 s to T100_start+5 s
Blue+Cyan dotted lines: Time interval of the scaled map
From 0.000000 to 64.000000
8 ms binning
From T100_start-3 s to T100_start+3 s

Blue+Cyan dotted lines: Time interval of the scaled map
From 0.000000 to 64.000000
2 ms binning
From T100_start-1 s to T100_start+1 s
Blue+Cyan dotted lines: Time interval of the scaled map
From 0.000000 to 64.000000
SN=5 or 10 sec. binning (whichever binning is satisfied first)
SN=5 or 10 sec. binning (T < 200 sec)
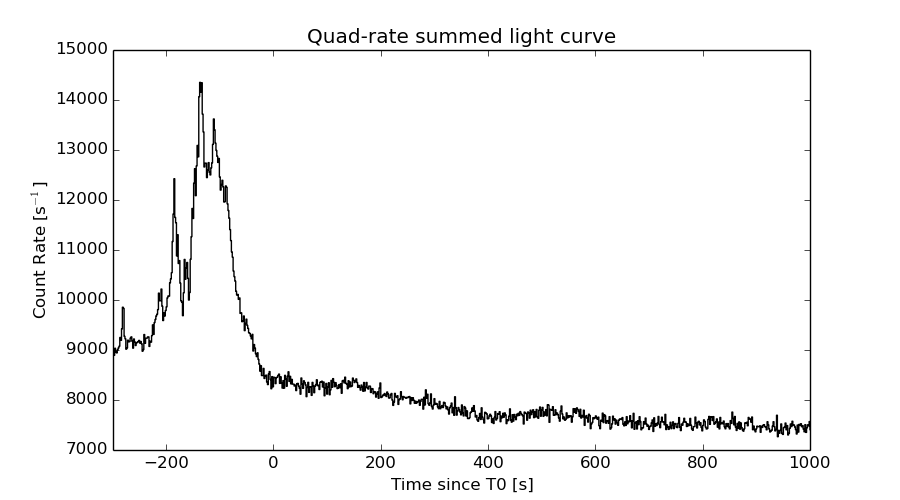
Quad-rate summed light curves (from T0-300s to T0+1000s)
Spectral Evolution
Spectra
Notes:
- 1) The fitting includes the systematic errors.
- 2) When the burst includes telescope slew time periods, the fitting uses an average response file made from multiple 5-s response files through out the slew time plus single time preiod for the non-slew times, and weighted by the total counts in the corresponding time period using addrmf. An average response file is needed becuase a spectral fit using the pre-slew DRM will introduce some errors in both a spectral shape and a normalization if the PHA file contains a lot of the slew/post-slew time interval.
- 3) For fits to more complicated models (e.g. a power-law over a cutoff power-law), the BAT team has decided to require a chi-square improvement of more than 6 for each extra dof.
Time averaged spectrum fit using the average DRM
Power-law model

Time interval is from -159.472 sec. to  154.176 sec.

Spectral model in power-law:
------------------------------------------------------------
Parameters  : value       lower 90%   higher 90%
Photon index: 1.74896     ( -0.0489459   0.0491411 )
Norm@50keV  : 1.02716E-02    ( -0.000253383   0.000253176 )
------------------------------------------------------------
#Fit statistic : Chi-Squared =          43.03 using 59 PHA bins.
# Reduced chi-squared =         0.7548 for     57 degrees of freedom
# Null hypothesis probability =   9.147120e-01

Photon flux (15-150 keV)    in 313.6 sec: 1.38837 ( -0.0393699  0.0395721 ) ph/cm2/s
Energy fluence (15-150 keV)             : 2.97249e-05 ( -7.48933e-07  7.49692e-07 ) ergs/cm2
Cutoff power-law model

Time interval is from -159.472 sec. to  154.176 sec.
Spectral model in the cutoff power-law:
------------------------------------------------------------
Parameters  : value       lower 90%   higher 90%
Photon index: 1.55839     ( -0.202415   0.192361 )
Epeak [keV] : 124.380      ( -37.9665 3992.3 )
Norm@50keV  : 1.25852E-02    ( -0.00212822   0.0029483 )
------------------------------------------------------------
#Fit statistic : Chi-Squared =          40.22 using 59 PHA bins.
# Reduced chi-squared =         0.7182 for     56 degrees of freedom
# Null hypothesis probability =   9.447139e-01

Photon flux (15-150 keV)    in 313.6 sec: 1.36365 ( -0.04588  0.04621 ) ph/cm2/s
Energy fluence (15-150 keV)             : 2.92959e-05 ( -8.73062e-07  8.69299e-07 ) ergs/cm2
Band function
Time interval is from -159.472 sec. to  154.176 sec.

Spectral model in the Band function:
------------------------------------------------------------
Parameters  : value       lower 90%   higher 90%
alpha       : -1.55044   ( -0.0927396   0.185398 )
beta        : -9.14499    ( 9.36706   19.3659 )
Epeak [keV] : 123.365      ( -28.249 4075.03 )
Norm@50keV   : 1.26593E-02    ( -0.000308598   0.00123414 )
------------------------------------------------------------
#Fit statistic : Chi-Squared =          40.23 using 59 PHA bins.
# Reduced chi-squared =         0.7314 for     55 degrees of freedom
# Null hypothesis probability =   9.323669e-01

Photon flux (15-150 keV)    in 313.6 sec:  (    ) ph/cm2/s
Energy fluence (15-150 keV)             : 2.96169e-05 ( -2.96147e-05  -2.96169e-05 ) ergs/cm2
Single BB
Spectral model blackbody:
------------------------------------------------------------
Parameters  : value    Lower 90%  Upper 90%
kT [keV]    : 14.8001  (  )
R^2/D10^2   : 0.145762  (   )
(R is the radius in km and D10 is the distance to the source in units of 10 kpc)
------------------------------------------------------------
#Fit statistic : Chi-Squared =         383.47 using 59 PHA bins.
# Reduced chi-squared =         6.7276 for     57 degrees of freedom
# Null hypothesis probability =   6.489229e-50

Energy  Fluence     90% Error
[keV]   [erg/cm2]   [erg/cm2]
15- 25  2.101e-06   1.018e-07
25- 50  8.244e-06   2.728e-07
50-150  1.221e-05   5.911e-07
15-150  2.256e-05   5.958e-07
Thermal bremsstrahlung (OTTB)
Spectral model: thermal bremsstrahlung
------------------------------------------------------------
Parameters  : value         Lower 90%    Upper 90%
kT [keV]    : 135.433       (-14.9247      17.5042)
Norm        : 5.63603       (-0.196386     0.215268)
------------------------------------------------------------
#Fit statistic : Chi-Squared =          45.21 using 59 PHA bins.
# Reduced chi-squared =         0.7931 for     57 degrees of freedom
# Null hypothesis probability =   8.702576e-01

Energy  Fluence     90% Error
[keV]   [erg/cm2]   [erg/cm2]
15- 25  4.574e-06   2.681e-07
25- 50  8.349e-06   3.920e-07
50-150  1.577e-05   3.359e-06
15-150  2.869e-05   3.613e-06
Double BB

Spectral model: bbodyrad<1> + bbodyrad<2>
------------------------------------------------------------
Parameters  : value         Lower 90%    Upper 90%
kT1 [keV]   : 6.68500        (-0.655909      0.699045)
R1^2/D10^2  : 1.79318        (-0.546146      0.87499)
kT2 [keV]   : 24.0870        (-1.96588      2.48162)
R2^2/D10^2  : 1.96097E-02    (-0.00617234   0.0077902)
------------------------------------------------------------
#Fit statistic : Chi-Squared =          53.36 using 59 PHA bins.
# Reduced chi-squared =         0.9702 for     55 degrees of freedom
# Null hypothesis probability =   5.375432e-01

Energy  Fluence     90% Error
[keV]   [erg/cm2]   [erg/cm2]
15- 25  4.471e-06   4.281e-07
25- 50  8.317e-06   4.171e-07
50-150  1.587e-05   9.847e-07
15-150  2.865e-05   1.380e-06
Peak spectrum fit
Power-law model
Time interval is from -138.276 sec. to -137.276 sec.

Spectral model in power-law:
------------------------------------------------------------
Parameters  : value       lower 90%   higher 90%
Photon index: 1.57337     ( -0.107283   0.107971 )
Norm@50keV  : 5.22230E-02    ( -0.0031216   0.00311284 )
------------------------------------------------------------
#Fit statistic : Chi-Squared =          53.99 using 59 PHA bins.
# Reduced chi-squared =         0.9472 for     57 degrees of freedom
# Null hypothesis probability =   5.887150e-01

Photon flux (15-150 keV)    in 1 sec: 6.65671 ( -0.409469  0.410806 ) ph/cm2/s
Energy fluence (15-150 keV)             : 4.90053e-07 ( -3.13903e-08  3.15729e-08 ) ergs/cm2
Cutoff power-law model

Time interval is from -138.276 sec. to -137.276 sec.
Spectral model in the cutoff power-law:
------------------------------------------------------------
Parameters  : value       lower 90%   higher 90%
Photon index: 1.57630     ( -0.193599   0.105353 )
Epeak [keV] : 9999.36      ( -9999.36 -9999.36 )
Norm@50keV  : 5.22213E-02    ( -0.0111899   0.0224848 )
------------------------------------------------------------
#Fit statistic : Chi-Squared =          54.01 using 59 PHA bins.
# Reduced chi-squared =         0.9644 for     56 degrees of freedom
# Null hypothesis probability =   5.506835e-01

Photon flux (15-150 keV)    in 1 sec: 6.65443 ( -0.40983  0.40978 ) ph/cm2/s
Energy fluence (15-150 keV)             : 4.90003e-07 ( -3.0787e-08  3.1276e-08 ) ergs/cm2
Band function
Time interval is from -138.276 sec. to -137.276 sec.

Spectral model in the Band function:
------------------------------------------------------------
Parameters  : value       lower 90%   higher 90%
alpha       : 4.63894   ( -4.63894   -4.63894 )
beta        : -1.58439    ( -0.112497   0.10951 )
Epeak [keV] : 19.3274      ( -19.3274 5.48889 )
Norm@50keV   : 1.46208E+04    ( -853.249   2.83028e+07 )
------------------------------------------------------------
#Fit statistic : Chi-Squared =          53.74 using 59 PHA bins.
# Reduced chi-squared =         0.9771 for     55 degrees of freedom
# Null hypothesis probability =   5.228848e-01

Photon flux (15-150 keV)    in 1 sec:  (    ) ph/cm2/s
Energy fluence (15-150 keV)             : 0 ( 0  0 ) ergs/cm2
Single BB

Spectral model blackbody:
------------------------------------------------------------
Parameters  : value    Lower 90%  Upper 90%
kT [keV]    : 14.9265  (  )
R^2/D10^2   : 0.734523  (   )
(R is the radius in km and D10 is the distance to the source in units of 10 kpc)
------------------------------------------------------------
#Fit statistic : Chi-Squared =         141.09 using 59 PHA bins.
# Reduced chi-squared =         2.4753 for     57 degrees of freedom
# Null hypothesis probability =   4.416623e-09

Energy  Fluence     90% Error
[keV]   [erg/cm2]   [erg/cm2]
15- 25  3.429e-08   3.760e-09
25- 50  1.356e-07   1.035e-08
50-150  2.052e-07   2.215e-08
15-150  3.751e-07   2.760e-08
Thermal bremsstrahlung (OTTB)

Spectral model: thermal bremsstrahlung
------------------------------------------------------------
Parameters  : value         Lower 90%    Upper 90%
kT [keV]    : 200.000       (      )
Norm        : 26.8896       (-1.57615     1.5737)
------------------------------------------------------------
#Fit statistic : Chi-Squared =          56.59 using 59 PHA bins.
# Reduced chi-squared =         0.9928 for     57 degrees of freedom
# Null hypothesis probability =   4.903382e-01

Energy  Fluence     90% Error
[keV]   [erg/cm2]   [erg/cm2]
15- 25  6.697e-08   4.825e-09
25- 50  1.288e-07   9.000e-09
50-150  2.825e-07   6.090e-08
15-150  4.783e-07   7.420e-08
Double BB
Spectral model: bbodyrad<1> + bbodyrad<2>
------------------------------------------------------------
Parameters  : value         Lower 90%    Upper 90%
kT1 [keV]   : 7.09967        (-1.29369      1.47866)
R1^2/D10^2  : 7.23651        (-3.38559      7.72829)
kT2 [keV]   : 29.9337        (-5.91072      10.9383)
R2^2/D10^2  : 5.14705E-02    (-0.0322856   0.0601369)
------------------------------------------------------------
#Fit statistic : Chi-Squared =          57.61 using 59 PHA bins.
# Reduced chi-squared =          1.047 for     55 degrees of freedom
# Null hypothesis probability =   3.788493e-01

Energy  Fluence     90% Error
[keV]   [erg/cm2]   [erg/cm2]
15- 25  6.668e-08   1.480e-08
25- 50  1.282e-07   2.261e-08
50-150  2.967e-07   8.535e-08
15-150  4.915e-07   1.174e-07
Pre-slew spectrum (Pre-slew PHA with pre-slew DRM)
Power-law model

Spectral model in power-law:
------------------------------------------------------------
Parameters  : value       lower 90%   higher 90%
Photon index: 1.89411     ( -0.154958   0.159871 )
Norm@50keV  : 4.32829E-03    ( -0.000398137   0.000392788 )
------------------------------------------------------------
#Fit statistic : Chi-Squared =          42.78 using 59 PHA bins.
# Reduced chi-squared =         0.7505 for     57 degrees of freedom
# Null hypothesis probability =   9.189711e-01

Photon flux (15-150 keV)    in 165.5 sec: 0.619607 ( -0.0543166  0.0546196 ) ph/cm2/s
Energy fluence (15-150 keV)             : 6.58544e-06 ( -5.96573e-07  6.0053e-07 ) ergs/cm2
Cutoff power-law model

Spectral model in the cutoff power-law:
------------------------------------------------------------
Parameters  : value       lower 90%   higher 90%
Photon index: 1.69713     ( -0.66628   0.56994 )
Epeak [keV] : 75.0739      (   )
Norm@50keV  : 5.46471E-03    (     )
------------------------------------------------------------
#Fit statistic : Chi-Squared =          42.47 using 59 PHA bins.
# Reduced chi-squared =         0.7584 for     56 degrees of freedom
# Null hypothesis probability =   9.090246e-01

Photon flux (15-150 keV)    in 165.5 sec: 0.612583 ( -0.05816  0.057985 ) ph/cm2/s
Energy fluence (15-150 keV)             : 6.49746e-06 ( -6.60345e-07  6.54933e-07 ) ergs/cm2
Band function
Spectral model in the Band function:
------------------------------------------------------------
Parameters  : value       lower 90%   higher 90%
alpha       : -1.64261   ( 1.60006   1.60006 )
beta        : -2.12720    ( 2.11473   0.366191 )
Epeak [keV] : 67.1201      ( -65.9763 -65.9763 )
Norm@50keV   : 5.86223E-03    ( -0.00172591   0 )
------------------------------------------------------------
#Fit statistic : Chi-Squared =          42.43 using 59 PHA bins.
# Reduced chi-squared =         0.7715 for     55 degrees of freedom
# Null hypothesis probability =   8.923137e-01

Photon flux (15-150 keV)    in 165.5 sec:  (    ) ph/cm2/s
Energy fluence (15-150 keV)             : 6.4803e-06 ( 0  0 ) ergs/cm2
S(25-50 keV) vs. S(50-100 keV) plot
S(25-50 keV)  = 8.21e-06
S(50-100 keV) = 9.77e-06
T90 vs. Hardness ratio plot

T90                                   = 272.379999935627 sec.
Hardness ratio (energy fluence ratio) = 1.19001
Color vs. Color plot

Count Ratio  (25-50 keV) / (15-25 keV) = 1.2219
Count Ratio (50-100 keV) / (15-25 keV) = 0.879547
Mask shadow pattern
IMX = 1.458634699968526E+00, IMY = 2.274181447674928E-01
TIME vs. PHA plot around the trigger time

Blue+Cyan dotted lines: Time interval of the scaled map
From 0.000000 to 64.000000
TIME vs. DetID plot around the trigger time
Blue+Cyan dotted lines: Time interval of the scaled map
From 0.000000 to 64.000000
100 us light curve (15-350 keV)

Blue+Cyan dotted lines: Time interval of the scaled map
From 0.000000 to 64.000000
Spacecraft aspect plot
Bright source in the pre-burst/pre-slew/post-slew images
Pre-burst image of 15-350 keV band
Time interval of the image:
Pre-slew background subtracted image of 15-350 keV band
Time interval of the image:
-11.299400 154.176000

# RAcent  DECcent POSerr Theta    Phi  PeakCts   SNR AngSep     Name
#  [deg]    [deg]    ['] [deg]  [deg]                   [']
254.6371  35.2990   34.0  33.5   63.2  -0.1249  -0.3    9.2	Her X-1
268.4636  -1.4705    8.4  50.4    8.6  -0.6543  -1.4    5.8	SW J1753.5-0127
288.7944  10.9534    0.7  31.7  -14.2   3.3183  16.7    0.5	GRS 1915+105
299.5637  35.2188    1.9   6.9  -46.9   0.9722   6.0    1.7	Cyg X-1
308.1115  40.9375    2.3   8.3 -117.6   0.7883   5.0    0.9	Cyg X-3
326.2472  38.3457    6.4  22.5 -120.8   0.3516   1.8    3.8	Cyg X-2
257.4515   1.7242    2.8  53.6   22.6   4.1932   4.2 ------	UNKNOWN
279.4752 -11.6816    0.8  55.9   -8.9   9.9167  15.2 ------	UNKNOWN
  4.3087  52.5882    2.8  45.2 -157.7   1.3664   4.2 ------	UNKNOWN
337.3603  18.6945    6.1  41.2  -98.2   1.6634   1.9 ------	UNKNOWN
Post-slew image of 15-350 keV band
Time interval of the image:
546.400600 963.041900

# RAcent  DECcent POSerr Theta    Phi  PeakCts   SNR AngSep     Name
#  [deg]    [deg]    ['] [deg]  [deg]                   [']
254.6081  35.4232   10.0  34.1   69.2   0.7558   1.2    8.8	Her X-1
268.2804  -1.3197    7.7  50.9   15.2   1.7894   1.5    9.6	SW J1753.5-0127
288.7895  10.9529    0.7  32.0   -7.3   6.3593  16.7    0.7	GRS 1915+105
299.5565  35.2688    1.6   6.7  -35.6   2.1875   7.2    4.4	Cyg X-1
308.1564  40.9611    1.3   7.7 -110.9   2.5354   8.6    2.2	Cyg X-3
326.1621  38.1725    6.7  21.8 -114.1   0.6356   1.7    9.0	Cyg X-2
283.7127  22.4600    3.5  22.8   11.5   0.9893   3.3 ------	UNKNOWN
Plot creation:
Sat May 30 17:17:31 EDT 2015