Click here for the BAT GCN circular template
Image
Pre-slew 15.0-350.0 keV image (Event data)
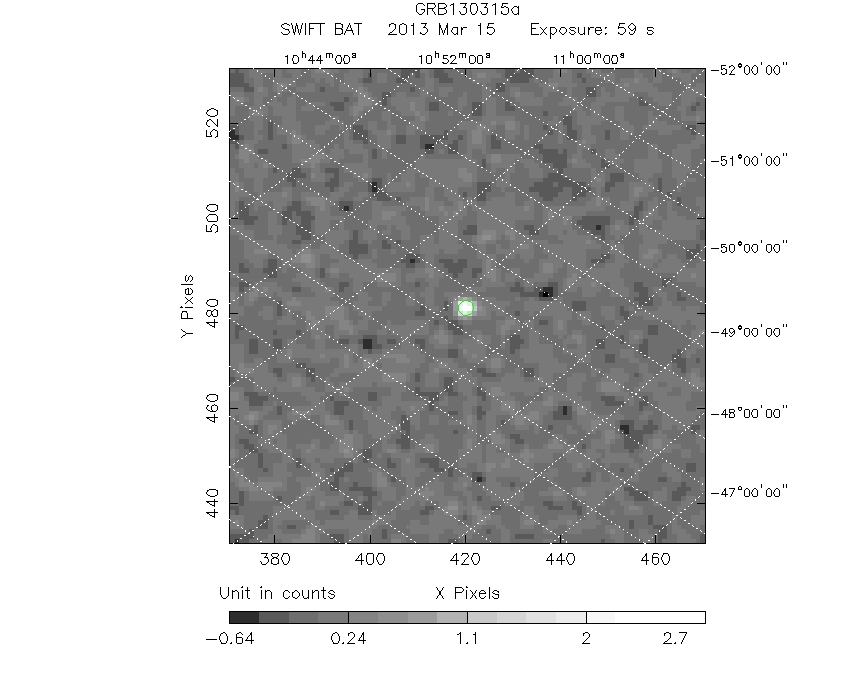
#   RAcent    DECcent   POSerr    Theta     Phi              Peak Cts       SNR   Name
  157.5419   -51.7953   0.0096    43.9895    -0.5539         3.0014198     20.061 TRIG_00551126

Foreground time interval of the image:
  1.624  60.805 (delta_t =  59.181 [sec])
Background time interval of the image:
-239.296   1.624 (delta_t = 240.920 [sec])
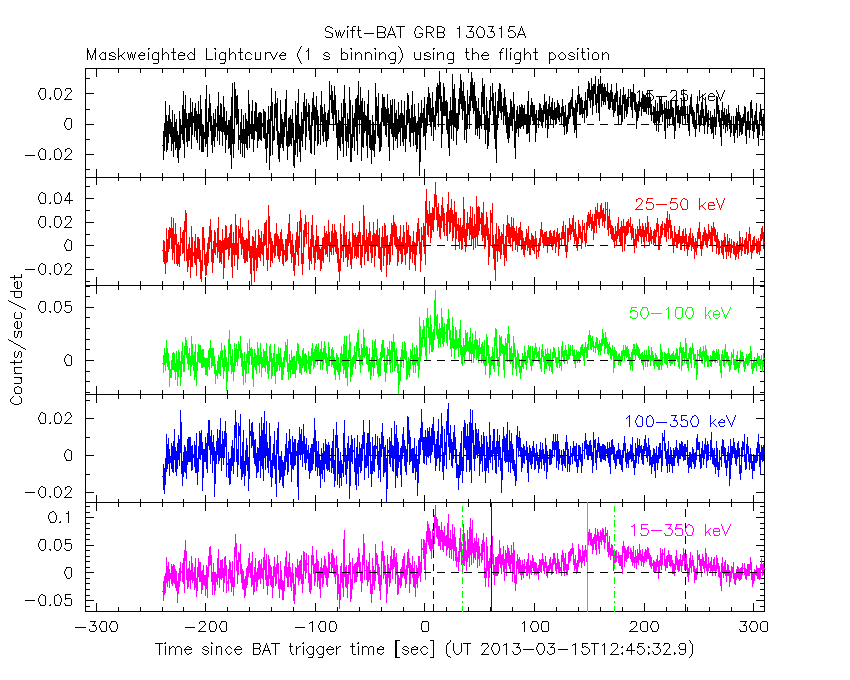
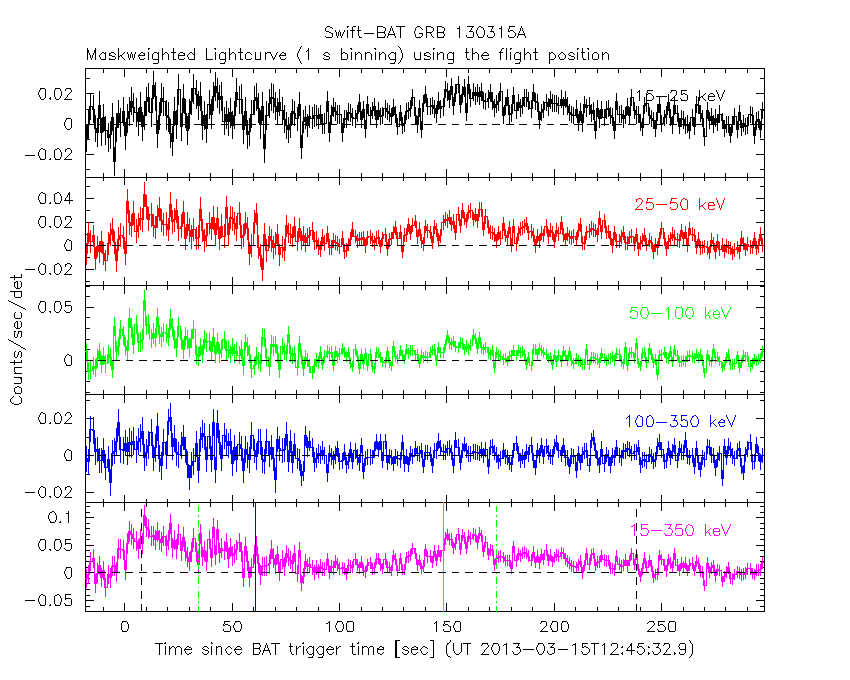
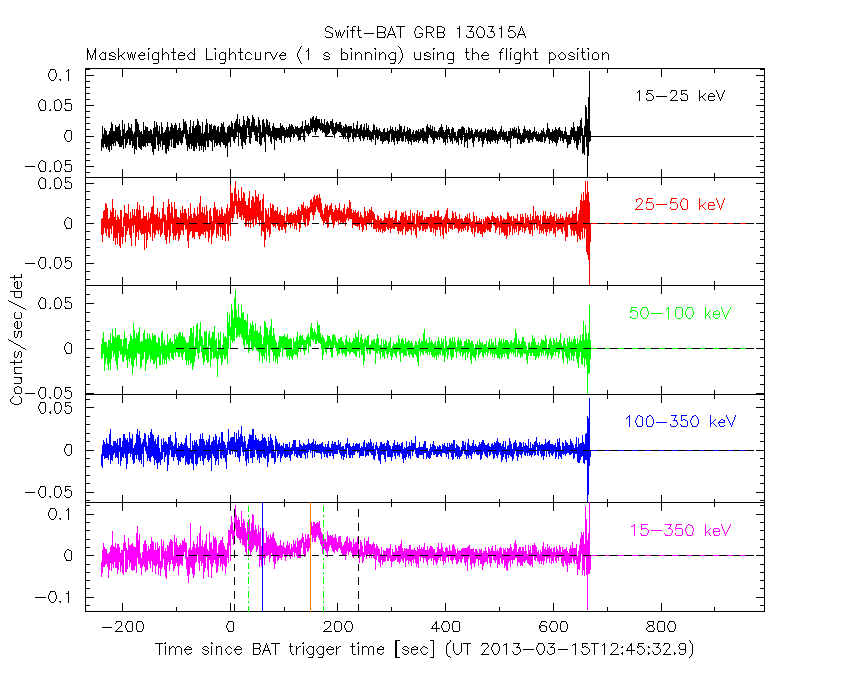
Lightcurves
Notes:
- 1) The mask-weighted light curves are using the flight position.
- 2) Multiple plots of different time binning/intervals are shown to cover all scenarios of short/long GRBs, rate/image triggers, and real/false positives.
- 3) For all the mask-weighted lightcurves, the y-axis units are counts/sec/det where a det is 0.4 x 0.4 = 0.16 sq cm.
- 4) The verticle lines correspond to following: green dotted lines are T50 interval, black dotted lines are T90 interval, blue solid line(s) is a spacecraft slew start time, and orange solid line(s) is a spacecraft slew end time.
- 5) Time of each bin is in the middle of the bin.
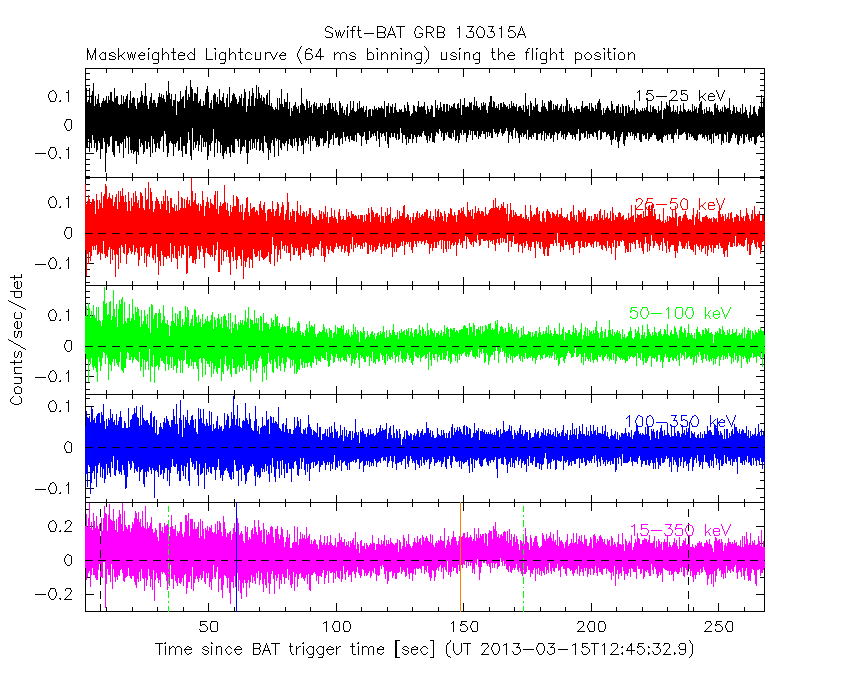
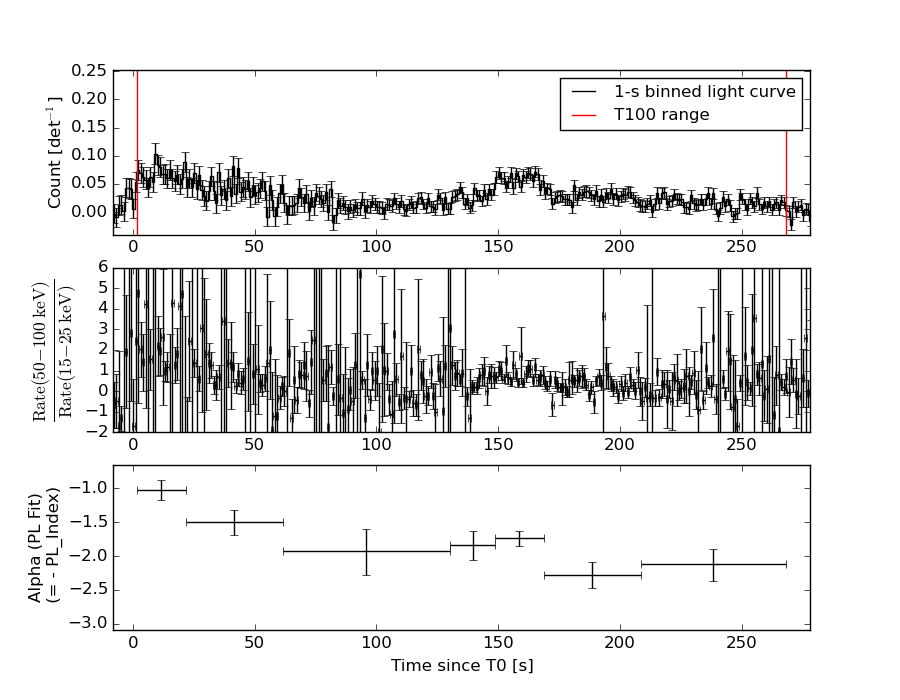
1 s binning
From T0-310 s to T0+310 s
From T100_start - 20 s to T100_end + 30 s
Full time interval
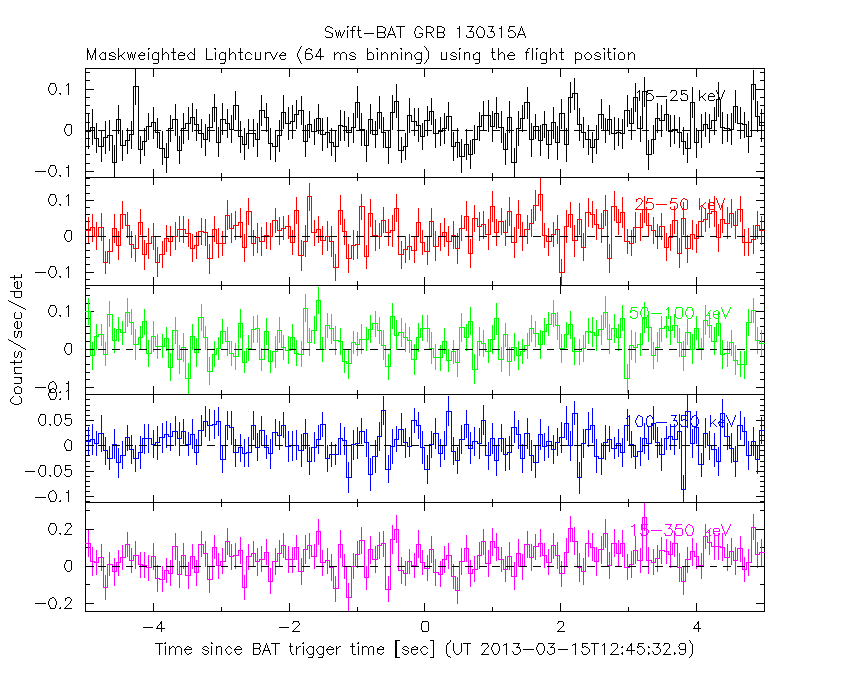
64 ms binning
Full time interval

From T100_start to T100_end
From T0-5 sec to T0+5 sec
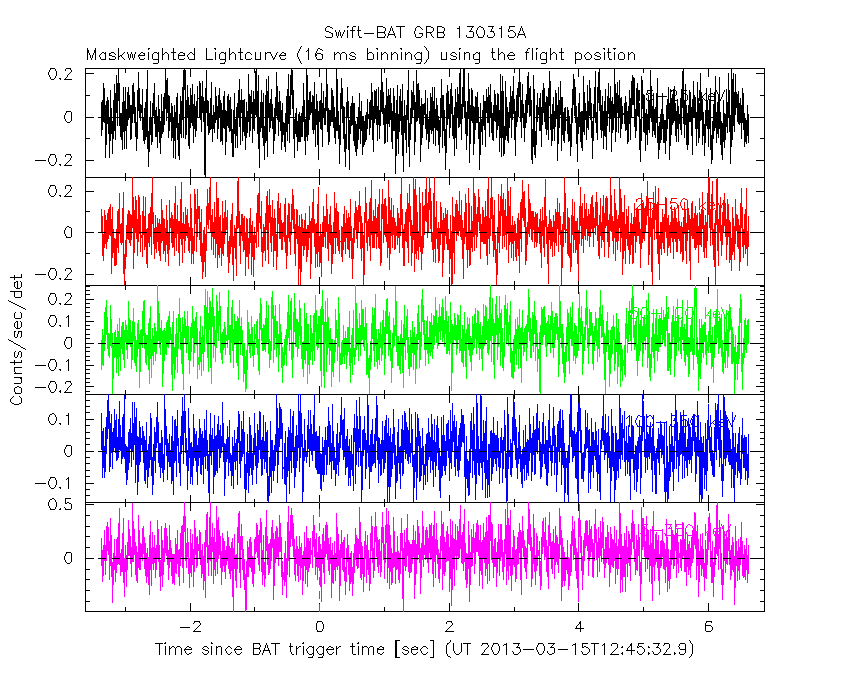
16 ms binning
From T100_start-5 s to T100_start+5 s
Blue+Cyan dotted lines: Time interval of the scaled map
From 0.000000 to 12.160000
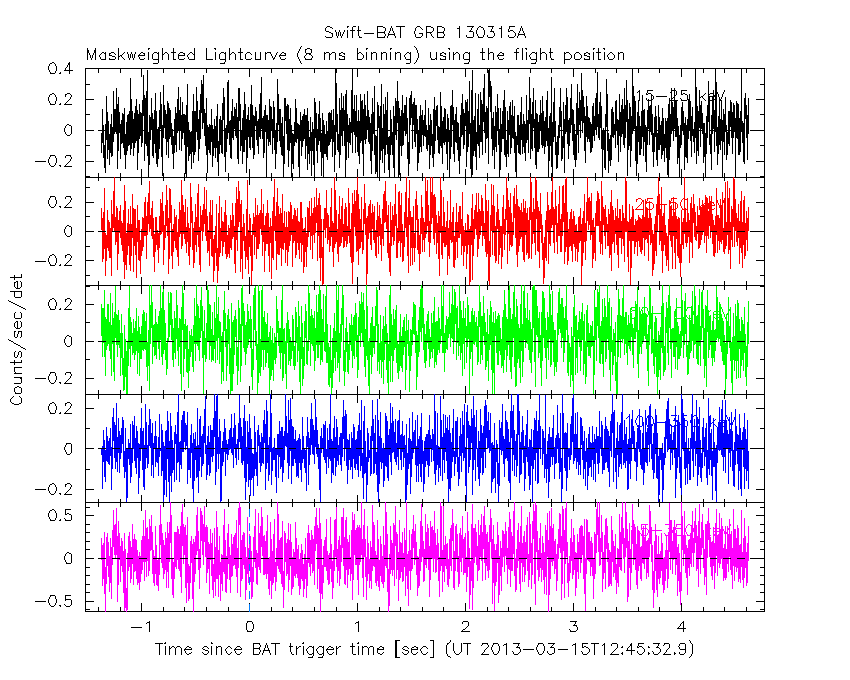
8 ms binning
From T100_start-3 s to T100_start+3 s
Blue+Cyan dotted lines: Time interval of the scaled map
From 0.000000 to 12.160000
2 ms binning
From T100_start-1 s to T100_start+1 s
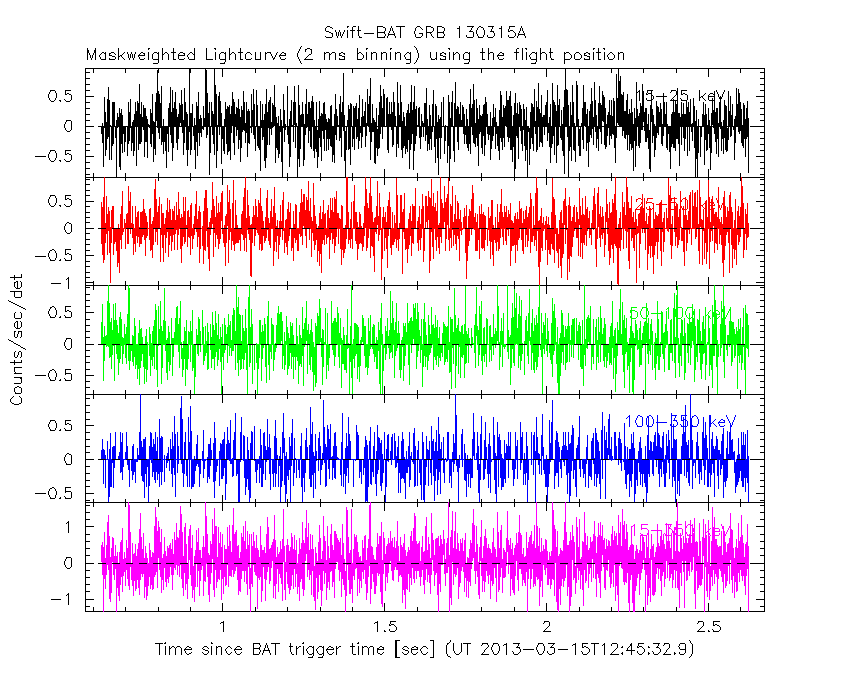
Blue+Cyan dotted lines: Time interval of the scaled map
From 0.000000 to 12.160000
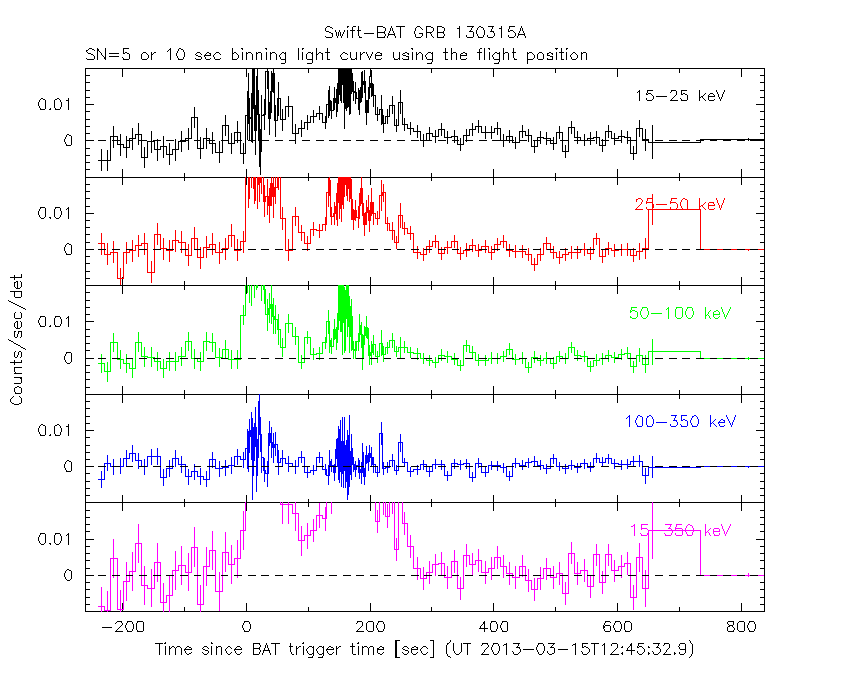
SN=5 or 10 sec. binning (whichever binning is satisfied first)
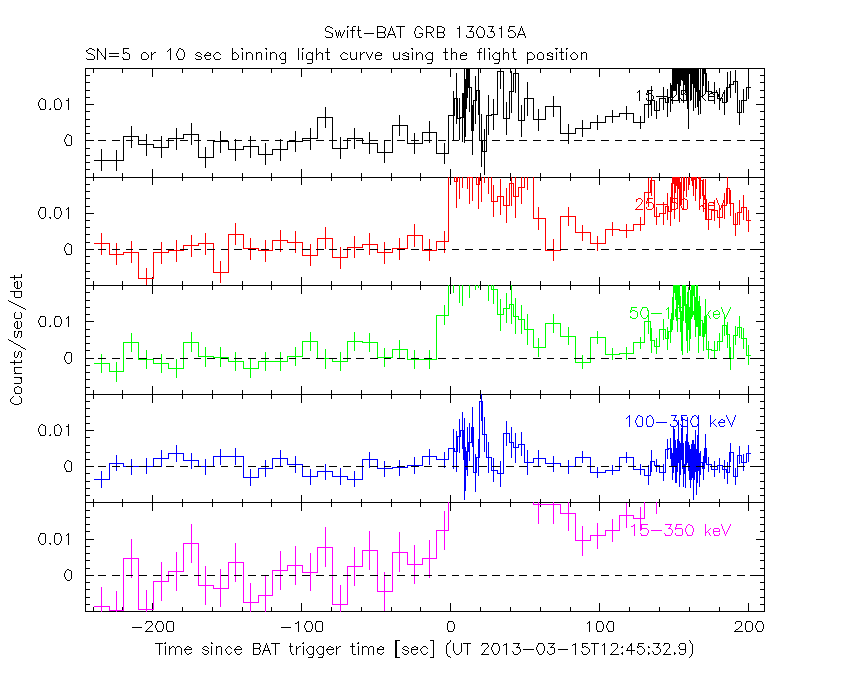
SN=5 or 10 sec. binning (T < 200 sec)
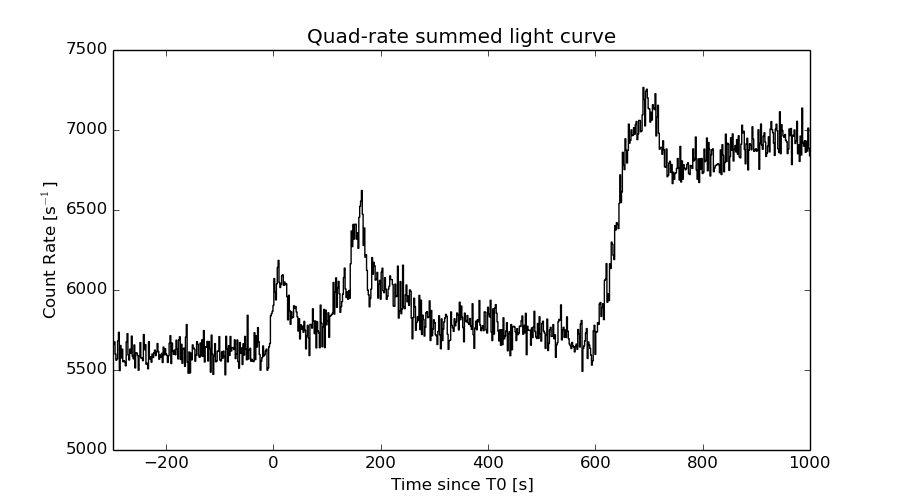
Quad-rate summed light curves (from T0-300s to T0+1000s)
The mask-weighted light curves based on cleaned DPHs

Spectral Evolution
Spectra
Notes:
- 1) The fitting includes the systematic errors.
- 2) When the burst includes telescope slew time periods, the fitting uses an average response file made from multiple 5-s response files through out the slew time plus single time preiod for the non-slew times, and weighted by the total counts in the corresponding time period using addrmf. An average response file is needed becuase a spectral fit using the pre-slew DRM will introduce some errors in both a spectral shape and a normalization if the PHA file contains a lot of the slew/post-slew time interval.
- 3) For fits to more complicated models (e.g. a power-law over a cutoff power-law), the BAT team has decided to require a chi-square improvement of more than 6 for each extra dof.
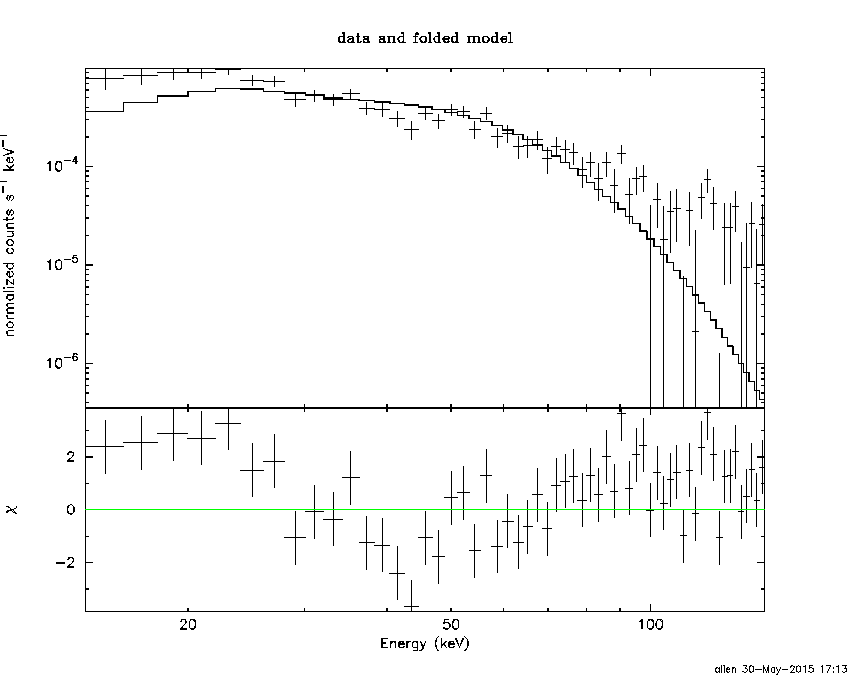
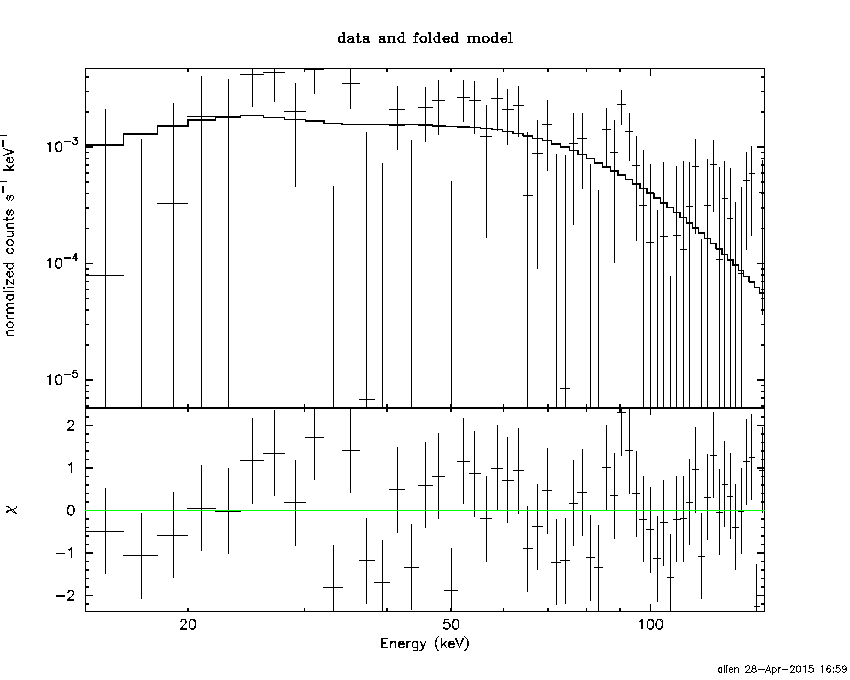
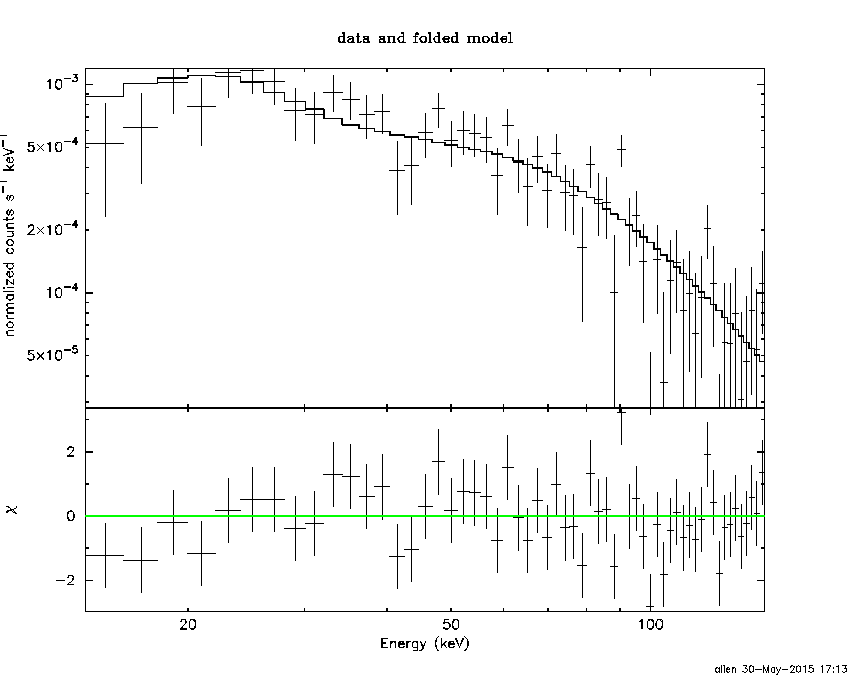
Time averaged spectrum fit using the average DRM
Power-law model
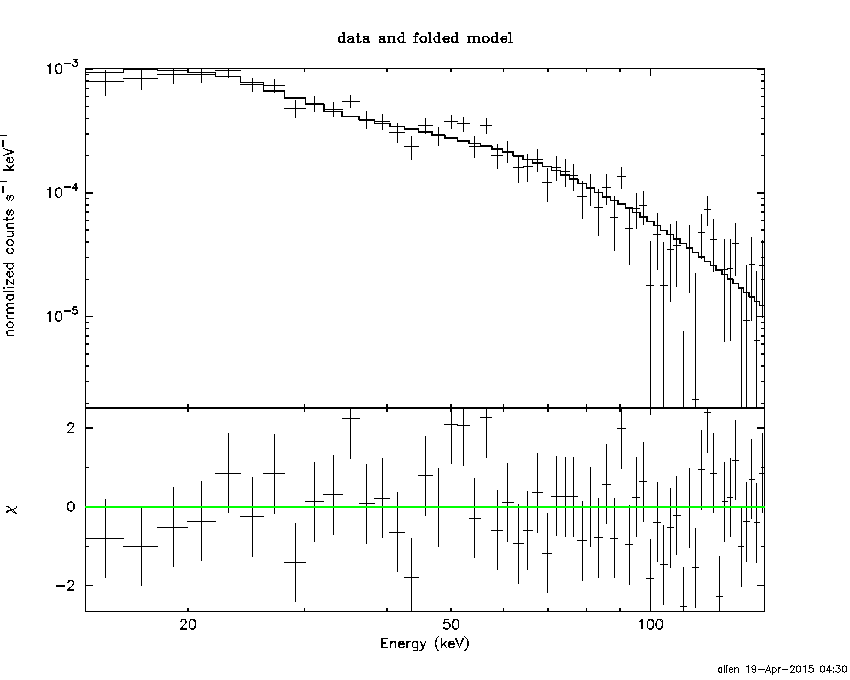
Time interval is from    1.624 sec. to  267.996 sec.

Spectral model in power-law:
------------------------------------------------------------
Parameters  : value       lower 90%   higher 90%
Photon index: 1.72532     ( -0.0833578   0.0841517 )
Norm@50keV  : 1.83911E-03    ( -8.86058e-05   8.82366e-05 )
------------------------------------------------------------
#Fit statistic : Chi-Squared =          70.96 using 59 PHA bins.
# Reduced chi-squared =          1.245 for     57 degrees of freedom
# Null hypothesis probability =   1.011420e-01

Photon flux (15-150 keV)    in 266.4 sec: 0.246455 ( -0.0117941  0.0118179 ) ph/cm2/s
Energy fluence (15-150 keV)             : 4.52784e-06 ( -2.26652e-07  2.27615e-07 ) ergs/cm2
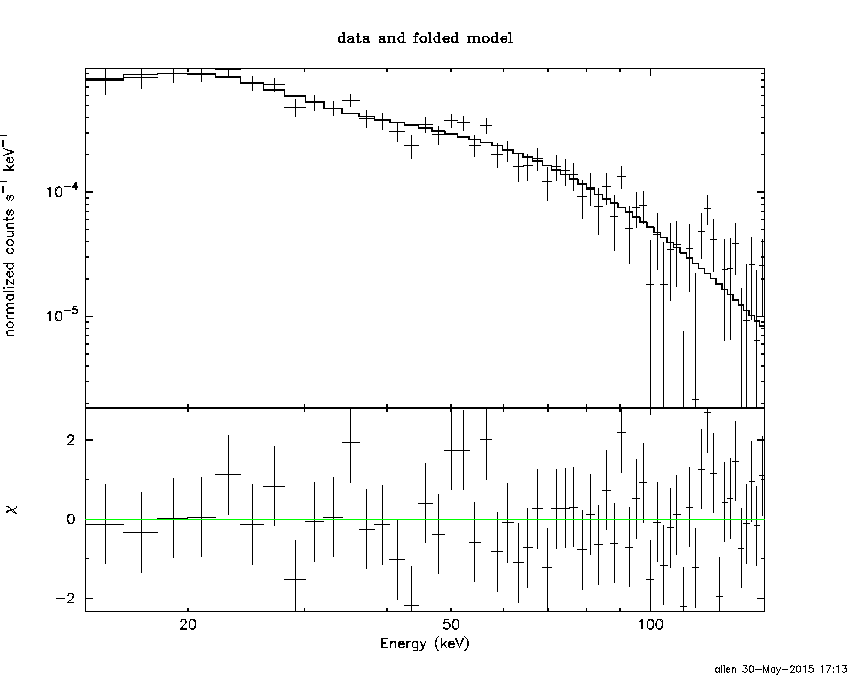
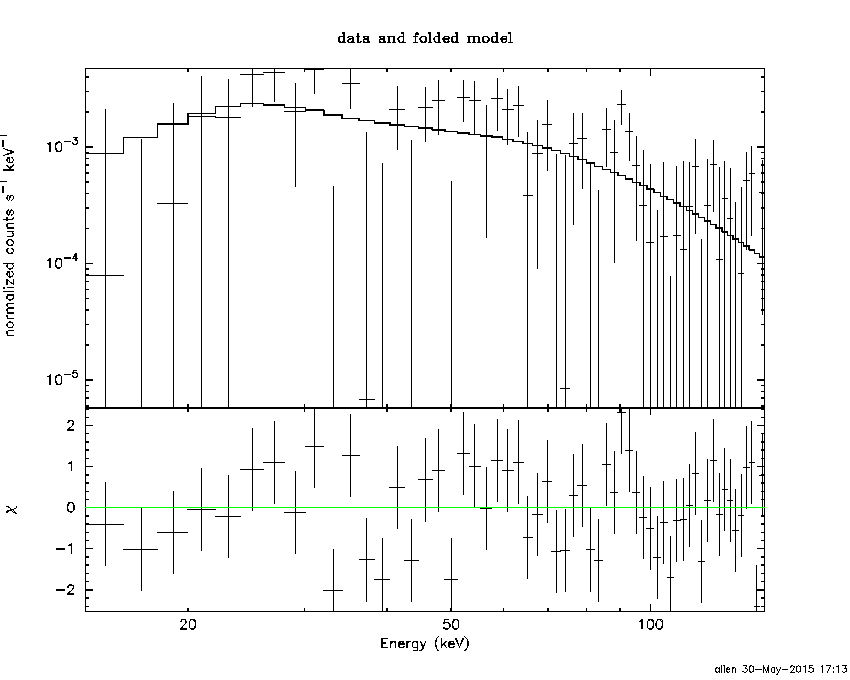
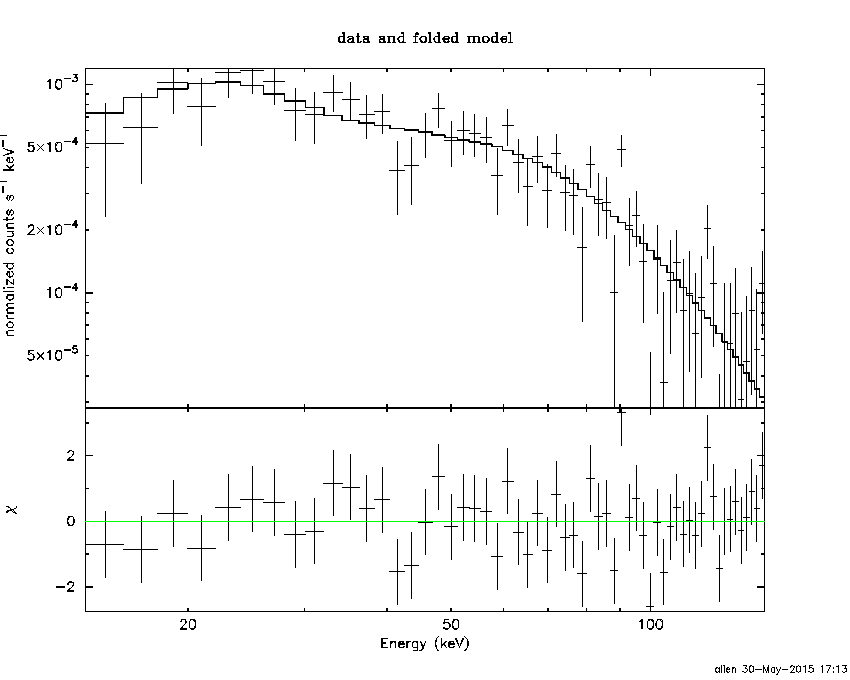
Cutoff power-law model
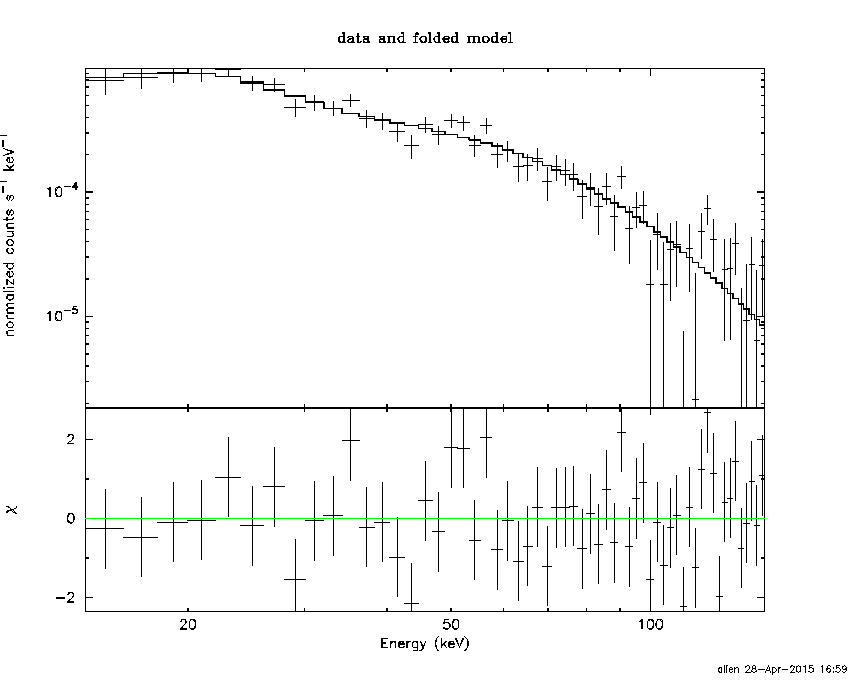
Time interval is from    1.624 sec. to  267.996 sec.
Spectral model in the cutoff power-law:
------------------------------------------------------------
Parameters  : value       lower 90%   higher 90%
Photon index: 1.34163     ( -0.362809   0.334474 )
Epeak [keV] : 83.5637      ( -19.8877 191.003 )
Norm@50keV  : 2.89138E-03    ( -0.000922551   0.00150532 )
------------------------------------------------------------
#Fit statistic : Chi-Squared =          67.09 using 59 PHA bins.
# Reduced chi-squared =          1.198 for     56 degrees of freedom
# Null hypothesis probability =   1.473971e-01

Photon flux (15-150 keV)    in 266.4 sec: 0.241047 ( -0.012648  0.012661 ) ph/cm2/s
Energy fluence (15-150 keV)             : 4.38825e-06 ( -2.58008e-07  2.58168e-07 ) ergs/cm2
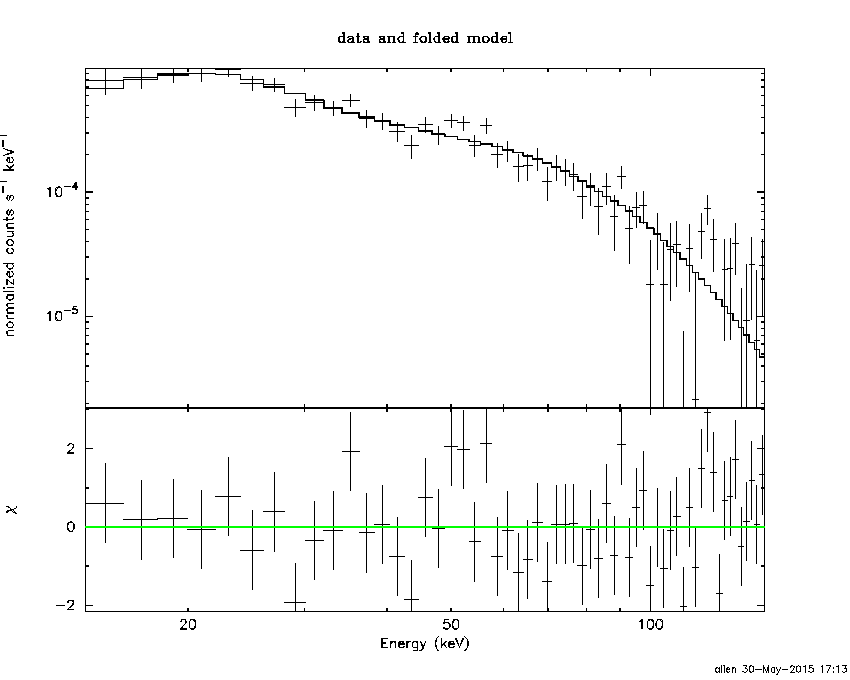
Band function
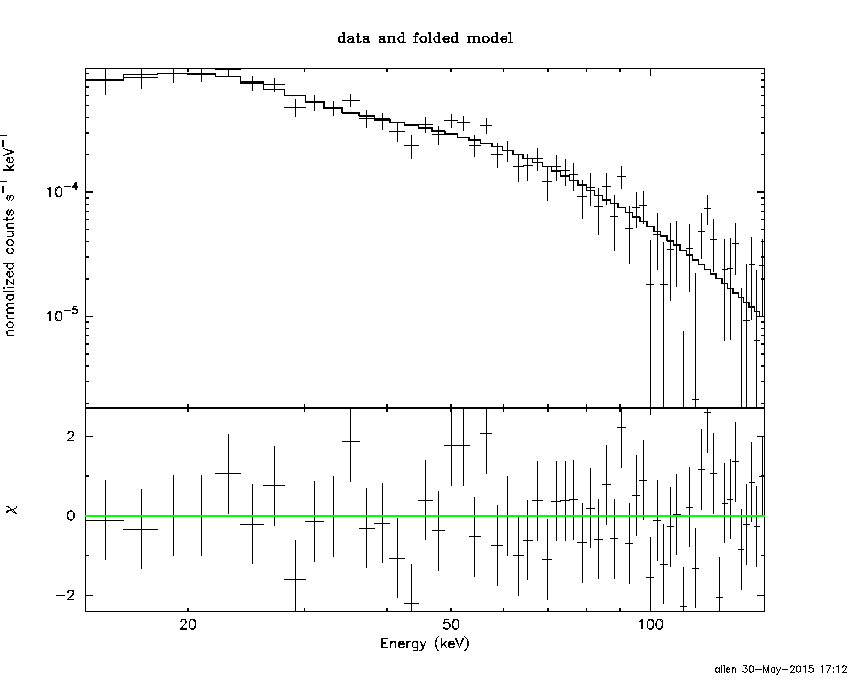
Time interval is from    1.624 sec. to  267.996 sec.

Spectral model in the Band function:
------------------------------------------------------------
Parameters  : value       lower 90%   higher 90%
alpha       : -1.17689   ( -0.461256   1.17125 )
beta        : -1.98345    ( 1.98049   0.25078 )
Epeak [keV] : 66.8800      ( -43.8336 117.045 )
Norm@50keV   : 3.63031E-03    ( -0.00158202   0.345927 )
------------------------------------------------------------
#Fit statistic : Chi-Squared =          66.52 using 59 PHA bins.
# Reduced chi-squared =          1.209 for     55 degrees of freedom
# Null hypothesis probability =   1.373404e-01

Photon flux (15-150 keV)    in 266.4 sec:  (    ) ph/cm2/s
Energy fluence (15-150 keV)             : 4.39227e-06 ( 0  0 ) ergs/cm2
Single BB
Spectral model blackbody:
------------------------------------------------------------
Parameters  : value    Lower 90%  Upper 90%
kT [keV]    : 13.2962  (  )
R^2/D10^2   : 4.00797E-02  (   )
(R is the radius in km and D10 is the distance to the source in units of 10 kpc)
------------------------------------------------------------
#Fit statistic : Chi-Squared =         163.37 using 59 PHA bins.
# Reduced chi-squared =         2.8662 for     57 degrees of freedom
# Null hypothesis probability =   3.341955e-12

Energy  Fluence     90% Error
[keV]   [erg/cm2]   [erg/cm2]
15- 25  4.001e-07   3.463e-08
25- 50  1.412e-06   7.686e-08
50-150  1.598e-06   1.479e-07
15-150  3.410e-06   1.825e-07
Thermal bremsstrahlung (OTTB)
Spectral model: thermal bremsstrahlung
------------------------------------------------------------
Parameters  : value         Lower 90%    Upper 90%
kT [keV]    : 130.310       (-25.3844      30.2452)
Norm        : 1.02142       (-0.0589144     0.0736036)
------------------------------------------------------------
#Fit statistic : Chi-Squared =          67.20 using 59 PHA bins.
# Reduced chi-squared =          1.179 for     57 degrees of freedom
# Null hypothesis probability =   1.672283e-01

Energy  Fluence     90% Error
[keV]   [erg/cm2]   [erg/cm2]
15- 25  7.059e-07   5.421e-08
25- 50  1.280e-06   8.711e-08
50-150  2.377e-06   6.896e-07
15-150  4.363e-06   7.219e-07
Double BB
Spectral model: bbodyrad<1> + bbodyrad<2>
------------------------------------------------------------
Parameters  : value         Lower 90%    Upper 90%
kT1 [keV]   : 6.39985        (-1.1294      1.32106)
R1^2/D10^2  : 0.366454        (-0.168888      0.375354)
kT2 [keV]   : 21.9105        (-3.14982      5.21702)
R2^2/D10^2  : 4.97406E-03    (-0.00281196   0.00432673)
------------------------------------------------------------
#Fit statistic : Chi-Squared =          71.79 using 59 PHA bins.
# Reduced chi-squared =          1.305 for     55 degrees of freedom
# Null hypothesis probability =   6.378272e-02

Energy  Fluence     90% Error
[keV]   [erg/cm2]   [erg/cm2]
15- 25  6.975e-07   1.118e-07
25- 50  1.285e-06   1.574e-07
50-150  2.310e-06   4.024e-07
15-150  4.293e-06   6.447e-07
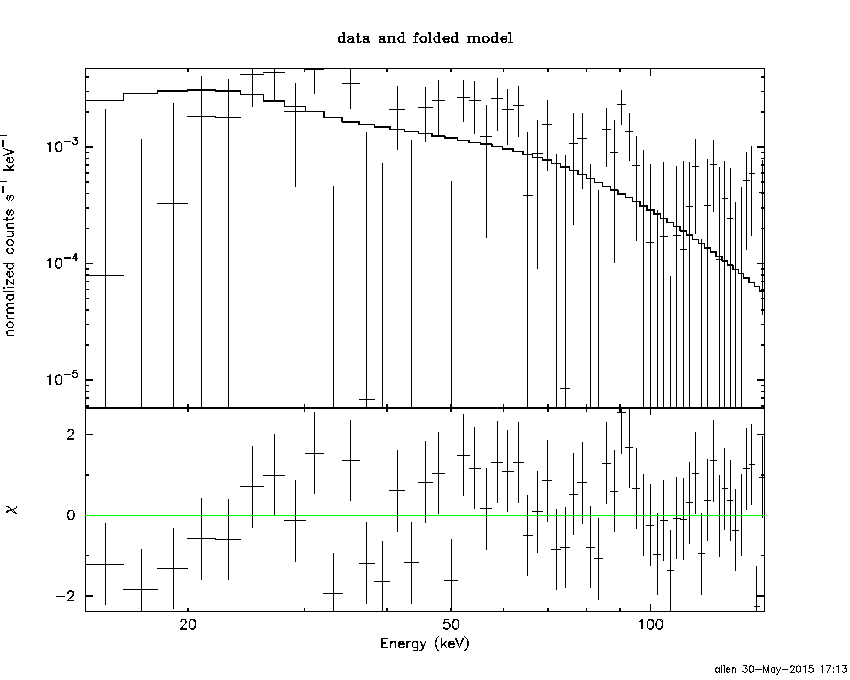
Peak spectrum fit
Power-law model
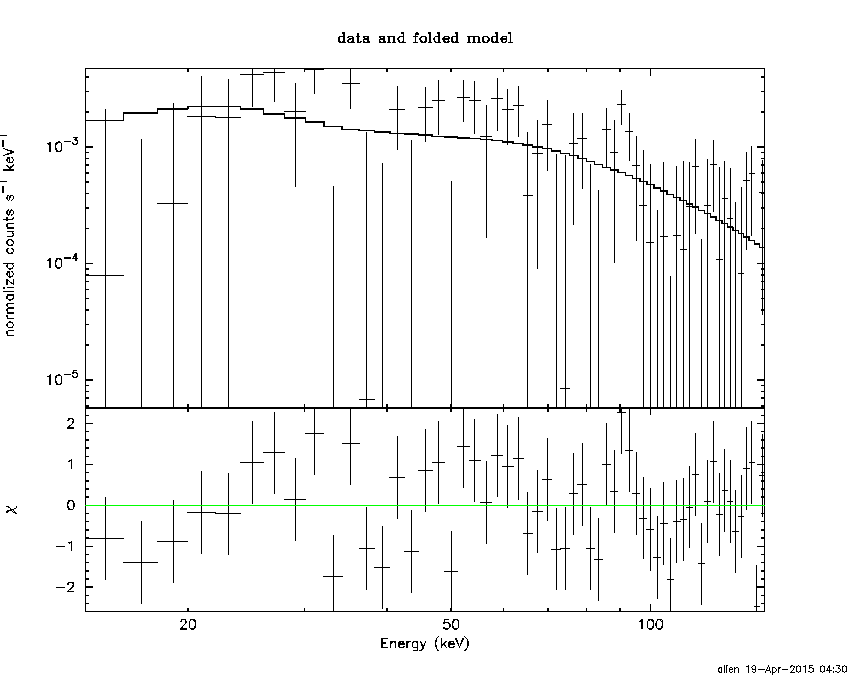
Time interval is from    8.408 sec. to    9.408 sec.

Spectral model in power-law:
------------------------------------------------------------
Parameters  : value       lower 90%   higher 90%
Photon index: 1.07164     ( -0.395927   0.362549 )
Norm@50keV  : 8.37679E-03    ( -0.00207923   0.00204806 )
------------------------------------------------------------
#Fit statistic : Chi-Squared =          64.44 using 59 PHA bins.
# Reduced chi-squared =          1.131 for     57 degrees of freedom
# Null hypothesis probability =   2.324737e-01

Photon flux (15-150 keV)    in 1 sec: 0.968963 ( -0.24625  0.249839 ) ph/cm2/s
Energy fluence (15-150 keV)             : 8.83912e-08 ( -2.12724e-08  2.13453e-08 ) ergs/cm2
Cutoff power-law model
Time interval is from    8.408 sec. to    9.408 sec.
Spectral model in the cutoff power-law:
------------------------------------------------------------
Parameters  : value       lower 90%   higher 90%
Photon index: -0.486965     ( -2.79894   1.66735 )
Epeak [keV] : 92.3355      ( -28.1256 -92.3222 )
Norm@50keV  : 4.07174E-02    ( -0.040736   0.474187 )
------------------------------------------------------------
#Fit statistic : Chi-Squared =          62.03 using 59 PHA bins.
# Reduced chi-squared =          1.108 for     56 degrees of freedom
# Null hypothesis probability =   2.699571e-01

Photon flux (15-150 keV)    in 1 sec: 0.927582 ( -0.248263  0.253678 ) ph/cm2/s
Energy fluence (15-150 keV)             : 8.46615e-08 ( -2.2428e-08  2.23515e-08 ) ergs/cm2
Band function
Time interval is from    8.408 sec. to    9.408 sec.

Spectral model in the Band function:
------------------------------------------------------------
Parameters  : value       lower 90%   higher 90%
alpha       : 5.00000   ( -5.70249   -5 )
beta        : -1.34892    ( -0.967697   0.479637 )
Epeak [keV] : 36.1034      ( -15.2214 19.1566 )
Norm@50keV   : 80.8242    ( -18.3644   1745.79 )
------------------------------------------------------------
#Fit statistic : Chi-Squared =          61.57 using 59 PHA bins.
# Reduced chi-squared =          1.119 for     55 degrees of freedom
# Null hypothesis probability =   2.528069e-01

Photon flux (15-150 keV)    in 1 sec:  (    ) ph/cm2/s
Energy fluence (15-150 keV)             : 8.50252e-08 ( 0  0 ) ergs/cm2
Single BB

Spectral model blackbody:
------------------------------------------------------------
Parameters  : value    Lower 90%  Upper 90%
kT [keV]    : 20.7783  (-4.617  6.79381)
R^2/D10^2   : 4.37039E-02  (-0.0268757   0.0581973)
(R is the radius in km and D10 is the distance to the source in units of 10 kpc)
------------------------------------------------------------
#Fit statistic : Chi-Squared =          62.53 using 59 PHA bins.
# Reduced chi-squared =          1.097 for     57 degrees of freedom
# Null hypothesis probability =   2.862983e-01

Energy  Fluence     90% Error
[keV]   [erg/cm2]   [erg/cm2]
15- 25  3.581e-09   1.777e-09
25- 50  1.828e-08   7.010e-09
50-150  5.878e-08   2.633e-08
15-150  8.065e-08   3.641e-08
Thermal bremsstrahlung (OTTB)
Spectral model: thermal bremsstrahlung
------------------------------------------------------------
Parameters  : value         Lower 90%    Upper 90%
kT [keV]    : 200.000       (      )
Norm        : 4.18398       (-1.03079     1.03058)
------------------------------------------------------------
#Fit statistic : Chi-Squared =          68.53 using 59 PHA bins.
# Reduced chi-squared =          1.202 for     57 degrees of freedom
# Null hypothesis probability =   1.409690e-01

Energy  Fluence     90% Error
[keV]   [erg/cm2]   [erg/cm2]
15- 25  1.043e-08   6.265e-09
25- 50  2.006e-08   1.199e-08
50-150  4.399e-08   2.608e-08
15-150  7.448e-08   4.343e-08
Double BB
#Fit statistic : Chi-Squared =          61.88 using 59 PHA bins.
#Fit statistic : Chi-Squared =          61.86 using 59 PHA bins.
#Fit statistic : Chi-Squared =          61.84 using 59 PHA bins.
# Reduced chi-squared =          1.126 for     55 degrees of freedom
# Reduced chi-squared =          1.125 for     55 degrees of freedom
# Reduced chi-squared =          1.125 for     55 degrees of freedom
# Reduced chi-squared =          1.125 for     55 degrees of freedom
# Reduced chi-squared =          1.124 for     55 degrees of freedom
# Null hypothesis probability =   2.419878e-01
# Null hypothesis probability =   2.436684e-01
# Null hypothesis probability =   2.440668e-01
# Null hypothesis probability =   2.445617e-01
# Null hypothesis probability =   2.451454e-01

Energy  Fluence     90% Error
[keV]   [erg/cm2]   [erg/cm2]
15- 25  4.747e-09   4.021e-09
25- 50  1.941e-08   1.913e-08
50-150  6.090e-08   6.610e-08
15-150  8.506e-08   7.470e-08
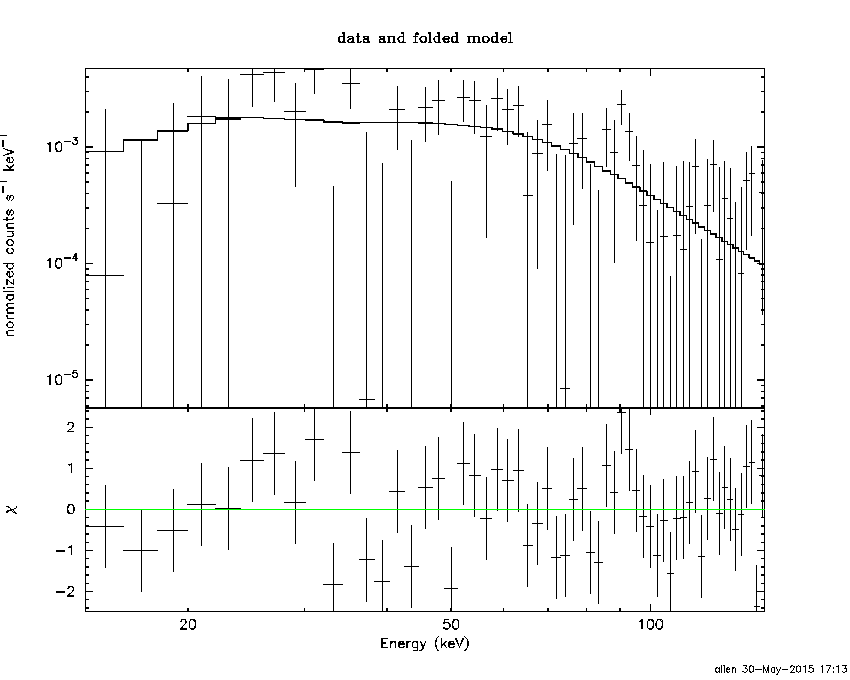
Pre-slew spectrum (Pre-slew PHA with pre-slew DRM)
Power-law model
Spectral model in power-law:
------------------------------------------------------------
Parameters  : value       lower 90%   higher 90%
Photon index: 1.26465     ( -0.11978   0.117646 )
Norm@50keV  : 3.56573E-03    ( -0.000253768   0.000253435 )
------------------------------------------------------------
#Fit statistic : Chi-Squared =          62.72 using 59 PHA bins.
# Reduced chi-squared =          1.100 for     57 degrees of freedom
# Null hypothesis probability =   2.806799e-01

Photon flux (15-150 keV)    in 59.18 sec: 0.422755 ( -0.0322839  0.0324052 ) ph/cm2/s
Energy fluence (15-150 keV)             : 2.10383e-06 ( -1.54189e-07  1.54449e-07 ) ergs/cm2
Cutoff power-law model
Spectral model in the cutoff power-law:
------------------------------------------------------------
Parameters  : value       lower 90%   higher 90%
Photon index: 0.674494     ( -0.560189   0.495385 )
Epeak [keV] : 124.973      ( -35.8662 305.815 )
Norm@50keV  : 6.67218E-03    ( -0.00267684   0.00514374 )
------------------------------------------------------------
#Fit statistic : Chi-Squared =          58.52 using 59 PHA bins.
# Reduced chi-squared =          1.045 for     56 degrees of freedom
# Null hypothesis probability =   3.831132e-01

Photon flux (15-150 keV)    in 59.18 sec: 0.412751 ( -0.033335  0.033438 ) ph/cm2/s
Energy fluence (15-150 keV)             : 2.0521e-06 ( -1.63899e-07  1.62692e-07 ) ergs/cm2
Band function

Spectral model in the Band function:
------------------------------------------------------------
Parameters  : value       lower 90%   higher 90%
alpha       : 1.79863   ( -2.5334   -1.80112 )
beta        : -1.45820    ( 1.45815   0.189817 )
Epeak [keV] : 42.3069      ( -11.2756 81.3637 )
Norm@50keV   : 0.285504    ( -0.289686   26.9133 )
------------------------------------------------------------
#Fit statistic : Chi-Squared =          56.10 using 59 PHA bins.
# Reduced chi-squared =          1.020 for     55 degrees of freedom
# Null hypothesis probability =   4.334658e-01

Photon flux (15-150 keV)    in 59.18 sec:  (    ) ph/cm2/s
Energy fluence (15-150 keV)             : 0 ( 0  0 ) ergs/cm2
S(25-50 keV) vs. S(50-100 keV) plot
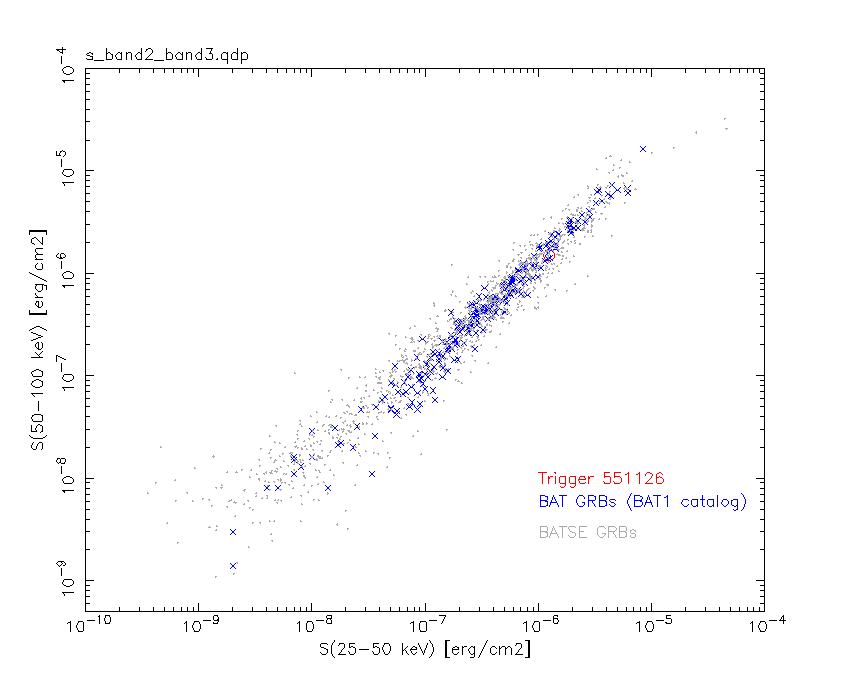
S(25-50 keV)  = 1.24e-06
S(50-100 keV) = 1.50e-06
T90 vs. Hardness ratio plot
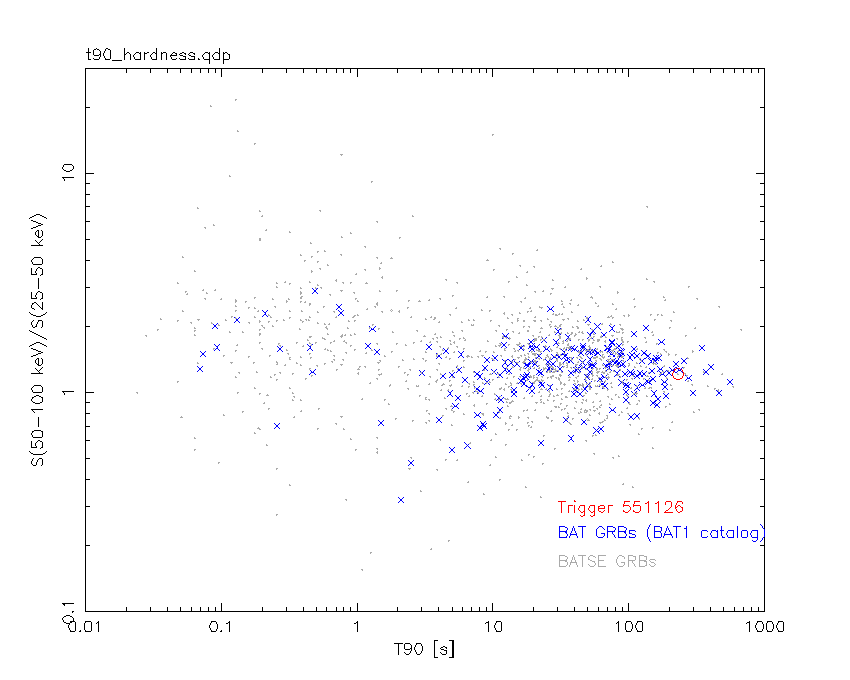
T90                                   = 230.507999956608 sec.
Hardness ratio (energy fluence ratio) = 1.20968
Color vs. Color plot
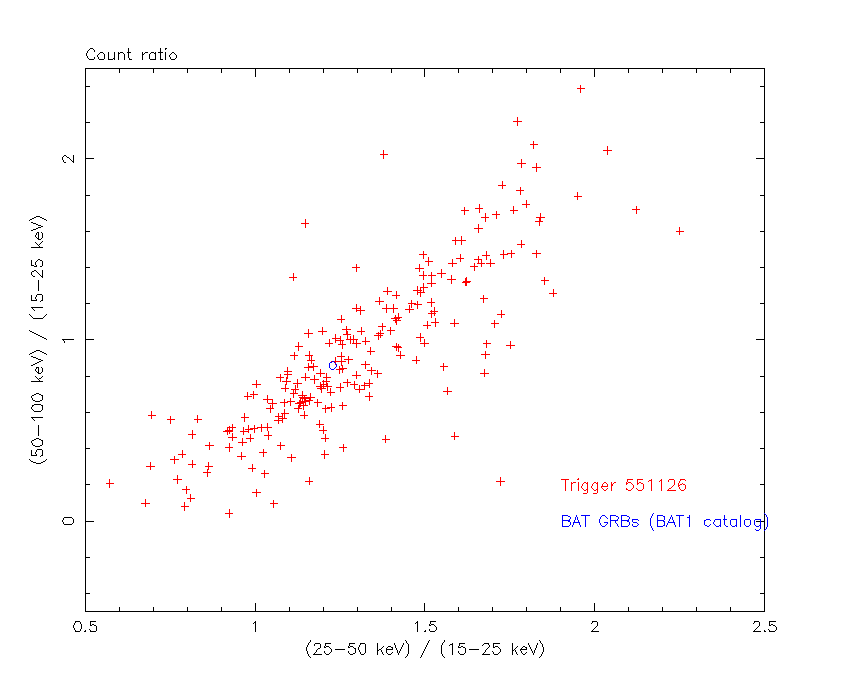
Count Ratio  (25-50 keV) / (15-25 keV) = 1.22846
Count Ratio (50-100 keV) / (15-25 keV) = 0.858568
Mask shadow pattern
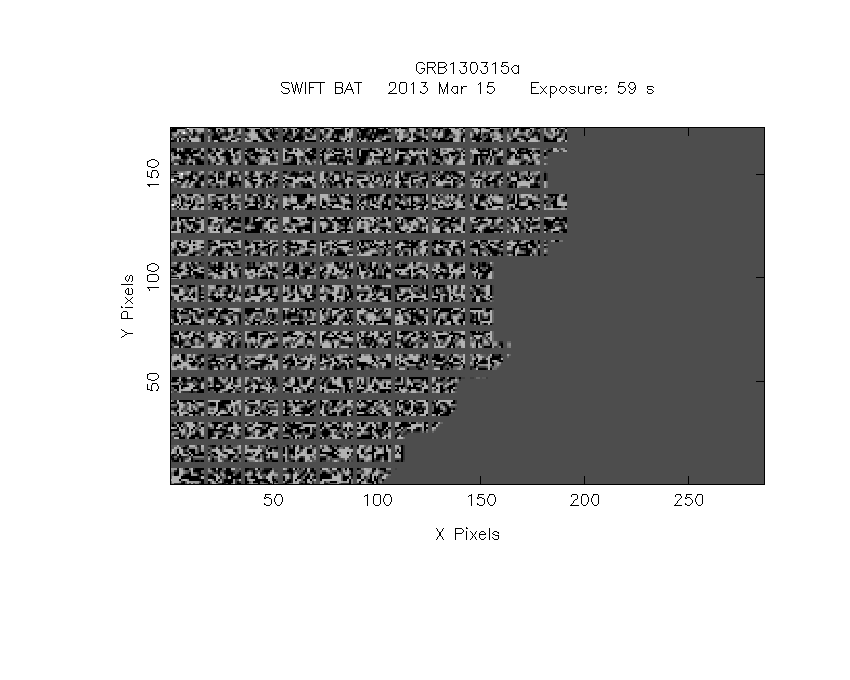
IMX = 9.652878819943155E-01, IMY = 9.332824055802651E-03
TIME vs. PHA plot around the trigger time
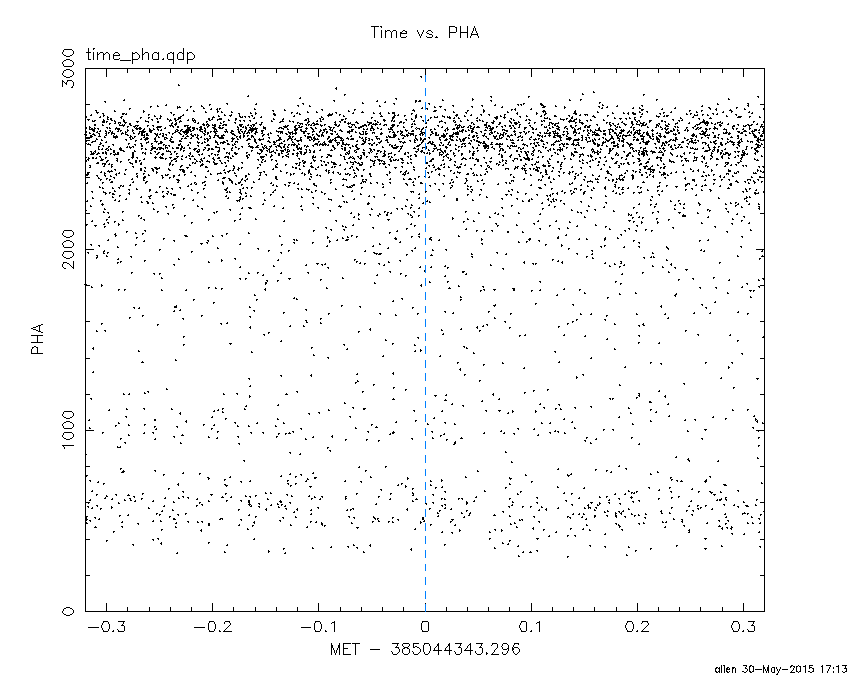
Blue+Cyan dotted lines: Time interval of the scaled map
From 0.000000 to 12.160000
TIME vs. DetID plot around the trigger time
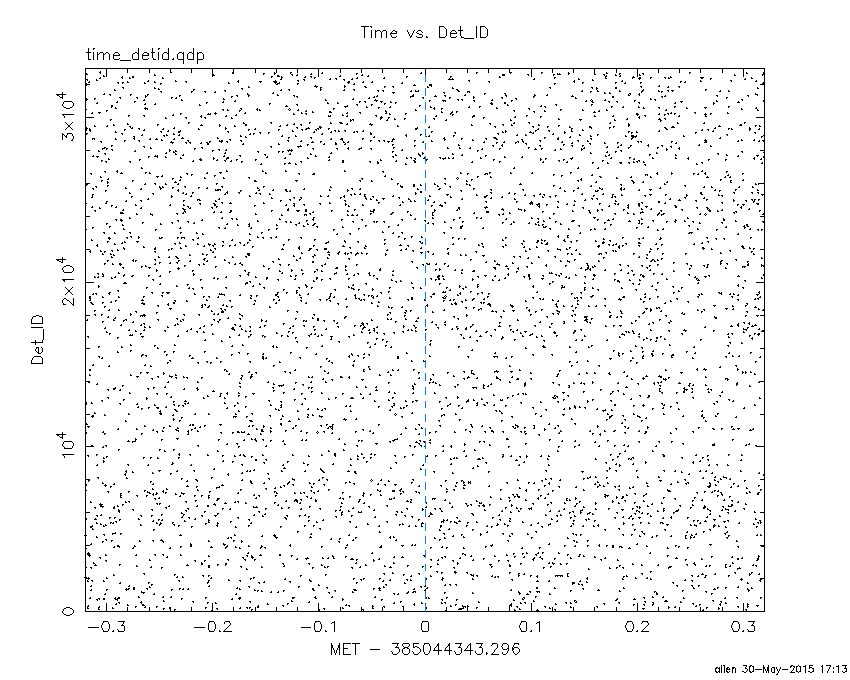
Blue+Cyan dotted lines: Time interval of the scaled map
From 0.000000 to 12.160000
100 us light curve (15-350 keV)

Blue+Cyan dotted lines: Time interval of the scaled map
From 0.000000 to 12.160000
Spacecraft aspect plot

Bright source in the pre-burst/pre-slew/post-slew images
Pre-burst image of 15-350 keV band
Time interval of the image:
-239.296000 1.624000

# RAcent  DECcent POSerr Theta    Phi  PeakCts   SNR AngSep     Name
#  [deg]    [deg]    ['] [deg]  [deg]                   [']
135.5418 -40.6005    4.6  50.9   23.3   1.9344   2.5    2.8	Vela X-1
170.5743 -60.6067    5.0  47.9  -15.4   0.8009   2.3    7.7	Cen X-3
186.3186 -62.7987  178.7  48.9  -25.7  -0.0241  -0.1    9.4	GX 301-2
172.3388  30.5519    2.2  46.2  139.1   3.8983   5.2 ------	UNKNOWN
133.6641 -51.7266    2.6  55.9   10.8   4.5460   4.4 ------	UNKNOWN
202.4839  -5.9203    3.0  18.6 -139.0   0.6835   3.8 ------	UNKNOWN
225.2939  31.0733    2.2  59.1 -165.4   7.3814   5.4 ------	UNKNOWN
162.5097 -71.8780    3.1  59.6  -17.1   4.5594   3.7 ------	UNKNOWN
193.0761 -62.9208    3.3  49.3  -29.8   1.3724   3.6 ------	UNKNOWN
Pre-slew background subtracted image of 15-350 keV band
Time interval of the image:
1.624000 60.804600

# RAcent  DECcent POSerr Theta    Phi  PeakCts   SNR AngSep     Name
#  [deg]    [deg]    ['] [deg]  [deg]                   [']
135.4848 -40.4281    5.5  50.9   23.5  -0.7477  -2.1    7.9	Vela X-1
170.2624 -60.5589    3.9  47.9  -15.2   0.4670   3.0    4.2	Cen X-3
186.3233 -62.8733   10.3  49.0  -25.7   0.2186   1.1   11.0	GX 301-2
157.5419 -51.7953    0.6  44.0   -0.6   3.0019  20.1 ------	UNKNOWN
165.1126 -70.2632    2.2  57.7  -17.2   2.0820   5.2 ------	UNKNOWN
Post-slew image of 15-350 keV band
Time interval of the image:
148.604600 585.904650

# RAcent  DECcent POSerr Theta    Phi  PeakCts   SNR AngSep     Name
#  [deg]    [deg]    ['] [deg]  [deg]                   [']
135.5866 -40.5201    1.8  18.8    6.5   1.7071   6.6    3.4	Vela X-1
170.4059 -60.5864    1.6  11.3 -145.5   2.1937   7.1    3.4	Cen X-3
186.3369 -62.8533    6.8  18.8 -154.5   0.5168   1.7   10.1	GX 301-2
145.1730 -16.6425    3.5  36.5   48.2   1.7409   3.3 ------	UNKNOWN
157.5321 -51.7906    0.8   0.0  -81.0   3.5937  13.8 ------	UNKNOWN
 50.1829 -81.9327    3.3  41.2  -99.9   6.1717   3.5 ------	UNKNOWN
Plot creation:
Sat May 30 17:14:02 EDT 2015