Click here for the BAT GCN circular template
Image
Pre-slew 15.0-350.0 keV image (Event data)
#   RAcent    DECcent   POSerr    Theta     Phi              Peak Cts       SNR   Name
  355.2693     9.9167   0.0224    23.2316  -133.1994         1.3227284      8.564 TRIG_00553918

Foreground time interval of the image:
 30.088 169.508 (delta_t = 139.420 [sec])
Background time interval of the image:
-239.000  30.088 (delta_t = 269.088 [sec])
Lightcurves
Notes:
- 1) The mask-weighted light curves are using the flight position.
- 2) Multiple plots of different time binning/intervals are shown to cover all scenarios of short/long GRBs, rate/image triggers, and real/false positives.
- 3) For all the mask-weighted lightcurves, the y-axis units are counts/sec/det where a det is 0.4 x 0.4 = 0.16 sq cm.
- 4) The verticle lines correspond to following: green dotted lines are T50 interval, black dotted lines are T90 interval, blue solid line(s) is a spacecraft slew start time, and orange solid line(s) is a spacecraft slew end time.
- 5) Time of each bin is in the middle of the bin.
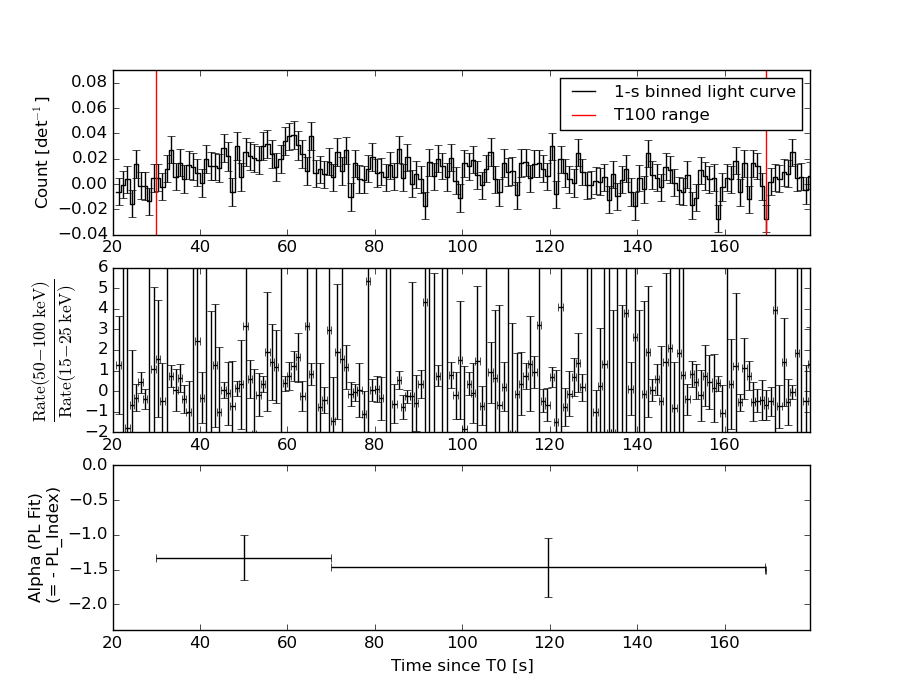
1 s binning
From T0-310 s to T0+310 s

From T100_start - 20 s to T100_end + 30 s
Full time interval
64 ms binning
Full time interval

From T100_start to T100_end
From T0-5 sec to T0+5 sec
16 ms binning
From T100_start-5 s to T100_start+5 s
Blue+Cyan dotted lines: Time interval of the scaled map
From 0.000000 to 112.000000
8 ms binning
From T100_start-3 s to T100_start+3 s
Blue+Cyan dotted lines: Time interval of the scaled map
From 0.000000 to 112.000000
2 ms binning
From T100_start-1 s to T100_start+1 s
Blue+Cyan dotted lines: Time interval of the scaled map
From 0.000000 to 112.000000
SN=5 or 10 sec. binning (whichever binning is satisfied first)
SN=5 or 10 sec. binning (T < 200 sec)

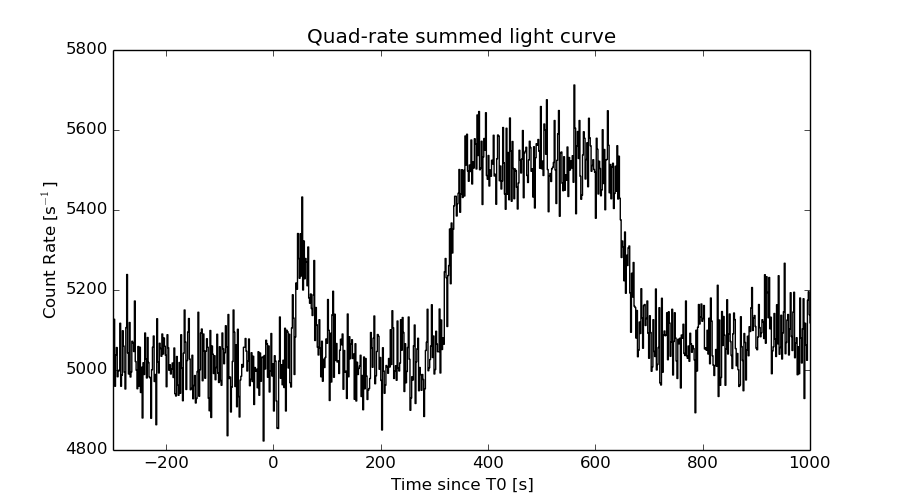
Quad-rate summed light curves (from T0-300s to T0+1000s)
Spectral Evolution
Spectra
Notes:
- 1) The fitting includes the systematic errors.
- 2) When the burst includes telescope slew time periods, the fitting uses an average response file made from multiple 5-s response files through out the slew time plus single time preiod for the non-slew times, and weighted by the total counts in the corresponding time period using addrmf. An average response file is needed becuase a spectral fit using the pre-slew DRM will introduce some errors in both a spectral shape and a normalization if the PHA file contains a lot of the slew/post-slew time interval.
- 3) For fits to more complicated models (e.g. a power-law over a cutoff power-law), the BAT team has decided to require a chi-square improvement of more than 6 for each extra dof.
Time averaged spectrum fit using the average DRM
Power-law model

Time interval is from   30.088 sec. to  169.508 sec.

Spectral model in power-law:
------------------------------------------------------------
Parameters  : value       lower 90%   higher 90%
Photon index: 1.40361     ( -0.272155   0.273367 )
Norm@50keV  : 6.27000E-04    ( -9.89179e-05   9.82929e-05 )
------------------------------------------------------------
#Fit statistic : Chi-Squared =          53.15 using 59 PHA bins.
# Reduced chi-squared =         0.9325 for     57 degrees of freedom
# Null hypothesis probability =   6.201383e-01

Photon flux (15-150 keV)    in 139.4 sec: 7.64194E-02 ( -0.0119852  0.0120064 ) ph/cm2/s
Energy fluence (15-150 keV)             : 8.43936e-07 ( -1.47475e-07  1.49835e-07 ) ergs/cm2
Cutoff power-law model
Time interval is from   30.088 sec. to  169.508 sec.
Spectral model in the cutoff power-law:
------------------------------------------------------------
Parameters  : value       lower 90%   higher 90%
Photon index: 1.05050     ( -1.34622   0.608903 )
Epeak [keV] : 135.769      ( -135.769 -135.769 )
Norm@50keV  : 9.43760E-04    ( -0.000408215   0.00334225 )
------------------------------------------------------------
#Fit statistic : Chi-Squared =          52.85 using 59 PHA bins.
# Reduced chi-squared =         0.9438 for     56 degrees of freedom
# Null hypothesis probability =   5.948192e-01

Photon flux (15-150 keV)    in 139.4 sec: 7.52513E-02 ( -0.0126155  0.0125037 ) ph/cm2/s
Energy fluence (15-150 keV)             : 8.21502e-07 ( -1.6463e-07  1.6376e-07 ) ergs/cm2
Band function
Time interval is from   30.088 sec. to  169.508 sec.

Spectral model in the Band function:
------------------------------------------------------------
Parameters  : value       lower 90%   higher 90%
alpha       : -0.959928   ( 0.959897   5.94355 )
beta        : -1.66519    ( 1.67778   0.528101 )
Epeak [keV] : 113.292      ( -114.254 -114.254 )
Norm@50keV   : 1.06066E-03    ( -0.000416181   0 )
------------------------------------------------------------
#Fit statistic : Chi-Squared =          52.81 using 59 PHA bins.
# Reduced chi-squared =         0.9602 for     55 degrees of freedom
# Null hypothesis probability =   5.586617e-01

Photon flux (15-150 keV)    in 139.4 sec:  (    ) ph/cm2/s
Energy fluence (15-150 keV)             : 0 ( 0  0 ) ergs/cm2
Single BB

Spectral model blackbody:
------------------------------------------------------------
Parameters  : value    Lower 90%  Upper 90%
kT [keV]    : 15.8171  (-2.79672  3.60469)
R^2/D10^2   : 7.37395E-03  (-0.003748   0.00711781)
(R is the radius in km and D10 is the distance to the source in units of 10 kpc)
------------------------------------------------------------
#Fit statistic : Chi-Squared =          60.01 using 59 PHA bins.
# Reduced chi-squared =          1.053 for     57 degrees of freedom
# Null hypothesis probability =   3.673354e-01

Energy  Fluence     90% Error
[keV]   [erg/cm2]   [erg/cm2]
15- 25  5.331e-08   1.791e-08
25- 50  2.221e-07   5.901e-08
50-150  3.867e-07   1.283e-07
15-150  6.621e-07   1.753e-07
Thermal bremsstrahlung (OTTB)

Spectral model: thermal bremsstrahlung
------------------------------------------------------------
Parameters  : value         Lower 90%    Upper 90%
kT [keV]    : 199.358       (-78.2434      -199.361)
Norm        : 0.314731       (-0.0485445     0.0486576)
------------------------------------------------------------
#Fit statistic : Chi-Squared =          53.71 using 59 PHA bins.
# Reduced chi-squared =         0.9422 for     57 degrees of freedom
# Null hypothesis probability =   5.993549e-01

Energy  Fluence     90% Error
[keV]   [erg/cm2]   [erg/cm2]
15- 25  1.092e-07   6.275e-08
25- 50  2.102e-07   1.185e-07
50-150  4.609e-07   2.596e-07
15-150  7.803e-07   4.404e-07
Double BB
Spectral model: bbodyrad<1> + bbodyrad<2>
------------------------------------------------------------
Parameters  : value         Lower 90%    Upper 90%
kT1 [keV]   : 4.45315        (-3.48522      9.79113)
R1^2/D10^2  : 0.322375        (-0.307841      45.9759)
kT2 [keV]   : 19.9989        (-5.0689      -20.0251)
R2^2/D10^2  : 2.97550E-03    (-0.00292364   0.00516912)
------------------------------------------------------------
#Fit statistic : Chi-Squared =          53.62 using 59 PHA bins.
# Reduced chi-squared =         0.9749 for     55 degrees of freedom
# Null hypothesis probability =   5.275000e-01

Energy  Fluence     90% Error
[keV]   [erg/cm2]   [erg/cm2]
15- 25  9.913e-08   5.317e-08
25- 50  1.919e-07   9.303e-08
50-150  4.731e-07   2.774e-07
15-150  7.641e-07   3.685e-07
Peak spectrum fit
Power-law model
Time interval is from   61.200 sec. to   62.200 sec.

Spectral model in power-law:
------------------------------------------------------------
Parameters  : value       lower 90%   higher 90%
Photon index: 0.901505     ( -0.642544   0.565347 )
Norm@50keV  : 3.74406E-03    ( -0.00126444   0.00120499 )
------------------------------------------------------------
#Fit statistic : Chi-Squared =          54.38 using 59 PHA bins.
# Reduced chi-squared =         0.9539 for     57 degrees of freedom
# Null hypothesis probability =   5.741676e-01

Photon flux (15-150 keV)    in 1 sec: 0.429748 ( -0.139326  0.141704 ) ph/cm2/s
Energy fluence (15-150 keV)             : 4.19942e-08 ( -1.35591e-08  1.37197e-08 ) ergs/cm2
Cutoff power-law model

Time interval is from   61.200 sec. to   62.200 sec.
Spectral model in the cutoff power-law:
------------------------------------------------------------
Parameters  : value       lower 90%   higher 90%
Photon index: 0.266067     ( -7.09796   -0.249036 )
Epeak [keV] : 171.446      ( -167.815 -167.815 )
Norm@50keV  : 6.68657E-03    ( -0.00420821   1.87305 )
------------------------------------------------------------
#Fit statistic : Chi-Squared =          54.23 using 59 PHA bins.
# Reduced chi-squared =         0.9685 for     56 degrees of freedom
# Null hypothesis probability =   5.419940e-01

Photon flux (15-150 keV)    in 1 sec: 0.413982 ( -0.167664  0.153092 ) ph/cm2/s
Energy fluence (15-150 keV)             : 4.1004e-08 ( -1.45522e-08  1.43509e-08 ) ergs/cm2
Band function
Time interval is from   61.200 sec. to   62.200 sec.

Spectral model in the Band function:
------------------------------------------------------------
Parameters  : value       lower 90%   higher 90%
alpha       : -0.160546   ( 0.790059   0.790059 )
beta        : -1.54426    ( 1.54337   1.54337 )
Epeak [keV] : 155.096      ( -155.093 -155.093 )
Norm@50keV   : 7.36661E-03    ( -0.00736593   346636 )
------------------------------------------------------------
#Fit statistic : Chi-Squared =          54.22 using 59 PHA bins.
# Reduced chi-squared =         0.9858 for     55 degrees of freedom
# Null hypothesis probability =   5.045074e-01

Photon flux (15-150 keV)    in 1 sec:  (    ) ph/cm2/s
Energy fluence (15-150 keV)             : 0 ( 0  0 ) ergs/cm2
Single BB
Spectral model blackbody:
------------------------------------------------------------
Parameters  : value    Lower 90%  Upper 90%
kT [keV]    : 24.6152  (-7.60698  15.9472)
R^2/D10^2   : 1.12141E-02  (-0.0112141   0.0247742)
(R is the radius in km and D10 is the distance to the source in units of 10 kpc)
------------------------------------------------------------
#Fit statistic : Chi-Squared =          54.57 using 59 PHA bins.
# Reduced chi-squared =         0.9574 for     57 degrees of freedom
# Null hypothesis probability =   5.667346e-01

Energy  Fluence     90% Error
[keV]   [erg/cm2]   [erg/cm2]
15- 25  1.190e-09   7.640e-10
25- 50  6.698e-09   4.162e-09
50-150  3.015e-08   1.909e-08
15-150  3.804e-08   2.416e-08
Thermal bremsstrahlung (OTTB)

Spectral model: thermal bremsstrahlung
------------------------------------------------------------
Parameters  : value         Lower 90%    Upper 90%
kT [keV]    : 199.363       (-94.0777      -199.363)
Norm        : 1.78773       (-0.586003     0.586036)
------------------------------------------------------------
#Fit statistic : Chi-Squared =          58.11 using 59 PHA bins.
# Reduced chi-squared =          1.019 for     57 degrees of freedom
# Null hypothesis probability =   4.342648e-01

Energy  Fluence     90% Error
[keV]   [erg/cm2]   [erg/cm2]
15- 25  4.452e-09   2.811e-09
25- 50  8.563e-09   5.155e-09
50-150  1.878e-08   1.170e-08
15-150  3.180e-08   2.049e-08
Double BB
Spectral model: bbodyrad<1> + bbodyrad<2>
------------------------------------------------------------
Parameters  : value         Lower 90%    Upper 90%
kT1 [keV]   : 2.93028        (-2.83765      40.1487)
R1^2/D10^2  : 14.2638        (-14.8015      442.672)
kT2 [keV]   : 26.9229        (-8.70439      22.4271)
R2^2/D10^2  : 8.25246E-03    (-0.0082807   0.0200321)
------------------------------------------------------------
#Fit statistic : Chi-Squared =          52.68 using 59 PHA bins.
# Reduced chi-squared =         0.9578 for     55 degrees of freedom
# Null hypothesis probability =   5.638755e-01

Energy  Fluence     90% Error
[keV]   [erg/cm2]   [erg/cm2]
15- 25  3.299e-09   1.823e-09
25- 50  6.178e-09   3.681e-09
50-150  3.110e-08   1.919e-08
15-150  4.057e-08   2.374e-08
Pre-slew spectrum (Pre-slew PHA with pre-slew DRM)
Power-law model

Spectral model in power-law:
------------------------------------------------------------
Parameters  : value       lower 90%   higher 90%
Photon index: 1.40361     ( -0.272155   0.273367 )
Norm@50keV  : 6.27000E-04    ( -9.89179e-05   9.82929e-05 )
------------------------------------------------------------
#Fit statistic : Chi-Squared =          53.15 using 59 PHA bins.
# Reduced chi-squared =         0.9325 for     57 degrees of freedom
# Null hypothesis probability =   6.201383e-01

Photon flux (15-150 keV)    in 139.4 sec: 7.64194E-02 ( -0.0119852  0.0120064 ) ph/cm2/s
Energy fluence (15-150 keV)             : 8.43936e-07 ( -1.47475e-07  1.49835e-07 ) ergs/cm2
Cutoff power-law model

Spectral model in the cutoff power-law:
------------------------------------------------------------
Parameters  : value       lower 90%   higher 90%
Photon index: 1.05050     ( -1.34622   0.608903 )
Epeak [keV] : 135.769      ( -135.769 -135.769 )
Norm@50keV  : 9.43760E-04    ( -0.000408215   0.00334225 )
------------------------------------------------------------
#Fit statistic : Chi-Squared =          52.85 using 59 PHA bins.
# Reduced chi-squared =         0.9438 for     56 degrees of freedom
# Null hypothesis probability =   5.948192e-01

Photon flux (15-150 keV)    in 139.4 sec: 7.52513E-02 ( -0.0126155  0.0125037 ) ph/cm2/s
Energy fluence (15-150 keV)             : 8.21502e-07 ( -1.6463e-07  1.6376e-07 ) ergs/cm2
Band function

Spectral model in the Band function:
------------------------------------------------------------
Parameters  : value       lower 90%   higher 90%
alpha       : -0.959928   ( 0.959897   5.94355 )
beta        : -1.66519    ( 1.67778   0.528101 )
Epeak [keV] : 113.292      ( -114.254 -114.254 )
Norm@50keV   : 1.06066E-03    ( -0.000416181   0 )
------------------------------------------------------------
#Fit statistic : Chi-Squared =          52.81 using 59 PHA bins.
# Reduced chi-squared =         0.9602 for     55 degrees of freedom
# Null hypothesis probability =   5.586617e-01

Photon flux (15-150 keV)    in 139.4 sec:  (    ) ph/cm2/s
Energy fluence (15-150 keV)             : 0 ( 0  0 ) ergs/cm2
S(25-50 keV) vs. S(50-100 keV) plot

S(25-50 keV)  = 1.99e-07
S(50-100 keV) = 3.00e-07
T90 vs. Hardness ratio plot

T90                                   = 85.5839999318123 sec.
Hardness ratio (energy fluence ratio) = 1.50754
Color vs. Color plot
Count Ratio  (25-50 keV) / (15-25 keV) = 1.45072
Count Ratio (50-100 keV) / (15-25 keV) = 1.02414
Mask shadow pattern
IMX = -2.938410813622833E-01, IMY = 3.129159711550278E-01
TIME vs. PHA plot around the trigger time
Blue+Cyan dotted lines: Time interval of the scaled map
From 0.000000 to 112.000000
TIME vs. DetID plot around the trigger time

Blue+Cyan dotted lines: Time interval of the scaled map
From 0.000000 to 112.000000
100 us light curve (15-350 keV)
Blue+Cyan dotted lines: Time interval of the scaled map
From 0.000000 to 112.000000
Spacecraft aspect plot
Bright source in the pre-burst/pre-slew/post-slew images
Pre-burst image of 15-350 keV band
Time interval of the image:
-239.000000 30.088000

# RAcent  DECcent POSerr Theta    Phi  PeakCts   SNR AngSep     Name
#  [deg]    [deg]    ['] [deg]  [deg]                   [']
326.2914  38.2185    7.3  49.1  174.3  -0.8172  -1.6    8.4	Cyg X-2
302.5113  14.4936    3.0  45.0  130.8   3.4091   3.9 ------	UNKNOWN
324.8757  38.7468    3.4  49.9  173.2   1.8019   3.4 ------	UNKNOWN
347.6212 -21.7052    2.0  14.2  -14.1   1.1126   5.8 ------	UNKNOWN
354.9746  23.0301    2.5  34.5 -147.5   1.2135   4.6 ------	UNKNOWN
 24.3641 -51.8975    2.9  55.5  -20.6   2.7271   4.0 ------	UNKNOWN
355.3639  48.6739    5.8  58.7 -159.2   2.8779   2.0 ------	UNKNOWN
  4.5723  36.9978    2.6  50.7 -146.0   2.6106   4.4 ------	UNKNOWN
 25.5260 -17.3767    3.6  43.7  -63.9   3.3289   3.2 ------	UNKNOWN
 23.5268  -8.8829    2.6  41.6  -76.4   3.7168   4.5 ------	UNKNOWN
 12.9839  31.9586    2.0  50.7 -134.9   6.4047   5.7 ------	UNKNOWN
Pre-slew background subtracted image of 15-350 keV band
Time interval of the image:
30.088000 169.508000

# RAcent  DECcent POSerr Theta    Phi  PeakCts   SNR AngSep     Name
#  [deg]    [deg]    ['] [deg]  [deg]                   [']
326.2729  38.2578   22.1  49.1  174.3   0.1894   0.5    6.1	Cyg X-2
355.2693   9.9166    1.3  23.2 -133.2   1.3228   8.6 ------	UNKNOWN
349.2826  41.0764    2.1  50.4 -162.2   1.8750   5.5 ------	UNKNOWN
 18.2583  12.7482    2.2  42.5 -109.9   2.9209   5.1 ------	UNKNOWN
Post-slew image of 15-350 keV band
Time interval of the image:
365.300600 621.700600

# RAcent  DECcent POSerr Theta    Phi  PeakCts   SNR AngSep     Name
#  [deg]    [deg]    ['] [deg]  [deg]                   [']
 83.6314  22.0152    0.3  27.7   -8.0  10.8989  46.1    0.1	Crab
122.3553  17.9037    3.0  44.6   50.0   3.3283   3.8 ------	UNKNOWN
103.9201  20.8337    2.3  32.9   28.6   1.4428   4.9 ------	UNKNOWN
 76.9936 -59.4684    3.3  54.1  177.1   3.3443   3.5 ------	UNKNOWN
 63.3572  -2.3180    2.1  20.8  -88.9   1.3521   5.4 ------	UNKNOWN
 44.2583 -48.8717    2.7  54.7 -156.3   3.6959   4.2 ------	UNKNOWN
Plot creation:
Sat May 30 17:09:01 EDT 2015