Click here for the BAT GCN circular template
Image
Pre-slew 15-350 keV image (Event data; bkg subtracted)
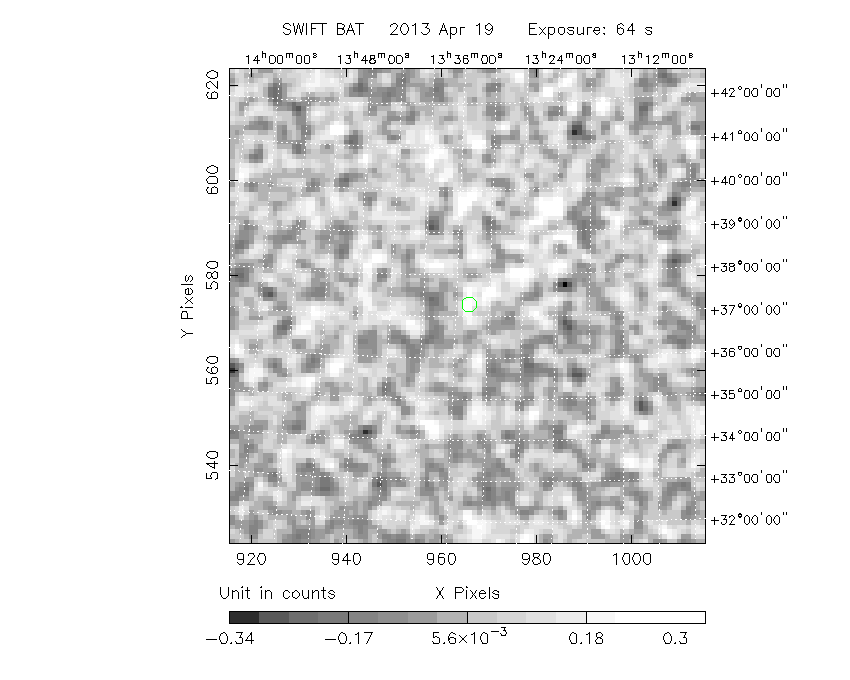
# RAcent DECcent POSerr Theta Phi Peak Cts SNR Name
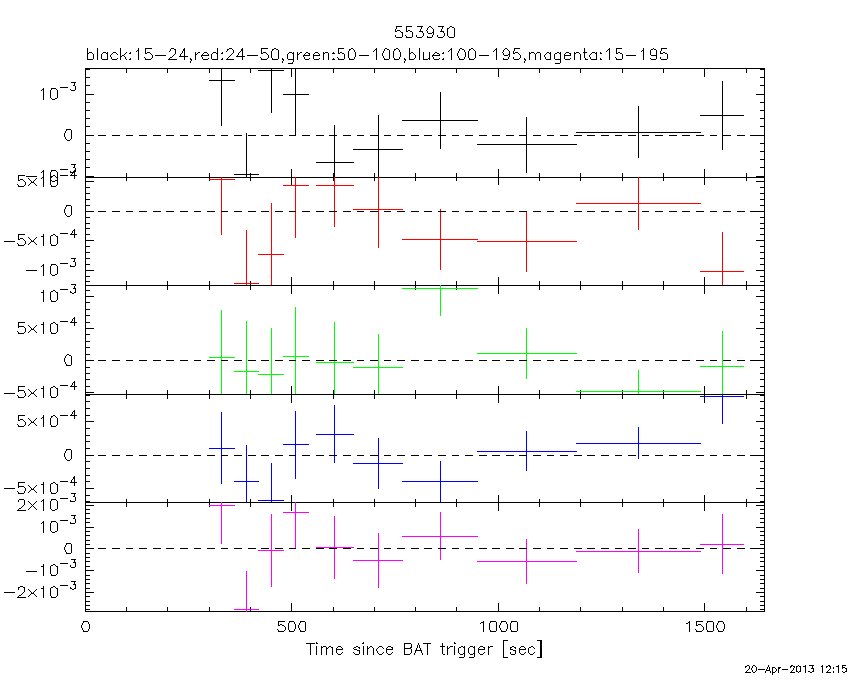
203.5988 +37.2893 0.0856 15.3 -131.6 0.2183 2.2 TRIG_00553930
------------------------------------------
Foreground time interval of the image:
0.000 64.000 (delta_t = 64.000 [sec])
Background time interval of the image:
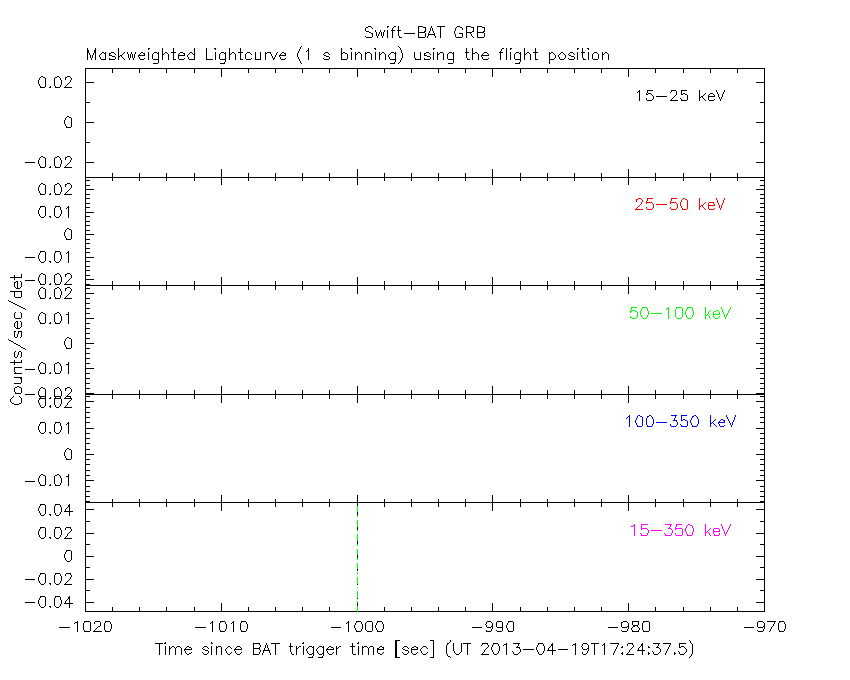
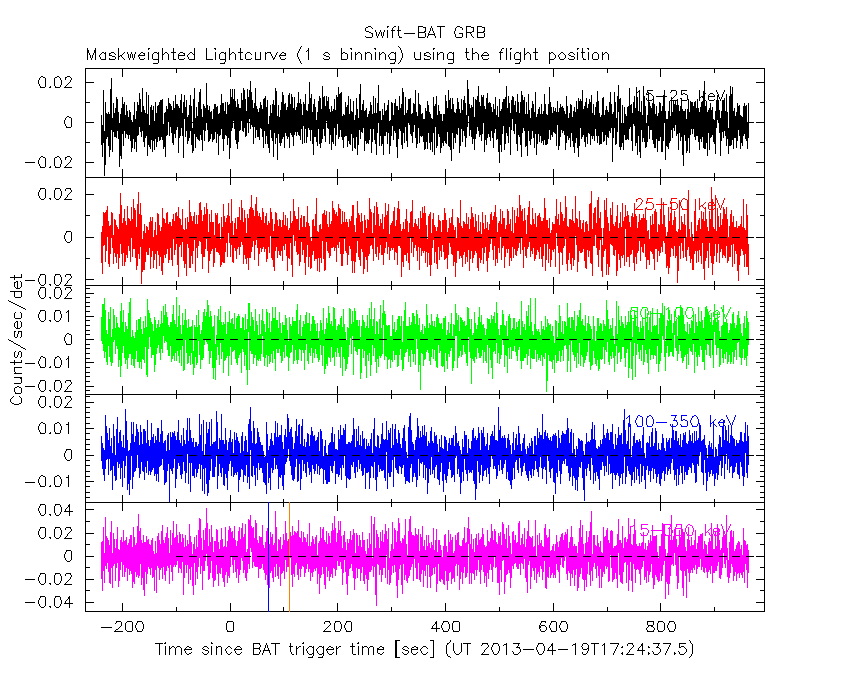
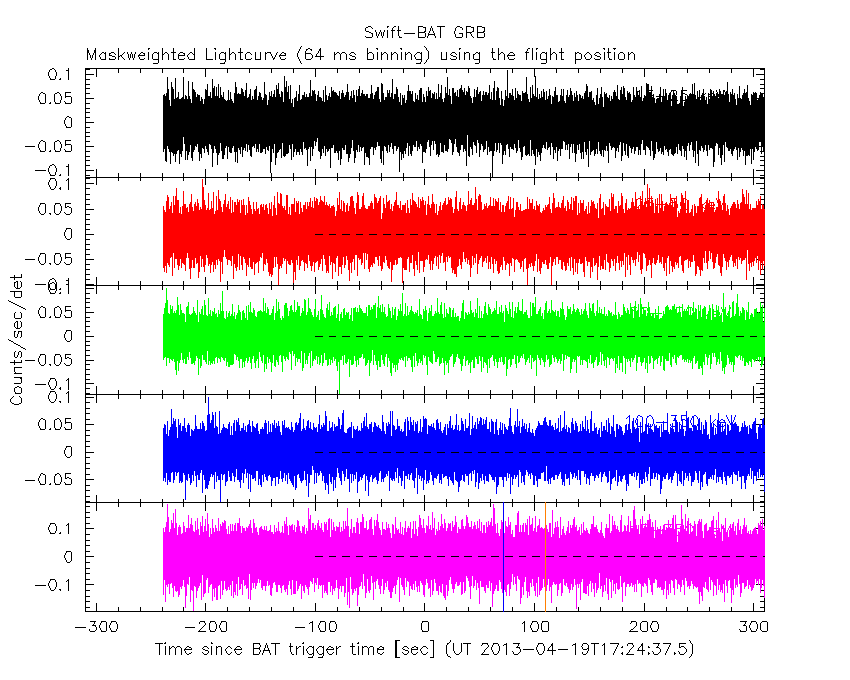
Lightcurves
Notes:
- 1) All plots contain as much data as has been downloaded to date.
- 2) The mask-weighted light curves are using the flight position.
- 3) Multiple plots of different time binning/intervals are shown to cover all scenarios of short/long GRBs, rate/image triggers, and real/false positives.
- 4) For all the mask-weighted lightcurves, the y-axis units are counts/sec/det where a det is 0.4 x 0.4 = 0.16 sq cm.
- 5) The verticle lines correspond to following: green dotted lines are T50 interval, black dotted lines are T90 interval, blue solid line(s) is a spacecraft slew start time, and orange solid line(s) is a spacecraft slew end time.
- 6) Time of each bin is in the middle of the bin.
1 s binning
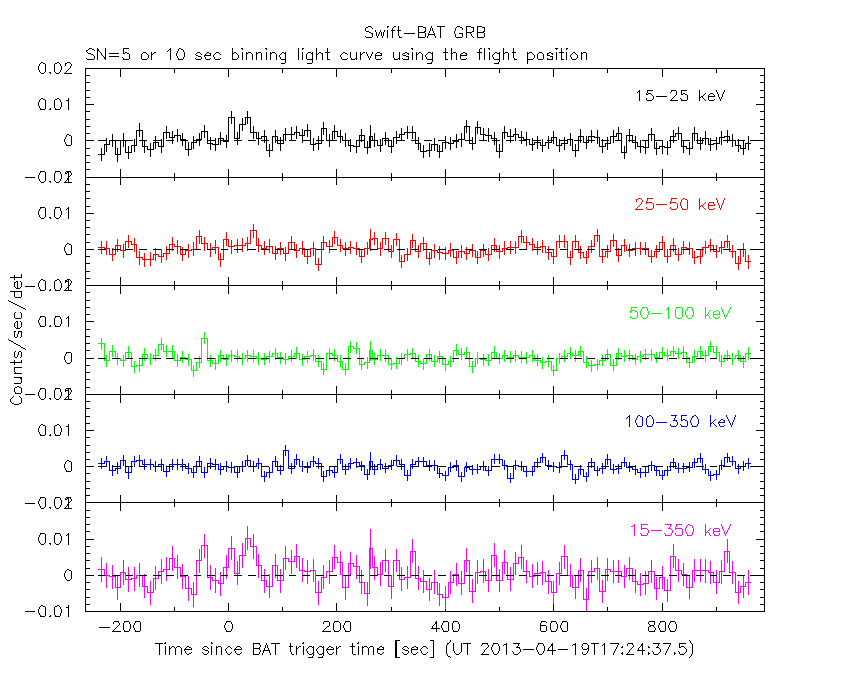
From T0-310 s to T0+310 s

From T100_start - 20 s to T100_end + 30 s
Full time interval
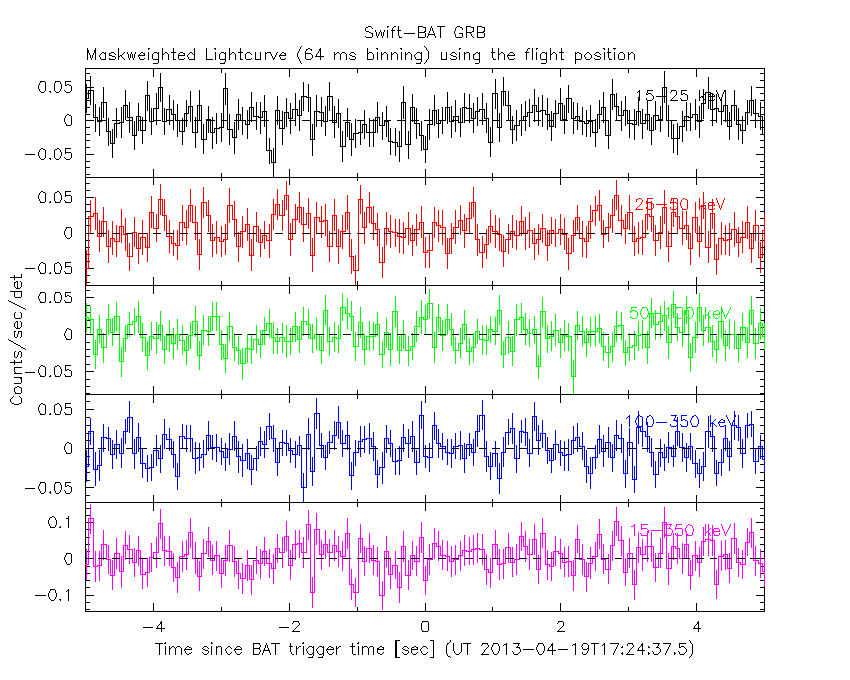
64 ms binning
Full time interval
From T100_start to T100_end
From T0-5 sec to T0+5 sec
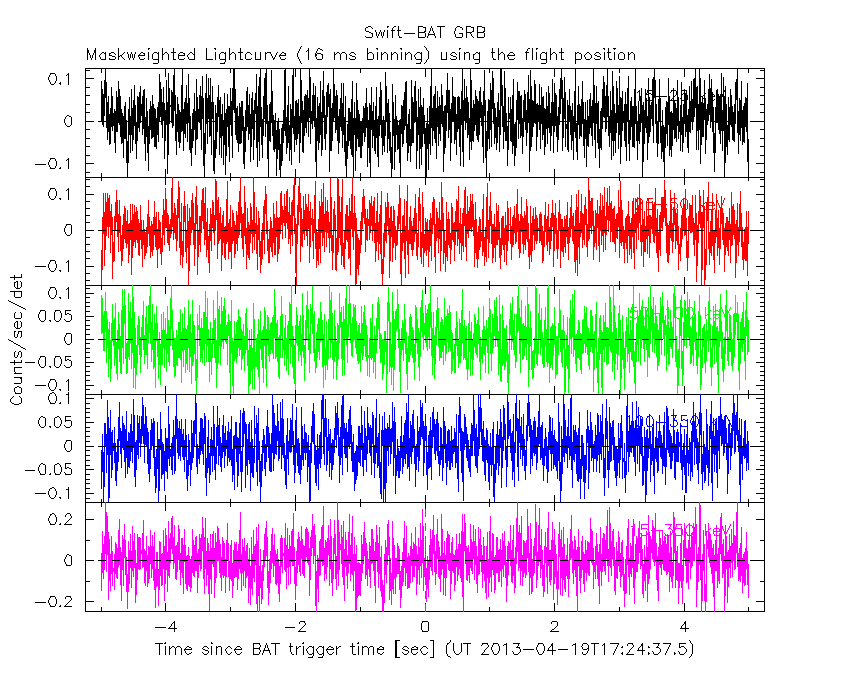
16 ms binning
From T100_start-5 s to T100_start+5 s
Blue+Cyan dotted lines: Time interval of the scaled map
From 0.000000 to 64.000000
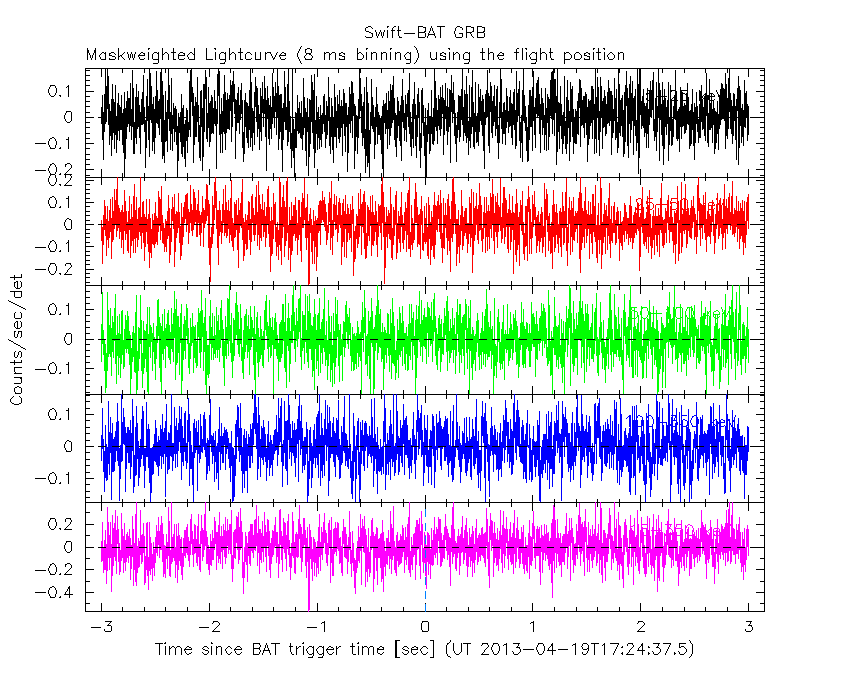
8 ms binning
From T100_start-3 s to T100_start+3 s
Blue+Cyan dotted lines: Time interval of the scaled map
From 0.000000 to 64.000000
2 ms binning
From T100_start-1 s to T100_start+1 s
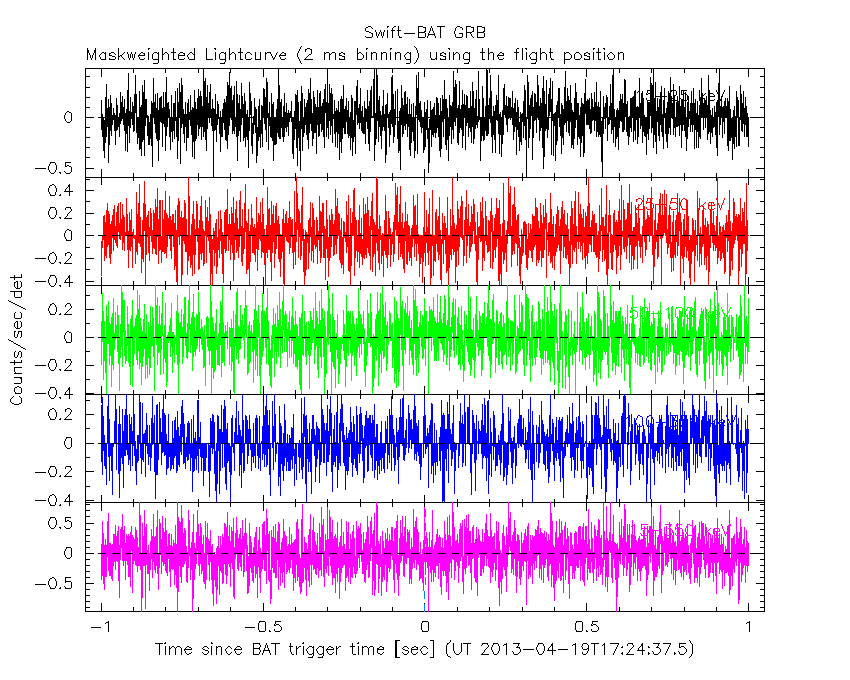
Blue+Cyan dotted lines: Time interval of the scaled map
From 0.000000 to 64.000000
SN=5 or 10 sec. binning (whichever binning is satisfied first)
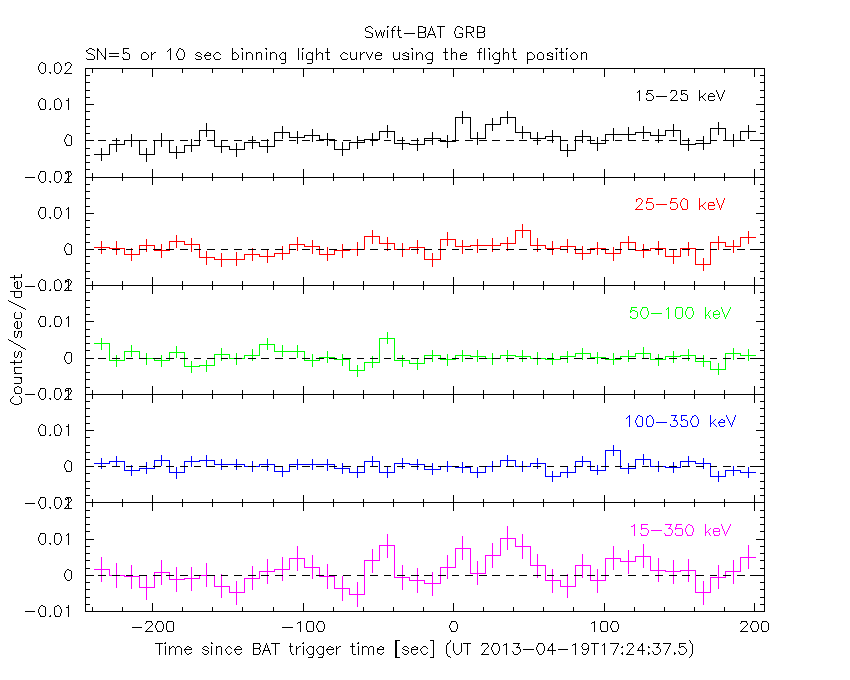
SN=5 or 10 sec. binning (T < 200 sec)
The mask-weighted light curves based on cleaned DPHs
Spectra
Notes:
- 1) The fitting includes the systematic errors.
- 2) For long bursts, a spectral fit of the pre-slew DRM will introduce some errors in both a spectral shape and a normalization if the PHA file contains a lot of the slew/post-slew time interval.
- 3) For fits to more complicated models (e.g. a power-law over a cutoff power-law), the BAT team has decided to require a chi-square improvement of more than 6 for each extra dof.
- 4) For short bursts (T90<1sec), the specrtum is also fit with Blackbody, OTTB, and Double Blackbody.
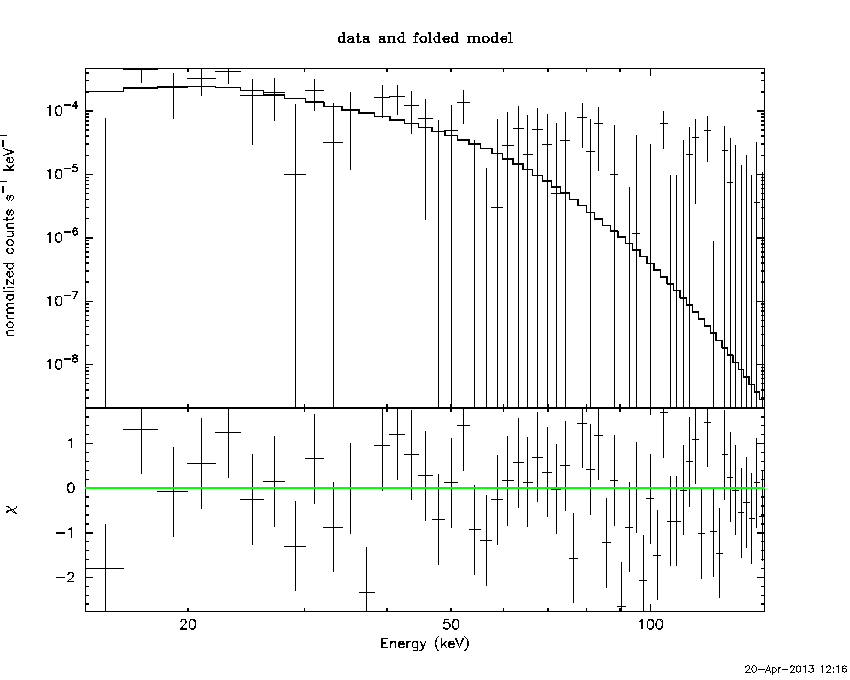
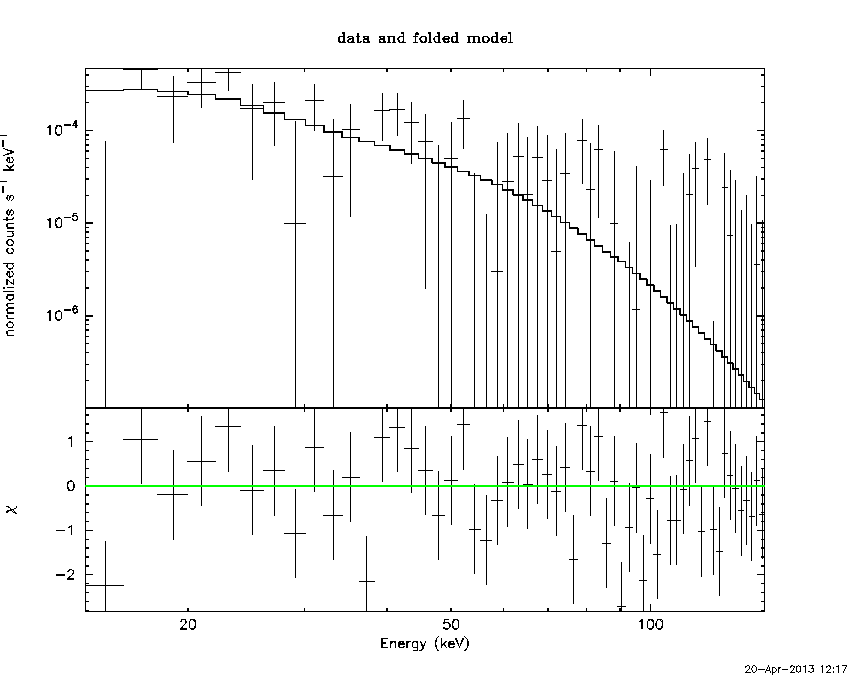
Time averaged spectrum fit using the pre-slew DRM
Power-law model

Time interval is from    0.000 sec. to   64.000 sec.

Spectral model in power-law:
------------------------------------------------------------
Parameters  : value       lower 90%   higher 90%
Photon index: 2.26709     ( -0.564726   0.689237 )
Norm@50keV  : 2.59006E-04    ( -0.00012825   0.000131873 )
------------------------------------------------------------
#Fit statistic : Chi-Squared =          63.86 using 59 PHA bins.
# Reduced chi-squared =          1.120 for     57 degrees of freedom
# Null hypothesis probability =   2.482950e-01

Photon flux (15-150 keV)    in 64 sec: 4.44025E-02 ( -0.0151998  0.0154259 ) ph/cm2/s
Energy fluence (15-150 keV)             : 1.56604e-07 ( -6.44454e-08  7.29901e-08 ) ergs/cm2
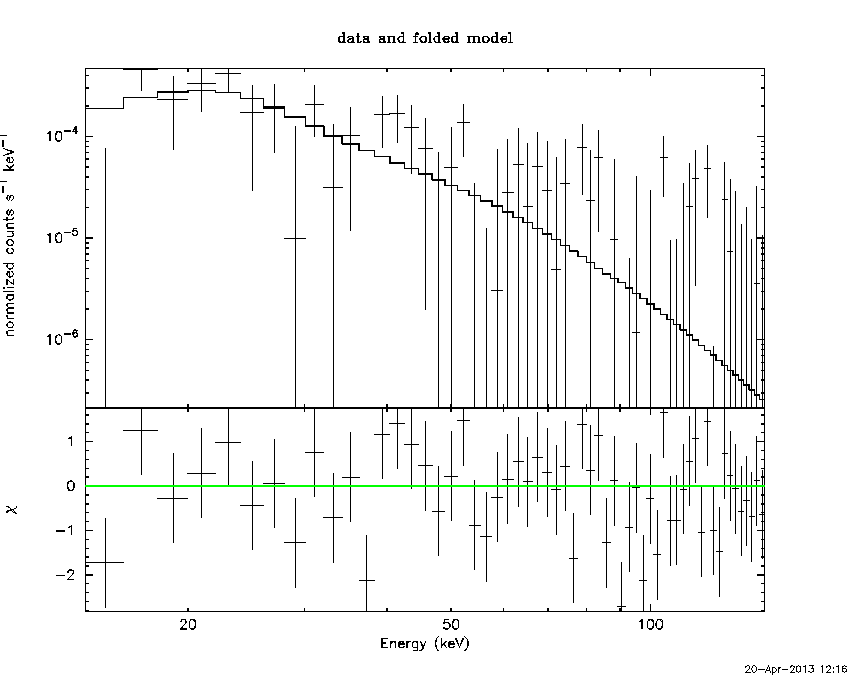
Cutoff power-law model
Time interval is from    0.000 sec. to   64.000 sec.
Spectral model in the cutoff power-law:
------------------------------------------------------------
Parameters  : value       lower 90%   higher 90%
Photon index: -0.731554     ( -4.59289   2.69572 )
Epeak [keV] : 30.9464      (   )
Norm@50keV  : 2.40475E-02    (     )
------------------------------------------------------------
#Fit statistic : Chi-Squared =          60.02 using 59 PHA bins.
# Reduced chi-squared =          1.072 for     56 degrees of freedom
# Null hypothesis probability =   3.321306e-01

Photon flux (15-150 keV)    in 64 sec: 4.45637E-02 ( -0.0143906  0.0145956 ) ph/cm2/s
Energy fluence (15-150 keV)             : 1.34569e-07 ( -5.04698e-08  6.12333e-08 ) ergs/cm2
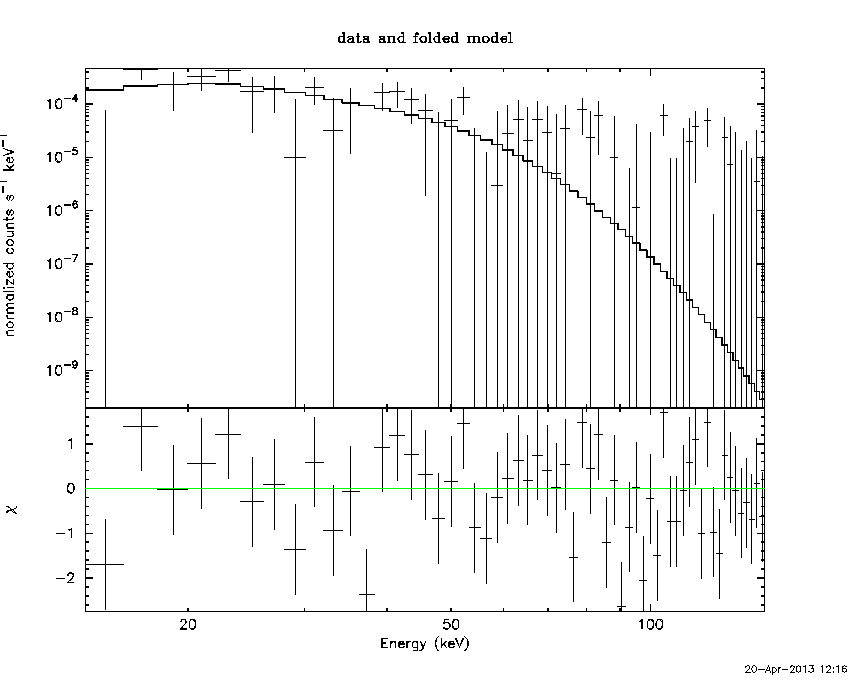
Band function
Time interval is from    0.000 sec. to   64.000 sec.

Spectral model in the Band function:
------------------------------------------------------------
Parameters  : value       lower 90%   higher 90%
alpha       : 4.98308   ( -6.81937   -4.98308 )
beta        : -3.13580    ( 3.1358   1.00167 )
Epeak [keV] : 24.6625      ( -6.86092 7.47439 )
Norm@50keV   : 68.9826    ( -21.7824   535.821 )
------------------------------------------------------------
#Fit statistic : Chi-Squared =          59.81 using 59 PHA bins.
# Reduced chi-squared =          1.087 for     55 degrees of freedom
# Null hypothesis probability =   3.053098e-01

Photon flux (15-150 keV)    in 64 sec:  (    ) ph/cm2/s
Energy fluence (15-150 keV)             : 0 ( 0  0 ) ergs/cm2
Single BB
Spectral model blackbody:
------------------------------------------------------------
Parameters  : value    Lower 90%  Upper 90%
kT [keV]    : 7.94275  (-2.27759  3.04187)
R^2/D10^2   : 5.69370E-02  (-0.0569328   0.159368)
(R is the radius in km and D10 is the distance to the source in units of 10 kpc)
------------------------------------------------------------
#Fit statistic : Chi-Squared =          60.12 using 59 PHA bins.
# Reduced chi-squared =          1.055 for     57 degrees of freedom
# Null hypothesis probability =   3.632896e-01

Energy  Fluence     90% Error
[keV]   [erg/cm2]   [erg/cm2]
15- 25  4.135e-08   2.566e-08
25- 50  7.147e-08   4.253e-08
50-150  1.833e-08   1.481e-08
15-150  1.311e-07   7.894e-08
Thermal bremsstrahlung (OTTB)

Spectral model: thermal bremsstrahlung
------------------------------------------------------------
Parameters  : value         Lower 90%    Upper 90%
kT [keV]    : 36.6628       (-18.3806      51.211)
Norm        : 0.320486       (-0.140335     0.263603)
------------------------------------------------------------
#Fit statistic : Chi-Squared =          61.56 using 59 PHA bins.
# Reduced chi-squared =          1.080 for     57 degrees of freedom
# Null hypothesis probability =   3.162069e-01

Energy  Fluence     90% Error
[keV]   [erg/cm2]   [erg/cm2]
15- 25  4.565e-08   2.781e-08
25- 50  5.775e-08   3.648e-08
50-150  4.050e-08   3.466e-08
15-150  1.439e-07   9.437e-08
Double BB
Spectral model: bbodyrad<1> + bbodyrad<2>
------------------------------------------------------------
Parameters  : value         Lower 90%    Upper 90%
kT1 [keV]   : 5.54056        (-5.54634      -5.54634)
R1^2/D10^2  : 0.103749        (-0.103828      -0.103828)
kT2 [keV]   : 9.98849        (-10.0135      65.6846)
R2^2/D10^2  : 1.49327E-02    (-0.0147096   0.190364)
------------------------------------------------------------
#Fit statistic : Chi-Squared =          59.93 using 59 PHA bins.
# Reduced chi-squared =          1.090 for     55 degrees of freedom
# Null hypothesis probability =   3.016693e-01

Energy  Fluence     90% Error
[keV]   [erg/cm2]   [erg/cm2]
15- 25  4.335e-08   1.089e-07
25- 50  6.815e-08   2.767e-07
50-150  2.637e-08   1.638e-07
15-150  1.379e-07   4.605e-07
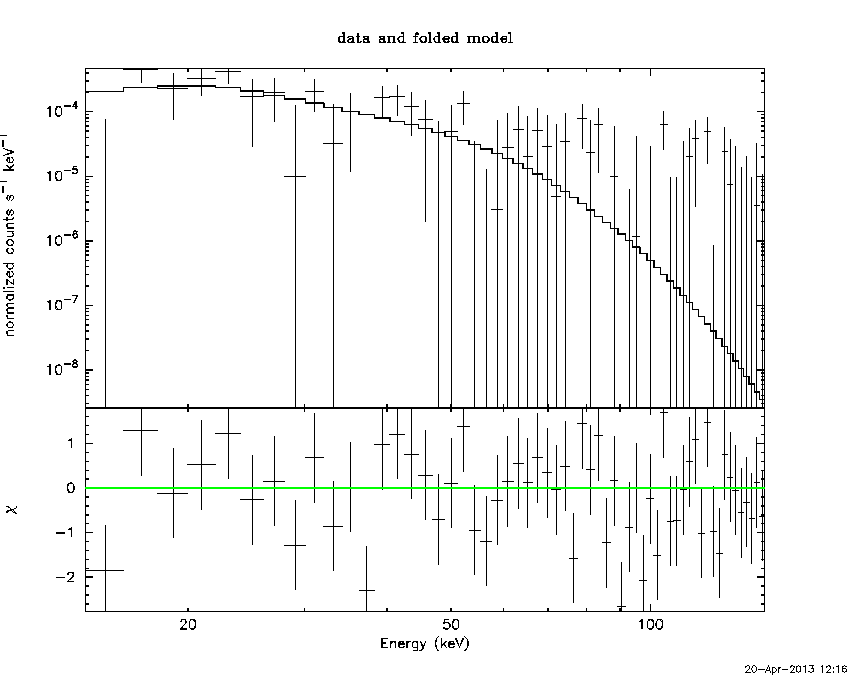
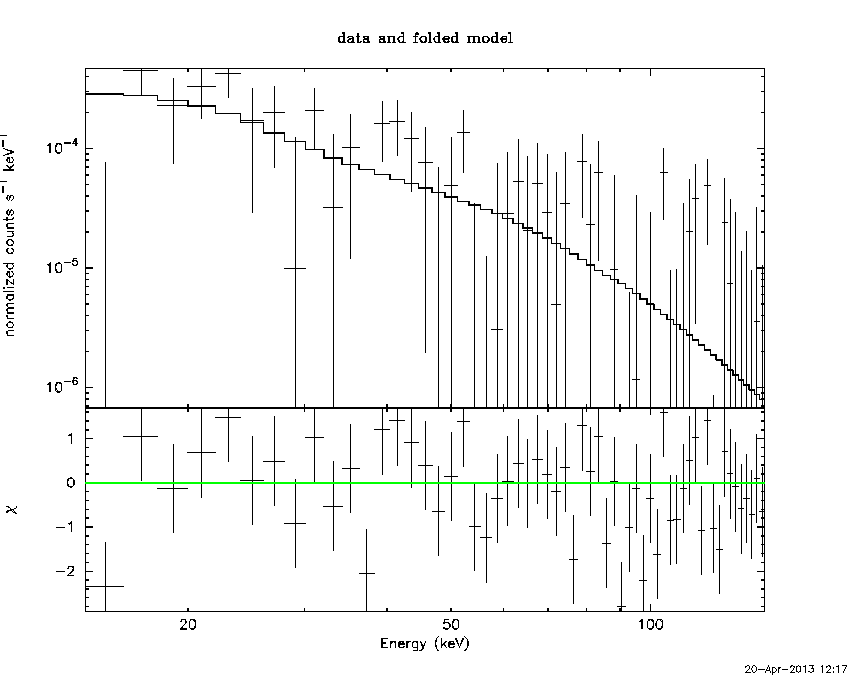
Peak spectrum fit
Power-law model

Time interval is from    0.000 sec. to   64.000 sec.

Spectral model in power-law:
------------------------------------------------------------
Parameters  : value       lower 90%   higher 90%
Photon index: 2.26709     ( -0.564726   0.689237 )
Norm@50keV  : 2.59006E-04    ( -0.00012825   0.000131873 )
------------------------------------------------------------
#Fit statistic : Chi-Squared =          63.86 using 59 PHA bins.
# Reduced chi-squared =          1.120 for     57 degrees of freedom
# Null hypothesis probability =   2.482950e-01

Photon flux (15-150 keV)    in 64 sec: 4.44025E-02 ( -0.0151998  0.0154259 ) ph/cm2/s
Energy fluence (15-150 keV)             : 1.56604e-07 ( -6.44454e-08  7.29901e-08 ) ergs/cm2
Cutoff power-law model

Time interval is from    0.000 sec. to   64.000 sec.
Spectral model in the cutoff power-law:
------------------------------------------------------------
Parameters  : value       lower 90%   higher 90%
Photon index: -0.731554     ( -4.59289   2.69572 )
Epeak [keV] : 30.9464      (   )
Norm@50keV  : 2.40475E-02    (     )
------------------------------------------------------------
#Fit statistic : Chi-Squared =          60.02 using 59 PHA bins.
# Reduced chi-squared =          1.072 for     56 degrees of freedom
# Null hypothesis probability =   3.321306e-01

Photon flux (15-150 keV)    in 64 sec: 4.45637E-02 ( -0.0143906  0.0145956 ) ph/cm2/s
Energy fluence (15-150 keV)             : 1.34569e-07 ( -5.04698e-08  6.12333e-08 ) ergs/cm2
Band function

Time interval is from    0.000 sec. to   64.000 sec.

Spectral model in the Band function:
------------------------------------------------------------
Parameters  : value       lower 90%   higher 90%
alpha       : 4.98308   ( -6.81995   -4.98308 )
beta        : -3.13580    ( 3.1358   1.00167 )
Epeak [keV] : 24.6625      ( -6.86092 7.47439 )
Norm@50keV   : 68.9826    ( -21.7824   535.821 )
------------------------------------------------------------
#Fit statistic : Chi-Squared =          59.81 using 59 PHA bins.
# Reduced chi-squared =          1.087 for     55 degrees of freedom
# Null hypothesis probability =   3.053098e-01

Photon flux (15-150 keV)    in 64 sec:  (    ) ph/cm2/s
Energy fluence (15-150 keV)             : 0 ( 0  0 ) ergs/cm2
Single BB

Spectral model blackbody:
------------------------------------------------------------
Parameters  : value    Lower 90%  Upper 90%
kT [keV]    : 7.94275  (-2.27759  3.04187)
R^2/D10^2   : 5.69370E-02  (-0.0569328   0.159368)
(R is the radius in km and D10 is the distance to the source in units of 10 kpc)
------------------------------------------------------------
#Fit statistic : Chi-Squared =          60.12 using 59 PHA bins.
# Reduced chi-squared =          1.055 for     57 degrees of freedom
# Null hypothesis probability =   3.632896e-01

Energy  Fluence     90% Error
[keV]   [erg/cm2]   [erg/cm2]
15- 25  4.135e-08   2.510e-08
25- 50  7.147e-08   4.362e-08
50-150  1.833e-08   1.514e-08
15-150  1.311e-07   8.240e-08
Thermal bremsstrahlung (OTTB)
Spectral model: thermal bremsstrahlung
------------------------------------------------------------
Parameters  : value         Lower 90%    Upper 90%
kT [keV]    : 36.6628       (-18.3806      51.211)
Norm        : 0.320486       (-0.140335     0.263603)
------------------------------------------------------------
#Fit statistic : Chi-Squared =          61.56 using 59 PHA bins.
# Reduced chi-squared =          1.080 for     57 degrees of freedom
# Null hypothesis probability =   3.162069e-01

Energy  Fluence     90% Error
[keV]   [erg/cm2]   [erg/cm2]
15- 25  4.565e-08   2.851e-08
25- 50  5.775e-08   3.526e-08
50-150  4.050e-08   3.488e-08
15-150  1.439e-07   9.549e-08
Double BB

Spectral model: bbodyrad<1> + bbodyrad<2>
------------------------------------------------------------
Parameters  : value         Lower 90%    Upper 90%
kT1 [keV]   : 5.54056        (-5.54634      -5.54634)
R1^2/D10^2  : 0.103749        (-0.103828      -0.103828)
kT2 [keV]   : 9.98849        (-10.0135      65.6846)
R2^2/D10^2  : 1.49327E-02    (-0.0147096   0.190364)
------------------------------------------------------------
#Fit statistic : Chi-Squared =          59.93 using 59 PHA bins.
# Reduced chi-squared =          1.090 for     55 degrees of freedom
# Null hypothesis probability =   3.016693e-01

Energy  Fluence     90% Error
[keV]   [erg/cm2]   [erg/cm2]
15- 25  4.335e-08   8.653e-08
25- 50  6.815e-08   1.954e-07
50-150  2.637e-08   1.624e-07
15-150  1.379e-07   4.269e-07
Pre-slew spectrum (Pre-slew PHA with pre-slew DRM)
Power-law model
Spectral model in power-law:
------------------------------------------------------------
Parameters  : value       lower 90%   higher 90%
Photon index: 2.26709     ( -0.564726   0.689237 )
Norm@50keV  : 2.59006E-04    ( -0.00012825   0.000131873 )
------------------------------------------------------------
#Fit statistic : Chi-Squared =          63.86 using 59 PHA bins.
# Reduced chi-squared =          1.120 for     57 degrees of freedom
# Null hypothesis probability =   2.482950e-01

Photon flux (15-150 keV)    in 64 sec: 4.44025E-02 ( -0.0151998  0.0154259 ) ph/cm2/s
Energy fluence (15-150 keV)             : 1.56604e-07 ( -6.44454e-08  7.29901e-08 ) ergs/cm2
Cutoff power-law model

Spectral model in the cutoff power-law:
------------------------------------------------------------
Parameters  : value       lower 90%   higher 90%
Photon index: -0.731554     ( -4.59289   2.69572 )
Epeak [keV] : 30.9464      (   )
Norm@50keV  : 2.40475E-02    (     )
------------------------------------------------------------
#Fit statistic : Chi-Squared =          60.02 using 59 PHA bins.
# Reduced chi-squared =          1.072 for     56 degrees of freedom
# Null hypothesis probability =   3.321306e-01

Photon flux (15-150 keV)    in 64 sec: 4.45637E-02 ( -0.0143906  0.0145956 ) ph/cm2/s
Energy fluence (15-150 keV)             : 1.34569e-07 ( -5.04698e-08  6.12333e-08 ) ergs/cm2
Band function

Spectral model in the Band function:
------------------------------------------------------------
Parameters  : value       lower 90%   higher 90%
alpha       : 4.98308   ( -6.82079   -4.98308 )
beta        : -3.13580    ( 3.1358   1.00167 )
Epeak [keV] : 24.6625      ( -6.86092 7.47439 )
Norm@50keV   : 68.9826    ( -21.7824   535.821 )
------------------------------------------------------------
#Fit statistic : Chi-Squared =          59.81 using 59 PHA bins.
# Reduced chi-squared =          1.087 for     55 degrees of freedom
# Null hypothesis probability =   3.053098e-01

Photon flux (15-150 keV)    in 64 sec:  (    ) ph/cm2/s
Energy fluence (15-150 keV)             : 0 ( 0  0 ) ergs/cm2
S(25-50 keV) vs. S(50-100 keV) plot
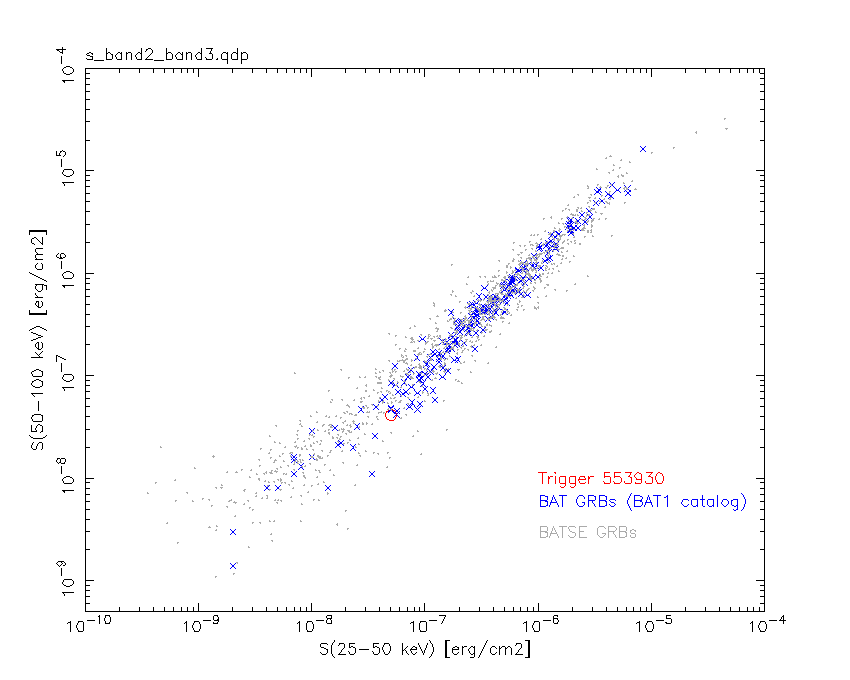
S(25-50 keV)  = 5.03777e-08
S(50-100 keV) = 4.15162e-08
T90 vs. Hardness ratio plot
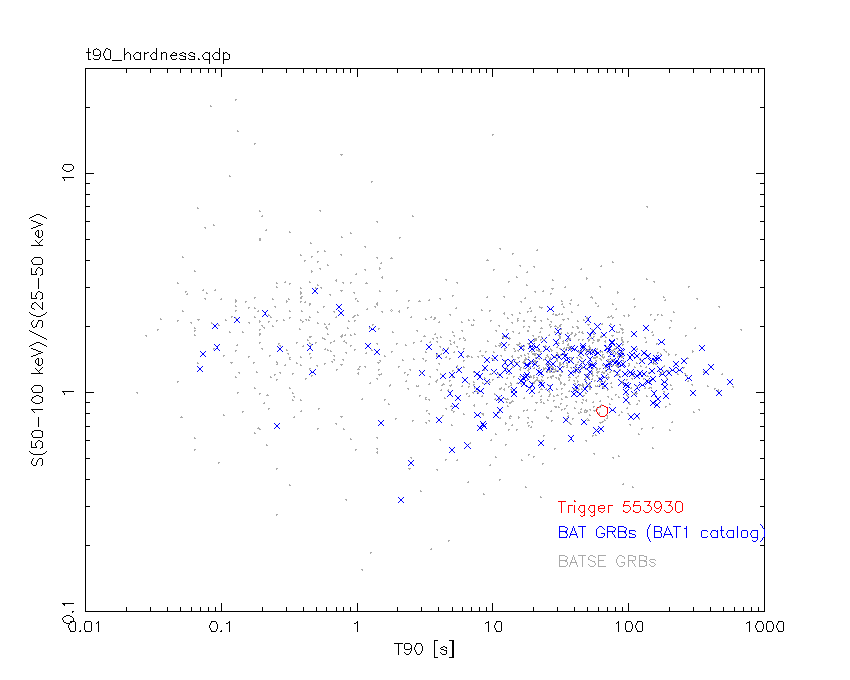
T90                                   = 64 sec.
Hardness ratio (energy fluence ratio) = 0.824099
Color vs. Color plot
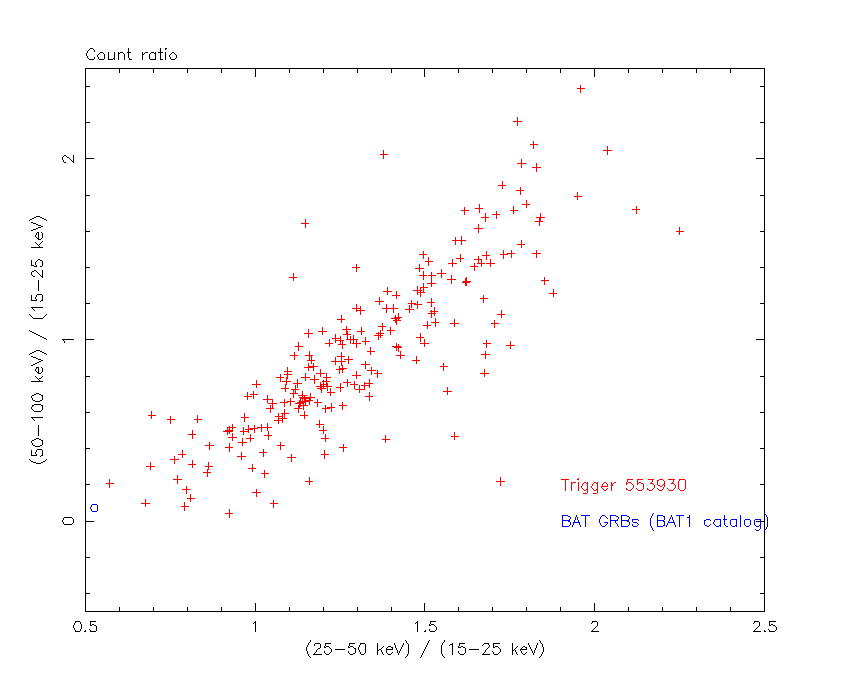
Count Ratio  (25-50 keV) / (15-25 keV) = 0.525841
Count Ratio (50-100 keV) / (15-25 keV) = 0.0722768
Mask shadow pattern
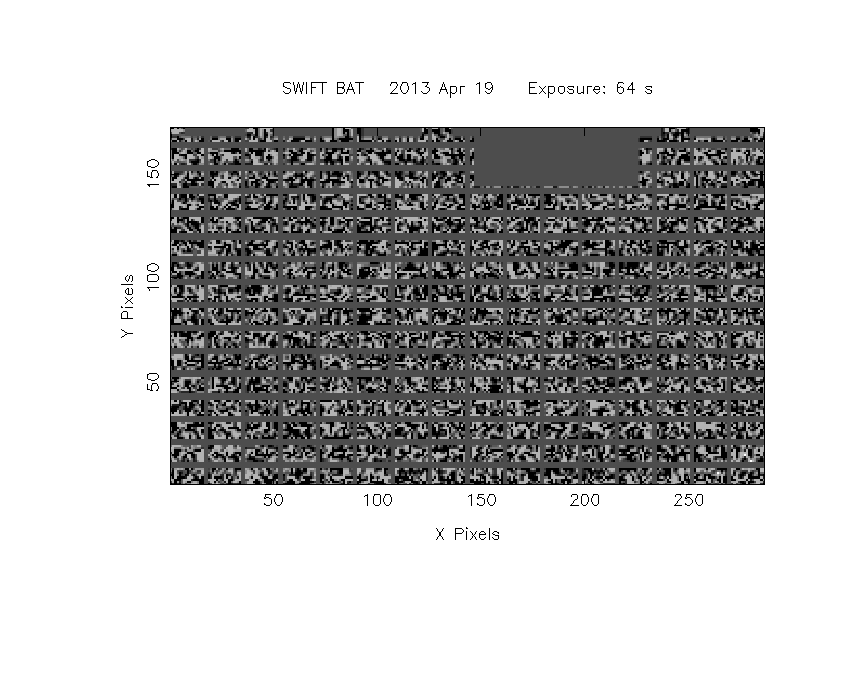
IMX = -1.812586239632472E-01, IMY = 2.041499040677966E-01
TIME vs. PHA plot around the trigger time
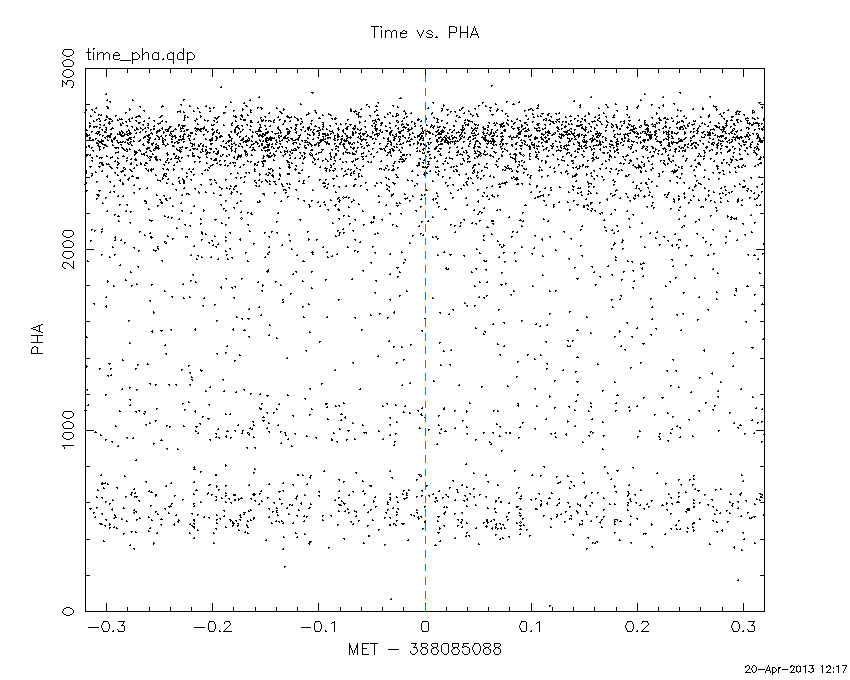
Blue+Cyan dotted lines: Time interval of the scaled map
From 0.000000 to 64.000000
TIME vs. DetID plot around the trigger time
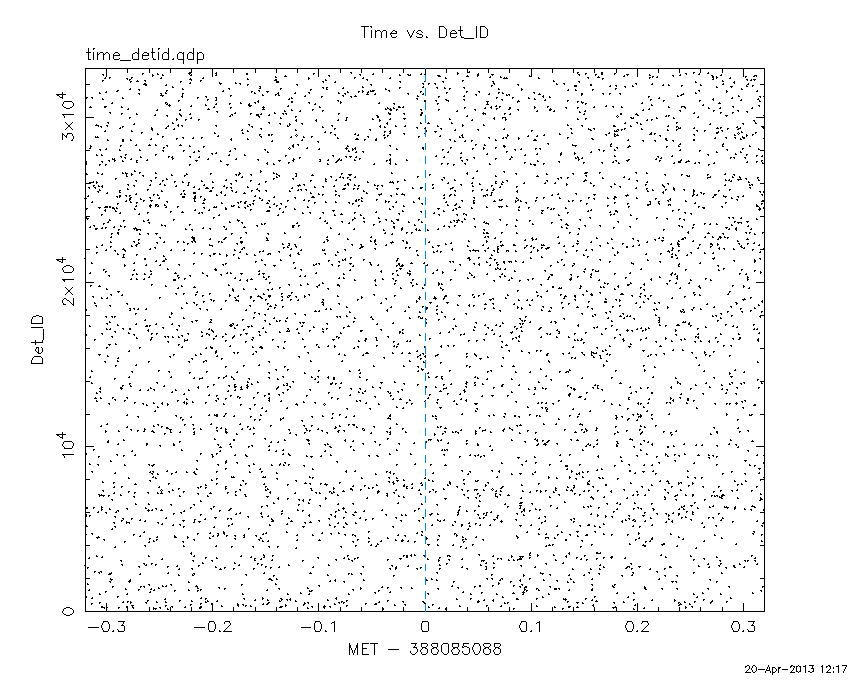
Blue+Cyan dotted lines: Time interval of the scaled map
From 0.000000 to 64.000000
100 us light curve (15-350 keV)
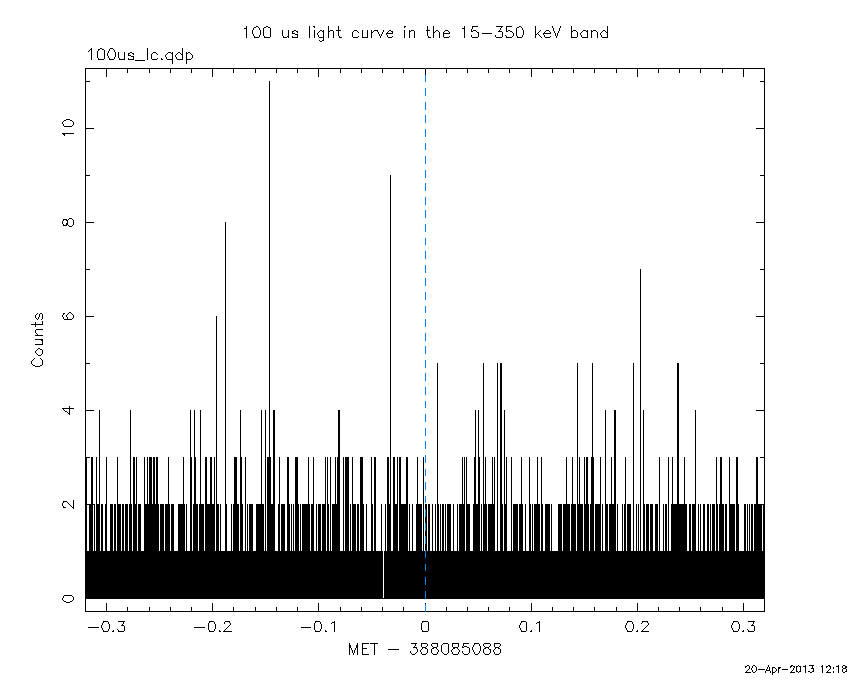
Blue+Cyan dotted lines: Time interval of the scaled map
From 0.000000 to 64.000000
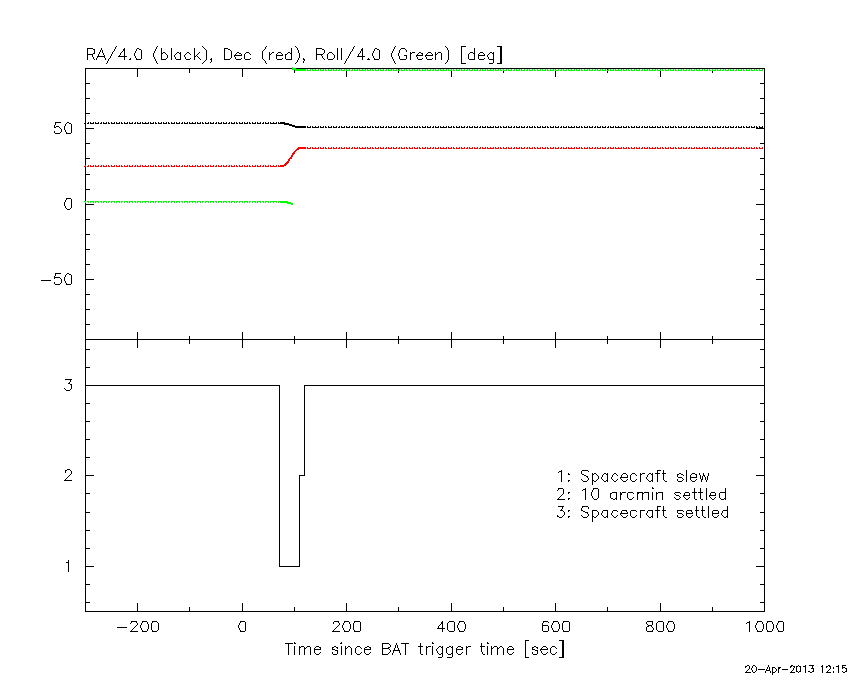
Spacecraft aspect plot
Bright source in the pre-burst/pre-slew/post-slew images
Pre-burst image of 15-350 keV band
Time interval of the image:
Pre-slew background subtracted image of 15-350 keV band
Time interval of the image:
0.000000 64.000000

# RAcent  DECcent POSerr Theta    Phi  PeakCts   SNR AngSep     Name
#  [deg]    [deg]    ['] [deg]  [deg]                   [']
254.5182  35.2642    2.7  35.8  -32.9   0.5169   4.3    5.6	Her X-1
203.6746  -4.4514    2.5  31.4  104.2   0.8279   4.6 ------	UNKNOWN
147.4944  29.7040    3.0  58.8 -166.0   2.1184   3.9 ------	UNKNOWN
153.9075  44.6634    2.8  52.0 -148.6   1.1252   4.1 ------	UNKNOWN
193.6085  65.4710    2.7  42.5 -109.5   1.6986   4.3 ------	UNKNOWN
Post-slew image of 15-350 keV band
Time interval of the image:
109.800600 264.300000
265.000000 963.148700

# RAcent  DECcent POSerr Theta    Phi  PeakCts   SNR AngSep     Name
#  [deg]    [deg]    ['] [deg]  [deg]                   [']
254.4454  35.3454    1.1  40.5   -7.7   7.2554  10.5    0.6	Her X-1
216.8179   5.2741    2.8  34.1   71.7   4.3003   4.2 ------	UNKNOWN
243.7920  30.1313    2.5  33.9    5.6   2.7461   4.6 ------	UNKNOWN
198.9552  49.5784    3.0  12.8  -98.4   1.8127   3.9 ------	UNKNOWN
132.2358  29.5050    5.7  58.8 -159.3   8.3680   2.0 ------	UNKNOWN
280.4453  44.7774    3.6  56.3  -28.3   8.1133   3.2 ------	UNKNOWN
132.3722  50.3620    4.4  51.0 -135.5   8.6586   2.6 ------	UNKNOWN
Plot creation:
Sat Apr 20 12:18:10 EDT 2013