Special notes of this burst
Image
Pre-slew 15.0-350.0 keV image (Event data)
#   RAcent    DECcent   POSerr    Theta     Phi              Peak Cts       SNR   Name
  196.1202    59.4222   0.0032    28.5708   -19.0835        15.1380127     60.364 TRIG_00553977

Foreground time interval of the image:
-14.988 188.128 (delta_t = 203.116 [sec])
Background time interval of the image:
-239.000 -14.988 (delta_t = 224.012 [sec])
Lightcurves
Notes:
- 1) The mask-weighted light curves are using the flight position.
- 2) Multiple plots of different time binning/intervals are shown to cover all scenarios of short/long GRBs, rate/image triggers, and real/false positives.
- 3) For all the mask-weighted lightcurves, the y-axis units are counts/sec/det where a det is 0.4 x 0.4 = 0.16 sq cm.
- 4) The verticle lines correspond to following: green dotted lines are T50 interval, black dotted lines are T90 interval, blue solid line(s) is a spacecraft slew start time, and orange solid line(s) is a spacecraft slew end time.
- 5) Time of each bin is in the middle of the bin.
1 s binning
From T0-310 s to T0+310 s

From T100_start - 20 s to T100_end + 30 s
Full time interval

64 ms binning
Full time interval
From T100_start to T100_end
From T0-5 sec to T0+5 sec
16 ms binning
From T100_start-5 s to T100_start+5 s
8 ms binning
From T100_start-3 s to T100_start+3 s

2 ms binning
From T100_start-1 s to T100_start+1 s
SN=5 or 10 sec. binning (whichever binning is satisfied first)

SN=5 or 10 sec. binning (T < 200 sec)
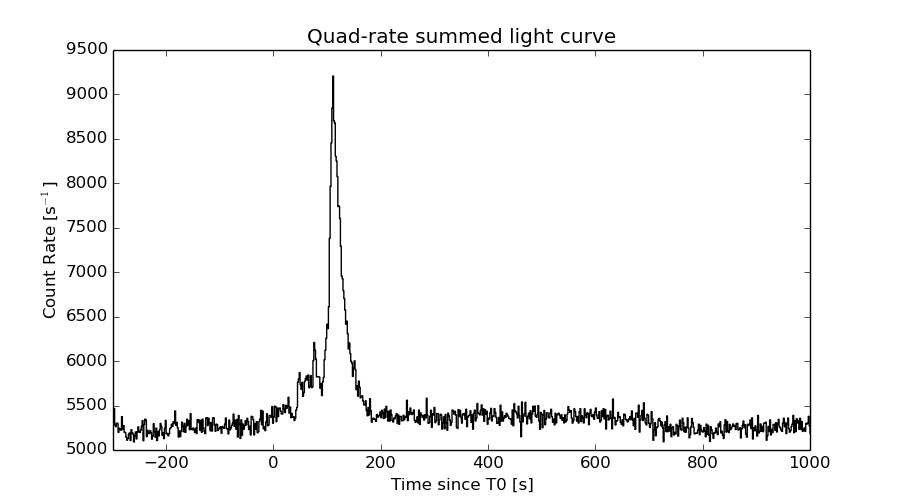
Quad-rate summed light curves (from T0-300s to T0+1000s)
The mask-weighted light curves based on cleaned DPHs

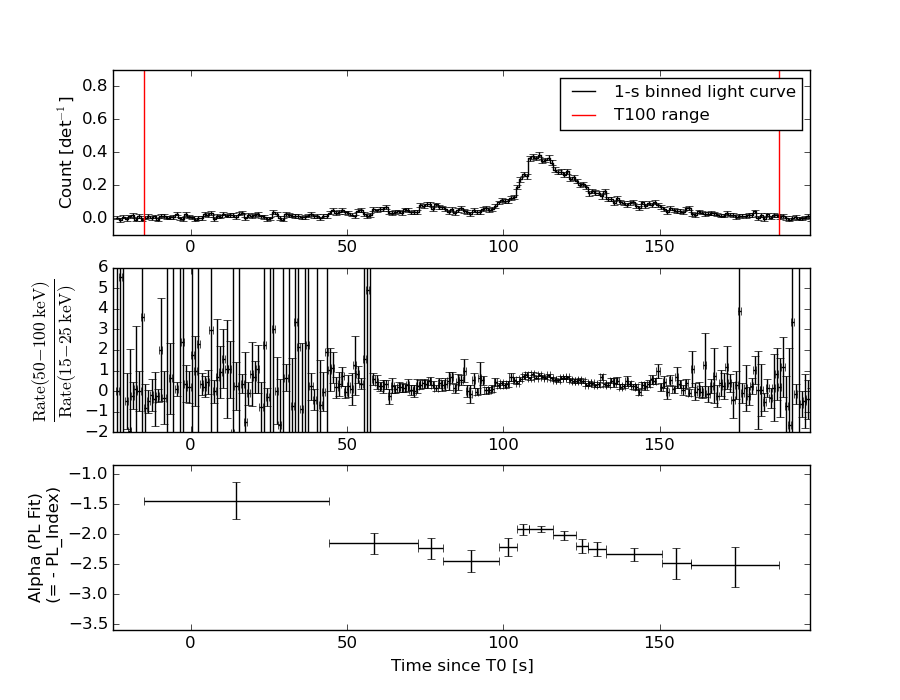
Spectral Evolution
Spectra
Notes:
- 1) The fitting includes the systematic errors.
- 2) When the burst includes telescope slew time periods, the fitting uses an average response file made from multiple 5-s response files through out the slew time plus single time preiod for the non-slew times, and weighted by the total counts in the corresponding time period using addrmf. An average response file is needed becuase a spectral fit using the pre-slew DRM will introduce some errors in both a spectral shape and a normalization if the PHA file contains a lot of the slew/post-slew time interval.
- 3) For fits to more complicated models (e.g. a power-law over a cutoff power-law), the BAT team has decided to require a chi-square improvement of more than 6 for each extra dof.
Time averaged spectrum fit using the average DRM
Power-law model
Time interval is from  -14.988 sec. to  188.128 sec.

Spectral model in power-law:
------------------------------------------------------------
Parameters  : value       lower 90%   higher 90%
Photon index: 2.18283     ( -0.0528974   0.0533654 )
Norm@50keV  : 3.98128E-03    ( -0.000113473   0.000113032 )
------------------------------------------------------------
#Fit statistic : Chi-Squared =          65.77 using 59 PHA bins.
# Reduced chi-squared =          1.154 for     57 degrees of freedom
# Null hypothesis probability =   1.992839e-01

Photon flux (15-150 keV)    in 203.1 sec: 0.653225 ( -0.0193509  0.0194577 ) ph/cm2/s
Energy fluence (15-150 keV)             : 7.58467e-06 ( -1.9804e-07  1.98221e-07 ) ergs/cm2
Cutoff power-law model

Time interval is from  -14.988 sec. to  188.128 sec.
Spectral model in the cutoff power-law:
------------------------------------------------------------
Parameters  : value       lower 90%   higher 90%
Photon index: 1.52021     ( -0.258473   0.2428 )
Epeak [keV] : 33.3603      ( -8.39574 4.96558 )
Norm@50keV  : 8.81246E-03    ( -0.00219019   0.00316917 )
------------------------------------------------------------
#Fit statistic : Chi-Squared =          41.83 using 59 PHA bins.
# Reduced chi-squared =         0.7470 for     56 degrees of freedom
# Null hypothesis probability =   9.203806e-01

Photon flux (15-150 keV)    in 203.1 sec: 0.616799 ( -0.022667  0.022829 ) ph/cm2/s
Energy fluence (15-150 keV)             : 7.1192e-06 ( -2.52169e-07  2.53286e-07 ) ergs/cm2
Band function

Time interval is from  -14.988 sec. to  188.128 sec.

Spectral model in the Band function:
------------------------------------------------------------
Parameters  : value       lower 90%   higher 90%
alpha       : -0.969571   ( -0.540016   0.899054 )
beta        : -2.50505    ( -0.292866   0.157219 )
Epeak [keV] : 34.0592      ( -3.55218 3.46758 )
Norm@50keV   : 1.92344E-02    ( -0.00994512   0.0562197 )
------------------------------------------------------------
#Fit statistic : Chi-Squared =          36.55 using 59 PHA bins.
# Reduced chi-squared =         0.6645 for     55 degrees of freedom
# Null hypothesis probability =   9.738980e-01

Photon flux (15-150 keV)    in 203.1 sec: 0.606112 ( 6.39389  -0.024464 ) ph/cm2/s
Energy fluence (15-150 keV)             : 7.13046e-06 ( -7.12903e-06  -2.39171e-07 ) ergs/cm2
Single BB

Spectral model blackbody:
------------------------------------------------------------
Parameters  : value    Lower 90%  Upper 90%
kT [keV]    : 10.7283  (  )
R^2/D10^2   : 0.206013  (   )
(R is the radius in km and D10 is the distance to the source in units of 10 kpc)
------------------------------------------------------------
#Fit statistic : Chi-Squared =         256.55 using 59 PHA bins.
# Reduced chi-squared =         4.5009 for     57 degrees of freedom
# Null hypothesis probability =   4.069581e-27

Energy  Fluence     90% Error
[keV]   [erg/cm2]   [erg/cm2]
15- 25  1.001e-06   4.732e-08
25- 50  2.739e-06   7.819e-08
50-150  1.746e-06   1.126e-07
15-150  5.486e-06   1.513e-07
Thermal bremsstrahlung (OTTB)

Spectral model: thermal bremsstrahlung
------------------------------------------------------------
Parameters  : value         Lower 90%    Upper 90%
kT [keV]    : 57.5796       (-4.30481      4.61649)
Norm        : 3.32167       (-0.173853     0.178608)
------------------------------------------------------------
#Fit statistic : Chi-Squared =          43.06 using 59 PHA bins.
# Reduced chi-squared =         0.7554 for     57 degrees of freedom
# Null hypothesis probability =   9.141604e-01

Energy  Fluence     90% Error
[keV]   [erg/cm2]   [erg/cm2]
15- 25  1.684e-06   7.494e-08
25- 50  2.530e-06   6.398e-08
50-150  2.780e-06   1.483e-07
15-150  6.994e-06   1.787e-07
Double BB

Spectral model: bbodyrad<1> + bbodyrad<2>
------------------------------------------------------------
Parameters  : value         Lower 90%    Upper 90%
kT1 [keV]   : 6.87088        (-0.667855      0.647901)
R1^2/D10^2  : 0.887160        (-0.23474      0.382395)
kT2 [keV]   : 20.7087        (-2.63571      3.57656)
R2^2/D10^2  : 9.60160E-03    (-0.00466239   0.00791641)
------------------------------------------------------------
#Fit statistic : Chi-Squared =          47.57 using 59 PHA bins.
# Reduced chi-squared =         0.8649 for     55 degrees of freedom
# Null hypothesis probability =   7.513645e-01

Energy  Fluence     90% Error
[keV]   [erg/cm2]   [erg/cm2]
15- 25  1.499e-06   1.127e-07
25- 50  2.579e-06   1.503e-07
50-150  2.859e-06   3.808e-07
15-150  6.937e-06   6.073e-07
Peak spectrum fit
Power-law model

Time interval is from  110.668 sec. to  111.668 sec.

Spectral model in power-law:
------------------------------------------------------------
Parameters  : value       lower 90%   higher 90%
Photon index: 1.79369     ( -0.105775   0.107671 )
Norm@50keV  : 2.49332E-02    ( -0.00170197   0.00168895 )
------------------------------------------------------------
#Fit statistic : Chi-Squared =          61.09 using 59 PHA bins.
# Reduced chi-squared =          1.072 for     57 degrees of freedom
# Null hypothesis probability =   3.313328e-01

Photon flux (15-150 keV)    in 1 sec: 3.42738 ( -0.217722  0.217916 ) ph/cm2/s
Energy fluence (15-150 keV)             : 2.2959e-07 ( -1.59583e-08  1.60553e-08 ) ergs/cm2
Cutoff power-law model

Time interval is from  110.668 sec. to  111.668 sec.
Spectral model in the cutoff power-law:
------------------------------------------------------------
Parameters  : value       lower 90%   higher 90%
Photon index: 1.03025     ( -0.515238   0.457382 )
Epeak [keV] : 57.9558      ( -9.04557 22.0548 )
Norm@50keV  : 6.48337E-02    ( -0.0278235   0.0581565 )
------------------------------------------------------------
#Fit statistic : Chi-Squared =          52.37 using 59 PHA bins.
# Reduced chi-squared =         0.9353 for     56 degrees of freedom
# Null hypothesis probability =   6.128938e-01

Photon flux (15-150 keV)    in 1 sec: 3.33322 ( -0.22458  0.22464 ) ph/cm2/s
Energy fluence (15-150 keV)             : 2.16448e-07 ( -1.7602e-08  1.7791e-08 ) ergs/cm2
Band function

Time interval is from  110.668 sec. to  111.668 sec.

Spectral model in the Band function:
------------------------------------------------------------
Parameters  : value       lower 90%   higher 90%
alpha       : 0.202494   ( -1.27511   -0.214605 )
beta        : -2.10741    ( -0.583934   0.214854 )
Epeak [keV] : 38.1100      ( -10.429 19.6032 )
Norm@50keV   : 0.449710    ( -0.483633   694.925 )
------------------------------------------------------------
#Fit statistic : Chi-Squared =          49.53 using 59 PHA bins.
# Reduced chi-squared =         0.9005 for     55 degrees of freedom
# Null hypothesis probability =   6.829255e-01

Photon flux (15-150 keV)    in 1 sec: 3.32294 ( 3.67706  -0.2253 ) ph/cm2/s
Energy fluence (15-150 keV)             : 2.20189e-07 ( -2.20182e-07  -1.6627e-08 ) ergs/cm2
Single BB

Spectral model blackbody:
------------------------------------------------------------
Parameters  : value    Lower 90%  Upper 90%
kT [keV]    : 11.7873  (-0.847095  0.921873)
R^2/D10^2   : 0.894835  (-0.221458   0.29009)
(R is the radius in km and D10 is the distance to the source in units of 10 kpc)
------------------------------------------------------------
#Fit statistic : Chi-Squared =          95.13 using 59 PHA bins.
# Reduced chi-squared =          1.669 for     57 degrees of freedom
# Null hypothesis probability =   1.148500e-03

Energy  Fluence     90% Error
[keV]   [erg/cm2]   [erg/cm2]
15- 25  2.625e-08   2.865e-09
25- 50  8.088e-08   6.520e-09
50-150  6.676e-08   9.745e-09
15-150  1.739e-07   1.350e-08
Thermal bremsstrahlung (OTTB)

Spectral model: thermal bremsstrahlung
------------------------------------------------------------
Parameters  : value         Lower 90%    Upper 90%
kT [keV]    : 99.9871       (-19.7013      28.8638)
Norm        : 15.2463       (-1.31274     1.45868)
------------------------------------------------------------
#Fit statistic : Chi-Squared =          53.11 using 59 PHA bins.
# Reduced chi-squared =         0.9317 for     57 degrees of freedom
# Null hypothesis probability =   6.217725e-01

Energy  Fluence     90% Error
[keV]   [erg/cm2]   [erg/cm2]
15- 25  3.985e-08   4.235e-09
25- 50  6.890e-08   5.145e-09
50-150  1.116e-07   3.285e-08
15-150  2.204e-07   3.655e-08
Double BB

Spectral model: bbodyrad<1> + bbodyrad<2>
------------------------------------------------------------
Parameters  : value         Lower 90%    Upper 90%
kT1 [keV]   : 7.34032        (-1.25183      1.29929)
R1^2/D10^2  : 3.57413        (-1.42484      2.90531)
kT2 [keV]   : 23.4618        (-4.92212      9.09575)
R2^2/D10^2  : 4.49001E-02    (-0.0318886   0.0740086)
------------------------------------------------------------
#Fit statistic : Chi-Squared =          48.89 using 59 PHA bins.
# Reduced chi-squared =         0.8890 for     55 degrees of freedom
# Null hypothesis probability =   7.057769e-01

Energy  Fluence     90% Error
[keV]   [erg/cm2]   [erg/cm2]
15- 25  3.685e-08   7.080e-09
25- 50  7.292e-08   1.549e-08
50-150  1.095e-07   5.039e-08
15-150  2.193e-07   6.471e-08
Pre-slew spectrum (Pre-slew PHA with pre-slew DRM)
Power-law model
Spectral model in power-law:
------------------------------------------------------------
Parameters  : value       lower 90%   higher 90%
Photon index: 2.18283     ( -0.0528974   0.0533654 )
Norm@50keV  : 3.98128E-03    ( -0.000113473   0.000113032 )
------------------------------------------------------------
#Fit statistic : Chi-Squared =          65.77 using 59 PHA bins.
# Reduced chi-squared =          1.154 for     57 degrees of freedom
# Null hypothesis probability =   1.992839e-01

Photon flux (15-150 keV)    in 203.1 sec: 0.653225 ( -0.0193509  0.0194577 ) ph/cm2/s
Energy fluence (15-150 keV)             : 7.58467e-06 ( -1.9804e-07  1.98221e-07 ) ergs/cm2
Cutoff power-law model
Spectral model in the cutoff power-law:
------------------------------------------------------------
Parameters  : value       lower 90%   higher 90%
Photon index: 1.52021     ( -0.258473   0.2428 )
Epeak [keV] : 33.3603      ( -8.39574 4.96558 )
Norm@50keV  : 8.81246E-03    ( -0.00219019   0.00316917 )
------------------------------------------------------------
#Fit statistic : Chi-Squared =          41.83 using 59 PHA bins.
# Reduced chi-squared =         0.7470 for     56 degrees of freedom
# Null hypothesis probability =   9.203806e-01

Photon flux (15-150 keV)    in 203.1 sec: 0.616799 ( -0.022667  0.022829 ) ph/cm2/s
Energy fluence (15-150 keV)             : 7.1192e-06 ( -2.52169e-07  2.53286e-07 ) ergs/cm2
Band function

Spectral model in the Band function:
------------------------------------------------------------
Parameters  : value       lower 90%   higher 90%
alpha       : -0.969571   ( -0.540016   0.899054 )
beta        : -2.50505    ( -0.292866   0.157219 )
Epeak [keV] : 34.0592      ( -3.55218 3.46758 )
Norm@50keV   : 1.92344E-02    ( -0.00994512   0.0562197 )
------------------------------------------------------------
#Fit statistic : Chi-Squared =          36.55 using 59 PHA bins.
# Reduced chi-squared =         0.6645 for     55 degrees of freedom
# Null hypothesis probability =   9.738980e-01

Photon flux (15-150 keV)    in 203.1 sec: 0.606112 ( 6.39389  -0.024464 ) ph/cm2/s
Energy fluence (15-150 keV)             : 7.13046e-06 ( -7.12903e-06  -2.39171e-07 ) ergs/cm2
S(25-50 keV) vs. S(50-100 keV) plot
S(25-50 keV)  = 2.39e-06
S(50-100 keV) = 2.11e-06
T90 vs. Hardness ratio plot

T90                                   = 121.135999977589 sec.
Hardness ratio (energy fluence ratio) = 0.882845
Color vs. Color plot
Count Ratio  (25-50 keV) / (15-25 keV) = 1.08399
Count Ratio (50-100 keV) / (15-25 keV) = 0.47778
Mask shadow pattern
IMX = 5.146293895582025E-01, IMY = 1.780407519443355E-01
TIME vs. PHA plot around the trigger time

TIME vs. DetID plot around the trigger time

100 us light curve (15-350 keV)
Spacecraft aspect plot

Bright source in the pre-burst/pre-slew/post-slew images
Pre-burst image of 15-350 keV band
Time interval of the image:
-239.000000 -14.988000

# RAcent  DECcent POSerr Theta    Phi  PeakCts   SNR AngSep     Name
#  [deg]    [deg]    ['] [deg]  [deg]                   [']
191.4884   6.3957    1.9  39.2   86.4   4.5464   6.0 ------	UNKNOWN
161.4346  -3.5554    2.4  41.9  135.8   2.7871   4.8 ------	UNKNOWN
131.5680   9.0999    3.5  42.5 -175.3   0.9287   3.3 ------	UNKNOWN
124.5734   9.2618    3.0  47.1 -168.0   1.3561   3.8 ------	UNKNOWN
Pre-slew background subtracted image of 15-350 keV band
Time interval of the image:
-14.988000 188.128000

# RAcent  DECcent POSerr Theta    Phi  PeakCts   SNR AngSep     Name
#  [deg]    [deg]    ['] [deg]  [deg]                   [']
165.2465  -3.6810    2.3  41.8  130.1   4.2585   5.1 ------	UNKNOWN
158.2432  -7.4544    2.7  46.2  139.6   4.3155   4.2 ------	UNKNOWN
216.2192  54.5891    2.1  37.3   -4.0   1.7428   5.5 ------	UNKNOWN
134.8137  20.4374    2.7  32.3 -165.6   1.1622   4.3 ------	UNKNOWN
196.1202  59.4222    0.2  28.6  -19.1  15.1381  60.4 ------	UNKNOWN
Post-slew image of 15-350 keV band
Time interval of the image:
719.500580 963.136200

# RAcent  DECcent POSerr Theta    Phi  PeakCts   SNR AngSep     Name
#  [deg]    [deg]    ['] [deg]  [deg]                   [']
254.4972  35.3207    2.2  44.3   18.8   2.3111   5.3    2.3	Her X-1
191.9427  35.6056    2.2  24.0  111.1   1.3404   5.4 ------	UNKNOWN
230.2329  48.9718    2.6  22.2   25.6   0.9066   4.4 ------	UNKNOWN
277.6334  84.4120    2.6  30.2  -66.2   1.2259   4.5 ------	UNKNOWN
 65.0026  76.2630    3.4  40.8  -93.1   3.5059   3.4 ------	UNKNOWN
Plot creation:
Sat May 30 17:07:23 EDT 2015