Special notes of this burst
Image
Pre-slew 15.0-350.0 keV image (Event data)

# RAcent DECcent POSerr Theta Phi Peak Cts SNR Name
183.1023 54.3750 0.0073 8.6449 162.9842 1.0971865 26.216 TRIG_00553996
Foreground time interval of the image:
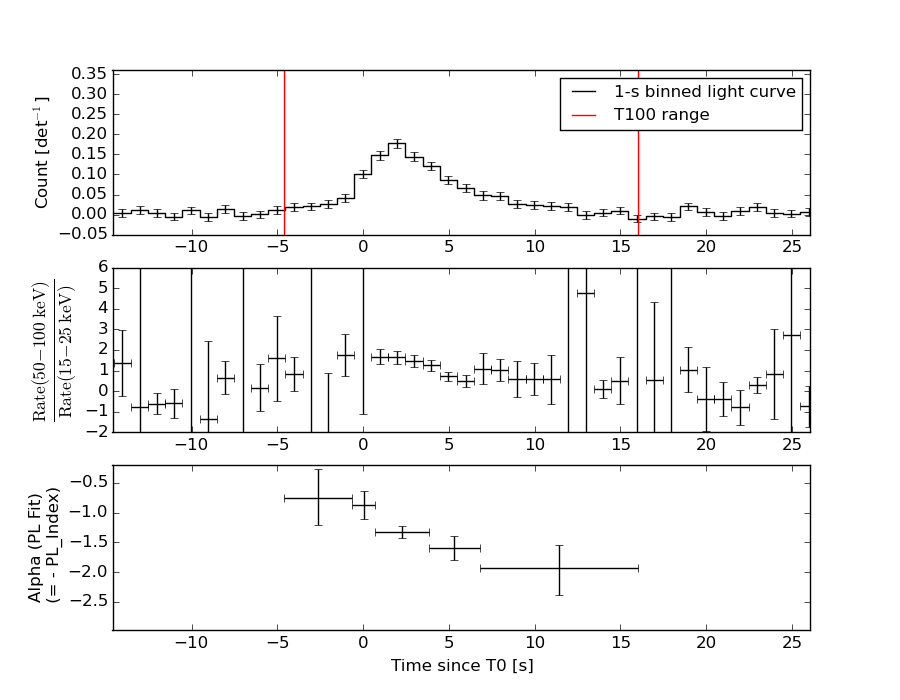
-4.616 10.165 (delta_t = 14.781 [sec])
Background time interval of the image:
-239.536 -4.616 (delta_t = 234.920 [sec])
Lightcurves
Notes:
- 1) The mask-weighted light curves are using the flight position.
- 2) Multiple plots of different time binning/intervals are shown to cover all scenarios of short/long GRBs, rate/image triggers, and real/false positives.
- 3) For all the mask-weighted lightcurves, the y-axis units are counts/sec/det where a det is 0.4 x 0.4 = 0.16 sq cm.
- 4) The verticle lines correspond to following: green dotted lines are T50 interval, black dotted lines are T90 interval, blue solid line(s) is a spacecraft slew start time, and orange solid line(s) is a spacecraft slew end time.
- 5) Time of each bin is in the middle of the bin.
1 s binning
From T0-310 s to T0+310 s

From T100_start - 20 s to T100_end + 30 s

Full time interval

64 ms binning
Full time interval

From T100_start to T100_end

From T0-5 sec to T0+5 sec

16 ms binning
From T100_start-5 s to T100_start+5 s

8 ms binning
From T100_start-3 s to T100_start+3 s

2 ms binning
From T100_start-1 s to T100_start+1 s

SN=5 or 10 sec. binning (whichever binning is satisfied first)
SN=5 or 10 sec. binning (T < 200 sec)

Quad-rate summed light curves (from T0-300s to T0+1000s)

The mask-weighted light curves based on cleaned DPHs

Spectral Evolution
Spectra
Notes:
- 1) The fitting includes the systematic errors.
- 2) When the burst includes telescope slew time periods, the fitting uses an average response file made from multiple 5-s response files through out the slew time plus single time preiod for the non-slew times, and weighted by the total counts in the corresponding time period using addrmf. An average response file is needed becuase a spectral fit using the pre-slew DRM will introduce some errors in both a spectral shape and a normalization if the PHA file contains a lot of the slew/post-slew time interval.
- 3) For fits to more complicated models (e.g. a power-law over a cutoff power-law), the BAT team has decided to require a chi-square improvement of more than 6 for each extra dof.
Time averaged spectrum fit using the average DRM
Power-law model

Time interval is from   -4.616 sec. to   16.048 sec.

Spectral model in power-law:
------------------------------------------------------------
Parameters  : value       lower 90%   higher 90%
Photon index: 1.37998     ( -0.104414   0.104744 )
Norm@50keV  : 3.58225E-03    ( -0.000234279   0.000233843 )
------------------------------------------------------------
#Fit statistic : Chi-Squared =          60.98 using 59 PHA bins.
# Reduced chi-squared =          1.070 for     57 degrees of freedom
# Null hypothesis probability =   3.347040e-01

Photon flux (15-150 keV)    in 20.66 sec: 0.434311 ( -0.0281718  0.0281895 ) ph/cm2/s
Energy fluence (15-150 keV)             : 7.18109e-07 ( -5.21888e-08  5.25638e-08 ) ergs/cm2
Cutoff power-law model

Time interval is from   -4.616 sec. to   16.048 sec.
Spectral model in the cutoff power-law:
------------------------------------------------------------
Parameters  : value       lower 90%   higher 90%
Photon index: 0.112799     ( -0.557472   0.493662 )
Epeak [keV] : 74.3006      ( -9.72074 17.4363 )
Norm@50keV  : 1.55456E-02    ( -0.00662526   0.0134564 )
------------------------------------------------------------
#Fit statistic : Chi-Squared =          38.22 using 59 PHA bins.
# Reduced chi-squared =         0.6826 for     56 degrees of freedom
# Null hypothesis probability =   9.667508e-01

Photon flux (15-150 keV)    in 20.66 sec: 0.413546 ( -0.029227  0.029229 ) ph/cm2/s
Energy fluence (15-150 keV)             : 6.56761e-07 ( -5.56622e-08  5.67633e-08 ) ergs/cm2
Band function

Time interval is from   -4.616 sec. to   16.048 sec.

Spectral model in the Band function:
------------------------------------------------------------
Parameters  : value       lower 90%   higher 90%
alpha       : -0.112589   ( -0.318047   0.823026 )
beta        : -10.0000    ( 10   7.10543e-15 )
Epeak [keV] : 74.2847      ( -9.71668 17.4543 )
Norm@50keV   : 1.55506E-02    ( -0.00662804   0.0134679 )
------------------------------------------------------------
#Fit statistic : Chi-Squared =          38.22 using 59 PHA bins.
# Reduced chi-squared =         0.6950 for     55 degrees of freedom
# Null hypothesis probability =   9.585135e-01

Photon flux (15-150 keV)    in 20.66 sec: 0.417546 (    ) ph/cm2/s
Energy fluence (15-150 keV)             : 6.71956e-07 ( 0  0 ) ergs/cm2
Single BB

Spectral model blackbody:
------------------------------------------------------------
Parameters  : value    Lower 90%  Upper 90%
kT [keV]    : 15.8386  (-1.11807  1.21749)
R^2/D10^2   : 4.35763E-02  (-0.00983884   0.0125449)
(R is the radius in km and D10 is the distance to the source in units of 10 kpc)
------------------------------------------------------------
#Fit statistic : Chi-Squared =          55.29 using 59 PHA bins.
# Reduced chi-squared =         0.9700 for     57 degrees of freedom
# Null hypothesis probability =   5.394729e-01

Energy  Fluence     90% Error
[keV]   [erg/cm2]   [erg/cm2]
15- 25  4.680e-08   5.382e-09
25- 50  1.952e-07   1.565e-08
50-150  3.410e-07   4.287e-08
15-150  5.830e-07   4.876e-08
Thermal bremsstrahlung (OTTB)

Spectral model: thermal bremsstrahlung
------------------------------------------------------------
Parameters  : value         Lower 90%    Upper 90%
kT [keV]    : 200.000       (      )
Norm        : 1.78784       (-0.115189     0.11519)
------------------------------------------------------------
#Fit statistic : Chi-Squared =          58.10 using 59 PHA bins.
# Reduced chi-squared =          1.019 for     57 degrees of freedom
# Null hypothesis probability =   4.343915e-01

Energy  Fluence     90% Error
[keV]   [erg/cm2]   [erg/cm2]
15- 25  9.240e-08   6.849e-09
25- 50  1.778e-07   1.470e-08
50-150  3.898e-07   9.844e-08
15-150  6.600e-07   1.313e-07
Double BB

Spectral model: bbodyrad<1> + bbodyrad<2>
------------------------------------------------------------
Parameters  : value         Lower 90%    Upper 90%
kT1 [keV]   : 6.21464        (-1.71139      2.59677)
R1^2/D10^2  : 0.395534        (-0.256235      0.851894)
kT2 [keV]   : 19.6883        (-2.35291      3.9573)
R2^2/D10^2  : 1.77600E-02    (-0.00960874   0.00890406)
------------------------------------------------------------
#Fit statistic : Chi-Squared =          36.01 using 59 PHA bins.
# Reduced chi-squared =         0.6547 for     55 degrees of freedom
# Null hypothesis probability =   9.777599e-01

Energy  Fluence     90% Error
[keV]   [erg/cm2]   [erg/cm2]
15- 25  7.162e-08   3.081e-08
25- 50  1.833e-07   5.154e-08
50-150  3.949e-07   1.094e-07
15-150  6.498e-07   1.626e-07
Peak spectrum fit
Power-law model

Time interval is from    0.912 sec. to    1.912 sec.

Spectral model in power-law:
------------------------------------------------------------
Parameters  : value       lower 90%   higher 90%
Photon index: 1.28913     ( -0.163871   0.16438 )
Norm@50keV  : 1.18593E-02    ( -0.00120866   0.00120562 )
------------------------------------------------------------
#Fit statistic : Chi-Squared =          60.02 using 59 PHA bins.
# Reduced chi-squared =          1.053 for     57 degrees of freedom
# Null hypothesis probability =   3.667624e-01

Photon flux (15-150 keV)    in 1 sec: 1.41205 ( -0.142738  0.142796 ) ph/cm2/s
Energy fluence (15-150 keV)             : 1.17503e-07 ( -1.35151e-08  1.36479e-08 ) ergs/cm2
Cutoff power-law model

Time interval is from    0.912 sec. to    1.912 sec.
Spectral model in the cutoff power-law:
------------------------------------------------------------
Parameters  : value       lower 90%   higher 90%
Photon index: 0.560832     ( -0.802203   0.670705 )
Epeak [keV] : 100.260      ( -29.6329 420.08 )
Norm@50keV  : 2.76034E-02    ( -0.0146866   0.0403714 )
------------------------------------------------------------
#Fit statistic : Chi-Squared =          56.55 using 59 PHA bins.
# Reduced chi-squared =          1.010 for     56 degrees of freedom
# Null hypothesis probability =   4.544605e-01

Photon flux (15-150 keV)    in 1 sec: 1.38178 ( -0.14648  0.14592 ) ph/cm2/s
Energy fluence (15-150 keV)             : 1.12001e-07 ( -1.46972e-08  1.4741e-08 ) ergs/cm2
Band function

Time interval is from    0.912 sec. to    1.912 sec.

Spectral model in the Band function:
------------------------------------------------------------
Parameters  : value       lower 90%   higher 90%
alpha       : -0.462254   ( -0.758289   0.461605 )
beta        : -1.92703    ( 1.93499   0.670622 )
Epeak [keV] : 91.0668      ( -64.6051 349.699 )
Norm@50keV   : 3.15525E-02    ( -0.0192327   186.02 )
------------------------------------------------------------
#Fit statistic : Chi-Squared =          56.45 using 59 PHA bins.
# Reduced chi-squared =          1.026 for     55 degrees of freedom
# Null hypothesis probability =   4.204322e-01

Photon flux (15-150 keV)    in 1 sec: 1.38005 ( 5.61995  -0.1459 ) ph/cm2/s
Energy fluence (15-150 keV)             : 1.12033e-07 ( 0  0 ) ergs/cm2
Single BB

Spectral model blackbody:
------------------------------------------------------------
Parameters  : value    Lower 90%  Upper 90%
kT [keV]    : 16.5909  (-1.93164  2.23954)
R^2/D10^2   : 0.122486  (-0.0426169   0.0633087)
(R is the radius in km and D10 is the distance to the source in units of 10 kpc)
------------------------------------------------------------
#Fit statistic : Chi-Squared =          69.27 using 59 PHA bins.
# Reduced chi-squared =          1.215 for     57 degrees of freedom
# Null hypothesis probability =   1.277700e-01

Energy  Fluence     90% Error
[keV]   [erg/cm2]   [erg/cm2]
15- 25  6.911e-09   1.412e-09
25- 50  2.998e-08   4.420e-09
50-150  5.845e-08   1.176e-08
15-150  9.534e-08   1.350e-08
Thermal bremsstrahlung (OTTB)

Spectral model: thermal bremsstrahlung
------------------------------------------------------------
Parameters  : value         Lower 90%    Upper 90%
kT [keV]    : 200.000       (      )
Norm        : 5.74807       (-0.586134     0.586135)
------------------------------------------------------------
#Fit statistic : Chi-Squared =          64.35 using 59 PHA bins.
# Reduced chi-squared =          1.129 for     57 degrees of freedom
# Null hypothesis probability =   2.348842e-01

Energy  Fluence     90% Error
[keV]   [erg/cm2]   [erg/cm2]
15- 25  1.440e-08   4.546e-09
25- 50  2.770e-08   8.725e-09
50-150  6.076e-08   3.286e-08
15-150  1.029e-07   4.409e-08
Double BB

Spectral model: bbodyrad<1> + bbodyrad<2>
------------------------------------------------------------
Parameters  : value         Lower 90%    Upper 90%
kT1 [keV]   : 6.83606        (-2.8277      5.51386)
R1^2/D10^2  : 1.10715        (-0.848971      5.96424)
kT2 [keV]   : 23.3569        (-5.23184      33.5906)
R2^2/D10^2  : 3.19594E-02    (-0.0299517   0.0509341)
------------------------------------------------------------
#Fit statistic : Chi-Squared =          56.84 using 59 PHA bins.
# Reduced chi-squared =          1.033 for     55 degrees of freedom
# Null hypothesis probability =   4.063867e-01

Energy  Fluence     90% Error
[keV]   [erg/cm2]   [erg/cm2]
15- 25  1.124e-08   6.058e-09
25- 50  2.776e-08   1.281e-08
50-150  7.150e-08   3.850e-08
15-150  1.105e-07   5.539e-08
Pre-slew spectrum (Pre-slew PHA with pre-slew DRM)
Power-law model
Spectral model in power-law:
------------------------------------------------------------
Parameters  : value       lower 90%   higher 90%
Photon index: 1.28990     ( -0.096605   0.0964322 )
Norm@50keV  : 4.73514E-03    ( -0.000281761   0.00028159 )
------------------------------------------------------------
#Fit statistic : Chi-Squared =          56.64 using 59 PHA bins.
# Reduced chi-squared =         0.9938 for     57 degrees of freedom
# Null hypothesis probability =   4.883742e-01

Photon flux (15-150 keV)    in 14.78 sec: 0.563877 ( -0.033854  0.0338782 ) ph/cm2/s
Energy fluence (15-150 keV)             : 6.93312e-07 ( -4.60022e-08  4.62481e-08 ) ergs/cm2
Cutoff power-law model

Spectral model in the cutoff power-law:
------------------------------------------------------------
Parameters  : value       lower 90%   higher 90%
Photon index: 0.163245     ( -0.492791   0.44145 )
Epeak [keV] : 83.8843      ( -11.8 22.1754 )
Norm@50keV  : 1.69204E-02    ( -0.00649474   0.0119689 )
------------------------------------------------------------
#Fit statistic : Chi-Squared =          34.48 using 59 PHA bins.
# Reduced chi-squared =         0.6157 for     56 degrees of freedom
# Null hypothesis probability =   9.895278e-01

Photon flux (15-150 keV)    in 14.78 sec: 0.539877 ( -0.035109  0.0351 ) ph/cm2/s
Energy fluence (15-150 keV)             : 6.43444e-07 ( -4.94288e-08  5.00303e-08 ) ergs/cm2
Band function

Spectral model in the Band function:
------------------------------------------------------------
Parameters  : value       lower 90%   higher 90%
alpha       : -0.163320   ( -0.348691   0.521986 )
beta        : -10.0000    ( 10   3.55271e-15 )
Epeak [keV] : 83.8751      ( -11.8001 22.186 )
Norm@50keV   : 1.69199E-02    ( -0.00648472   0.0119884 )
------------------------------------------------------------
#Fit statistic : Chi-Squared =          34.48 using 59 PHA bins.
# Reduced chi-squared =         0.6269 for     55 degrees of freedom
# Null hypothesis probability =   9.863081e-01

Photon flux (15-150 keV)    in 14.78 sec: 0.546976 ( 6.45302  -0.045364 ) ph/cm2/s
Energy fluence (15-150 keV)             : 6.43626e-07 ( -6.43523e-07  -4.97229e-08 ) ergs/cm2
S(25-50 keV) vs. S(50-100 keV) plot

S(25-50 keV)  = 1.67e-07
S(50-100 keV) = 2.57e-07
T90 vs. Hardness ratio plot

T90                                   = 12.6359999775887 sec.
Hardness ratio (energy fluence ratio) = 1.53892
Color vs. Color plot

Count Ratio  (25-50 keV) / (15-25 keV) = 1.74649
Count Ratio (50-100 keV) / (15-25 keV) = 1.40141
Mask shadow pattern
IMX = -1.453814624393525E-01, IMY = -4.449136204728642E-02
TIME vs. PHA plot around the trigger time

TIME vs. DetID plot around the trigger time

100 us light curve (15-350 keV)
Spacecraft aspect plot

Bright source in the pre-burst/pre-slew/post-slew images
Pre-burst image of 15-350 keV band
Time interval of the image:
-239.536000 -4.616000

# RAcent  DECcent POSerr Theta    Phi  PeakCts   SNR AngSep     Name
#  [deg]    [deg]    ['] [deg]  [deg]                   [']
254.4966  35.3106    2.7  44.4   18.8   1.7080   4.3    2.7	Her X-1
169.7336  17.2123    2.7  46.3  138.7   3.4858   4.2 ------	UNKNOWN
132.9946  33.1649    2.5  48.4 -170.9   1.8080   4.6 ------	UNKNOWN
138.8562  61.0434    3.7  27.5 -138.8   0.6250   3.1 ------	UNKNOWN
 83.1395  70.5742    3.8  41.8 -104.5   2.5350   3.1 ------	UNKNOWN
Pre-slew background subtracted image of 15-350 keV band
Time interval of the image:
-4.616000 10.164620

# RAcent  DECcent POSerr Theta    Phi  PeakCts   SNR AngSep     Name
#  [deg]    [deg]    ['] [deg]  [deg]                   [']
254.3480  35.3165    8.5  44.3   19.0   0.1224   1.4    5.6	Her X-1
254.7634  28.2780    2.7  50.2   24.3   0.7579   4.3 ------	UNKNOWN
230.1737  43.2888    2.4  26.2   35.4   0.2543   4.9 ------	UNKNOWN
183.1023  54.3751    0.4   8.6  163.0   1.0972  26.2 ------	UNKNOWN
273.1531  57.7483    1.9  38.0  -19.4   0.3380   6.1 ------	UNKNOWN
331.4357  73.1352    2.4  44.1  -60.1   0.8025   4.8 ------	UNKNOWN
Post-slew image of 15-350 keV band
Time interval of the image:
38.564590 66.164590

# RAcent  DECcent POSerr Theta    Phi  PeakCts   SNR AngSep     Name
#  [deg]    [deg]    ['] [deg]  [deg]                   [']
254.4744  35.2915    3.0  51.6   17.7   0.7916   3.9    3.2	Her X-1
154.7370   9.0178    2.5  50.7  154.2   1.1821   4.7 ------	UNKNOWN
138.3688  19.0685    2.0  49.0  178.7   0.7170   5.7 ------	UNKNOWN
105.9339  42.2956    3.0  50.0 -133.5   0.9709   3.9 ------	UNKNOWN
319.5085  72.2628    2.1  49.8  -47.2   1.3055   5.6 ------	UNKNOWN
Plot creation:
Sat May 30 17:05:41 EDT 2015