Special notes of this burst
Image
Pre-slew 15.0-350.0 keV image (Event data)
#   RAcent    DECcent   POSerr    Theta     Phi              Peak Cts       SNR   Name
  138.5764    -0.1437   0.0159    43.2770  -171.5646         0.7365808     12.205 TRIG_00554996

Foreground time interval of the image:
 -0.196   9.749 (delta_t =   9.945 [sec])
Background time interval of the image:
-239.152  -0.196 (delta_t = 238.956 [sec])
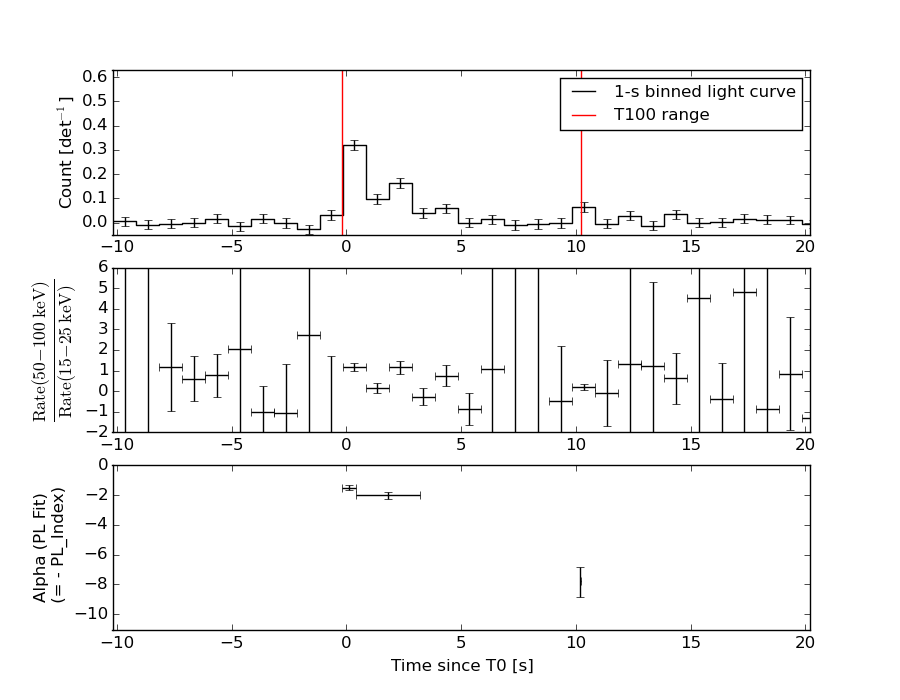
Lightcurves
Notes:
- 1) The mask-weighted light curves are using the flight position.
- 2) Multiple plots of different time binning/intervals are shown to cover all scenarios of short/long GRBs, rate/image triggers, and real/false positives.
- 3) For all the mask-weighted lightcurves, the y-axis units are counts/sec/det where a det is 0.4 x 0.4 = 0.16 sq cm.
- 4) The verticle lines correspond to following: green dotted lines are T50 interval, black dotted lines are T90 interval, blue solid line(s) is a spacecraft slew start time, and orange solid line(s) is a spacecraft slew end time.
- 5) Time of each bin is in the middle of the bin.
1 s binning
From T0-310 s to T0+310 s
From T100_start - 20 s to T100_end + 30 s
Full time interval
64 ms binning
Full time interval
From T100_start to T100_end
From T0-5 sec to T0+5 sec
16 ms binning
From T100_start-5 s to T100_start+5 s
Blue+Cyan dotted lines: Time interval of the scaled map
From 0.000000 to 0.064000
8 ms binning
From T100_start-3 s to T100_start+3 s
Blue+Cyan dotted lines: Time interval of the scaled map
From 0.000000 to 0.064000
2 ms binning
From T100_start-1 s to T100_start+1 s
Blue+Cyan dotted lines: Time interval of the scaled map
From 0.000000 to 0.064000
SN=5 or 10 sec. binning (whichever binning is satisfied first)
SN=5 or 10 sec. binning (T < 200 sec)
Quad-rate summed light curves (from T0-300s to T0+1000s)

The mask-weighted light curves based on cleaned DPHs

Spectral Evolution
Spectra
Notes:
- 1) The fitting includes the systematic errors.
- 2) When the burst includes telescope slew time periods, the fitting uses an average response file made from multiple 5-s response files through out the slew time plus single time preiod for the non-slew times, and weighted by the total counts in the corresponding time period using addrmf. An average response file is needed becuase a spectral fit using the pre-slew DRM will introduce some errors in both a spectral shape and a normalization if the PHA file contains a lot of the slew/post-slew time interval.
- 3) For fits to more complicated models (e.g. a power-law over a cutoff power-law), the BAT team has decided to require a chi-square improvement of more than 6 for each extra dof.
Time averaged spectrum fit using the average DRM
Power-law model
Time interval is from   -0.196 sec. to   10.204 sec.

Spectral model in power-law:
------------------------------------------------------------
Parameters  : value       lower 90%   higher 90%
Photon index: 1.85624     ( -0.248946   0.264642 )
Norm@50keV  : 4.50367E-03    ( -0.000728237   0.000705369 )
------------------------------------------------------------
#Fit statistic : Chi-Squared =          61.30 using 59 PHA bins.
# Reduced chi-squared =          1.075 for     57 degrees of freedom
# Null hypothesis probability =   3.244095e-01

Photon flux (15-150 keV)    in 10.4 sec: 0.634649 ( -0.0853884  0.0854754 ) ph/cm2/s
Energy fluence (15-150 keV)             : 4.30637e-07 ( -6.81977e-08  6.97213e-08 ) ergs/cm2
Cutoff power-law model
Time interval is from   -0.196 sec. to   10.204 sec.
Spectral model in the cutoff power-law:
------------------------------------------------------------
Parameters  : value       lower 90%   higher 90%
Photon index: 1.73591     ( -1.1089   0.590227 )
Epeak [keV] : 98.8664      ( -99.2713 -99.2864 )
Norm@50keV  : 5.24559E-03    ( -0.00524052   0.0157674 )
------------------------------------------------------------
#Fit statistic : Chi-Squared =          61.26 using 59 PHA bins.
# Reduced chi-squared =          1.094 for     56 degrees of freedom
# Null hypothesis probability =   2.929955e-01

Photon flux (15-150 keV)    in 10.4 sec: 0.631299 ( -0.086014  0.087864 ) ph/cm2/s
Energy fluence (15-150 keV)             : 4.25955e-07 ( -7.78877e-08  7.34677e-08 ) ergs/cm2
Band function

Time interval is from   -0.196 sec. to   10.204 sec.

Spectral model in the Band function:
------------------------------------------------------------
Parameters  : value       lower 90%   higher 90%
alpha       : -1.72778   ( 1.596   6.49788 )
beta        : -2.18062    ( 1.963   11.9361 )
Epeak [keV] : 94.1928      ( -89.2773 -89.2773 )
Norm@50keV   : 5.30736E-03    ( -0.00162826   0.513417 )
------------------------------------------------------------
#Fit statistic : Chi-Squared =          61.26 using 59 PHA bins.
# Reduced chi-squared =          1.114 for     55 degrees of freedom
# Null hypothesis probability =   2.616161e-01

Photon flux (15-150 keV)    in 10.4 sec:  (    ) ph/cm2/s
Energy fluence (15-150 keV)             : 0 ( 0  0 ) ergs/cm2
Single BB
Spectral model blackbody:
------------------------------------------------------------
Parameters  : value    Lower 90%  Upper 90%
kT [keV]    : 11.5608  (-1.9426  2.27701)
R^2/D10^2   : 0.170164  (-0.0825102   0.166849)
(R is the radius in km and D10 is the distance to the source in units of 10 kpc)
------------------------------------------------------------
#Fit statistic : Chi-Squared =          76.12 using 59 PHA bins.
# Reduced chi-squared =          1.336 for     57 degrees of freedom
# Null hypothesis probability =   4.612622e-02

Energy  Fluence     90% Error
[keV]   [erg/cm2]   [erg/cm2]
15- 25  4.983e-08   1.292e-08
25- 50  1.500e-07   2.626e-08
50-150  1.175e-07   3.619e-08
15-150  3.172e-07   6.874e-08
Thermal bremsstrahlung (OTTB)
Spectral model: thermal bremsstrahlung
------------------------------------------------------------
Parameters  : value         Lower 90%    Upper 90%
kT [keV]    : 92.0485       (-35.0739      84.2881)
Norm        : 2.84452       (-0.514818     0.685127)
------------------------------------------------------------
#Fit statistic : Chi-Squared =          61.77 using 59 PHA bins.
# Reduced chi-squared =          1.084 for     57 degrees of freedom
# Null hypothesis probability =   3.097054e-01

Energy  Fluence     90% Error
[keV]   [erg/cm2]   [erg/cm2]
15- 25  7.724e-08   1.398e-08
25- 50  1.313e-07   2.574e-08
50-150  2.027e-07   1.047e-07
15-150  4.112e-07   1.259e-07
Double BB
Spectral model: bbodyrad<1> + bbodyrad<2>
------------------------------------------------------------
Parameters  : value         Lower 90%    Upper 90%
kT1 [keV]   : 4.64818        (-1.80614      2.69761)
R1^2/D10^2  : 3.55348        (-2.89844      33.8703)
kT2 [keV]   : 17.9477        (-4.58599      11.9234)
R2^2/D10^2  : 2.69828E-02    (-0.0231769   0.0313674)
------------------------------------------------------------
#Fit statistic : Chi-Squared =          61.61 using 59 PHA bins.
# Reduced chi-squared =          1.120 for     55 degrees of freedom
# Null hypothesis probability =   2.514934e-01

Energy  Fluence     90% Error
[keV]   [erg/cm2]   [erg/cm2]
15- 25  8.462e-08   4.640e-08
25- 50  1.197e-07   6.066e-08
50-150  1.963e-07   1.172e-07
15-150  4.007e-07   1.904e-07
Peak spectrum fit
Power-law model
Time interval is from   -0.216 sec. to    0.784 sec.

Spectral model in power-law:
------------------------------------------------------------
Parameters  : value       lower 90%   higher 90%
Photon index: 1.72382     ( -0.178161   0.1856 )
Norm@50keV  : 2.15935E-02    ( -0.00261545   0.00257985 )
------------------------------------------------------------
#Fit statistic : Chi-Squared =          82.58 using 59 PHA bins.
# Reduced chi-squared =          1.449 for     57 degrees of freedom
# Null hypothesis probability =   1.501478e-02

Photon flux (15-150 keV)    in 1 sec: 2.89213 ( -0.317368  0.317546 ) ph/cm2/s
Energy fluence (15-150 keV)             : 1.99582e-07 ( -2.49604e-08  2.52784e-08 ) ergs/cm2
Cutoff power-law model
Time interval is from   -0.216 sec. to    0.784 sec.
Spectral model in the cutoff power-law:
------------------------------------------------------------
Parameters  : value       lower 90%   higher 90%
Photon index: 0.648154     ( -0.900532   0.763361 )
Epeak [keV] : 58.8106      ( -11.4416 33.6278 )
Norm@50keV  : 8.11766E-02    ( -0.0487548   0.160043 )
------------------------------------------------------------
#Fit statistic : Chi-Squared =          76.46 using 59 PHA bins.
# Reduced chi-squared =          1.365 for     56 degrees of freedom
# Null hypothesis probability =   3.599775e-02

Photon flux (15-150 keV)    in 1 sec: 2.80206 ( -0.32275  0.32326 ) ph/cm2/s
Energy fluence (15-150 keV)             : 1.86729e-07 ( -2.5827e-08  2.6685e-08 ) ergs/cm2
Band function
Time interval is from   -0.216 sec. to    0.784 sec.

Spectral model in the Band function:
------------------------------------------------------------
Parameters  : value       lower 90%   higher 90%
alpha       : 4.89340   ( -6.28953   -4.8934 )
beta        : -1.98206    ( -0.324363   0.24297 )
Epeak [keV] : 27.9043      ( -4.13419 4.00804 )
Norm@50keV   : 1226.47    ( -131.803   3942.5 )
------------------------------------------------------------
#Fit statistic : Chi-Squared =          76.52 using 59 PHA bins.
# Reduced chi-squared =          1.391 for     55 degrees of freedom
# Null hypothesis probability =   2.911290e-02

Photon flux (15-150 keV)    in 1 sec: 2.82020 (    ) ph/cm2/s
Energy fluence (15-150 keV)             : 1.87229e-07 ( 0  0 ) ergs/cm2
Single BB
Spectral model blackbody:
------------------------------------------------------------
Parameters  : value    Lower 90%  Upper 90%
kT [keV]    : 13.0347  (-1.60556  1.77089)
R^2/D10^2   : 0.544043  (-0.201639   0.329064)
(R is the radius in km and D10 is the distance to the source in units of 10 kpc)
------------------------------------------------------------
#Fit statistic : Chi-Squared =          88.74 using 59 PHA bins.
# Reduced chi-squared =          1.557 for     57 degrees of freedom
# Null hypothesis probability =   4.508891e-03

Energy  Fluence     90% Error
[keV]   [erg/cm2]   [erg/cm2]
15- 25  1.960e-08   3.755e-09
25- 50  6.771e-08   9.550e-09
50-150  7.285e-08   1.731e-08
15-150  1.602e-07   2.285e-08
Thermal bremsstrahlung (OTTB)
Spectral model: thermal bremsstrahlung
------------------------------------------------------------
Parameters  : value         Lower 90%    Upper 90%
kT [keV]    : 117.469       (-38.8986      71.8202)
Norm        : 12.4490       (-1.60792     2.00565)
------------------------------------------------------------
#Fit statistic : Chi-Squared =          78.33 using 59 PHA bins.
# Reduced chi-squared =          1.374 for     57 degrees of freedom
# Null hypothesis probability =   3.196309e-02

Energy  Fluence     90% Error
[keV]   [erg/cm2]   [erg/cm2]
15- 25  3.245e-08   4.880e-09
25- 50  5.784e-08   9.015e-09
50-150  1.021e-07   4.693e-08
15-150  1.924e-07   5.850e-08
Double BB
Spectral model: bbodyrad<1> + bbodyrad<2>
------------------------------------------------------------
Parameters  : value         Lower 90%    Upper 90%
kT1 [keV]   : 5.73267        (-1.53903      2.13586)
R1^2/D10^2  : 5.64412        (-3.74325      13.9952)
kT2 [keV]   : 18.2970        (-3.30336      5.52276)
R2^2/D10^2  : 0.123926    (-0.0832587   0.141585)
------------------------------------------------------------
#Fit statistic : Chi-Squared =          73.91 using 59 PHA bins.
# Reduced chi-squared =          1.344 for     55 degrees of freedom
# Null hypothesis probability =   4.536479e-02

Energy  Fluence     90% Error
[keV]   [erg/cm2]   [erg/cm2]
15- 25  3.128e-08   1.673e-08
25- 50  5.943e-08   2.855e-08
50-150  9.595e-08   5.364e-08
15-150  1.866e-07   8.209e-08
Pre-slew spectrum (Pre-slew PHA with pre-slew DRM)
Power-law model
Spectral model in power-law:
------------------------------------------------------------
Parameters  : value       lower 90%   higher 90%
Photon index: 1.71154     ( -0.243056   0.252432 )
Norm@50keV  : 4.60476E-03    ( -0.000713131   0.000698621 )
------------------------------------------------------------
#Fit statistic : Chi-Squared =          63.26 using 59 PHA bins.
# Reduced chi-squared =          1.110 for     57 degrees of freedom
# Null hypothesis probability =   2.649561e-01

Photon flux (15-150 keV)    in 9.945 sec: 0.614050 ( -0.0856822  0.0857642 ) ph/cm2/s
Energy fluence (15-150 keV)             : 4.23628e-07 ( -6.77615e-08  6.90847e-08 ) ergs/cm2
Cutoff power-law model
Spectral model in the cutoff power-law:
------------------------------------------------------------
Parameters  : value       lower 90%   higher 90%
Photon index: 1.27959     ( -1.20431   0.976263 )
Epeak [keV] : 75.4327      (   )
Norm@50keV  : 7.94702E-03    (     )
------------------------------------------------------------
#Fit statistic : Chi-Squared =          62.71 using 59 PHA bins.
# Reduced chi-squared =          1.120 for     56 degrees of freedom
# Null hypothesis probability =   2.505418e-01

Photon flux (15-150 keV)    in 9.945 sec: 0.603618 ( -0.089243  0.088894 ) ph/cm2/s
Energy fluence (15-150 keV)             : 4.06448e-07 ( -7.76555e-08  7.89852e-08 ) ergs/cm2
Band function

Spectral model in the Band function:
------------------------------------------------------------
Parameters  : value       lower 90%   higher 90%
alpha       : 4.81855   ( -4.81855   -4.81855 )
beta        : -1.84767    ( -0.413665   0.288071 )
Epeak [keV] : 24.5863      ( -24.5863 6.3531 )
Norm@50keV   : 485.147    ( -66.6008   3.56131e+06 )
------------------------------------------------------------
#Fit statistic : Chi-Squared =          61.65 using 59 PHA bins.
# Reduced chi-squared =          1.121 for     55 degrees of freedom
# Null hypothesis probability =   2.503566e-01

Photon flux (15-150 keV)    in 9.945 sec:  (    ) ph/cm2/s
Energy fluence (15-150 keV)             : 4.07261e-07 ( 0  0 ) ergs/cm2
S(25-50 keV) vs. S(50-100 keV) plot
S(25-50 keV)  = 1.24e-07
S(50-100 keV) = 1.37e-07
T90 vs. Hardness ratio plot
T90                                   = 7.567999958992 sec.
Hardness ratio (energy fluence ratio) = 1.10484
Color vs. Color plot
Count Ratio  (25-50 keV) / (15-25 keV) = 1.04605
Count Ratio (50-100 keV) / (15-25 keV) = 0.834012
Mask shadow pattern
IMX = -9.314096645177184E-01, IMY = 1.381271159145886E-01
TIME vs. PHA plot around the trigger time
Blue+Cyan dotted lines: Time interval of the scaled map
From 0.000000 to 0.064000
TIME vs. DetID plot around the trigger time
Blue+Cyan dotted lines: Time interval of the scaled map
From 0.000000 to 0.064000
100 us light curve (15-350 keV)
Blue+Cyan dotted lines: Time interval of the scaled map
From 0.000000 to 0.064000
Spacecraft aspect plot
Bright source in the pre-burst/pre-slew/post-slew images
Pre-burst image of 15-350 keV band
Time interval of the image:
-239.152000 -0.196000

# RAcent  DECcent POSerr Theta    Phi  PeakCts   SNR AngSep     Name
#  [deg]    [deg]    ['] [deg]  [deg]                   [']
182.5164  10.3084    2.9  19.6  103.9   1.0040   4.0 ------	UNKNOWN
232.7177  45.5931    2.0  49.8    4.9   2.9460   5.7 ------	UNKNOWN
193.3907  43.5903    2.9  22.8   -6.8   0.8384   4.0 ------	UNKNOWN
203.1304  62.0693    2.1  39.6  -25.8   1.8004   5.6 ------	UNKNOWN
Pre-slew background subtracted image of 15-350 keV band
Time interval of the image:
-0.196000 9.748600

# RAcent  DECcent POSerr Theta    Phi  PeakCts   SNR AngSep     Name
#  [deg]    [deg]    ['] [deg]  [deg]                   [']
165.5934 -18.0130    1.9  46.3  142.6   0.9392   6.3 ------	UNKNOWN
165.5766  -1.2106    2.1  29.8  147.9   0.2847   5.5 ------	UNKNOWN
138.5764  -0.1437    1.0  43.3 -171.6   0.7366  12.2 ------	UNKNOWN
Post-slew image of 15-350 keV band
Time interval of the image:
74.948630 620.748610

# RAcent  DECcent POSerr Theta    Phi  PeakCts   SNR AngSep     Name
#  [deg]    [deg]    ['] [deg]  [deg]                   [']
135.4991 -40.6034    4.5  40.6  168.1   1.7848   2.6    3.2	Vela X-1
169.0518 -30.0830    2.9  41.7  123.2   6.0111   3.9 ------	UNKNOWN
162.8410  22.8983    2.8  33.0   28.6   2.0571   4.2 ------	UNKNOWN
128.2206 -49.2475    2.9  49.9  173.3   4.2283   4.0 ------	UNKNOWN
 94.2641 -43.6631    4.7  58.7 -159.3   8.0336   2.5 ------	UNKNOWN
105.3587  35.4240    3.8  47.1  -53.0   6.5242   3.1 ------	UNKNOWN
 92.8254 -18.4173    3.4  48.5 -130.3   7.2044   3.4 ------	UNKNOWN
Plot creation:
Sat May 30 17:00:21 EDT 2015