Click here for the BAT GCN circular template
Image
Pre-slew 15.0-350.0 keV image (Event data)

#   RAcent    DECcent   POSerr    Theta     Phi              Peak Cts       SNR   Name
  272.4591   -16.3220   0.0093    13.8605  -173.7126         1.9221961     20.799 TRIG_00555096

Foreground time interval of the image:
-31.064  21.669 (delta_t =  52.733 [sec])
Background time interval of the image:
-239.832 -31.064 (delta_t = 208.768 [sec])
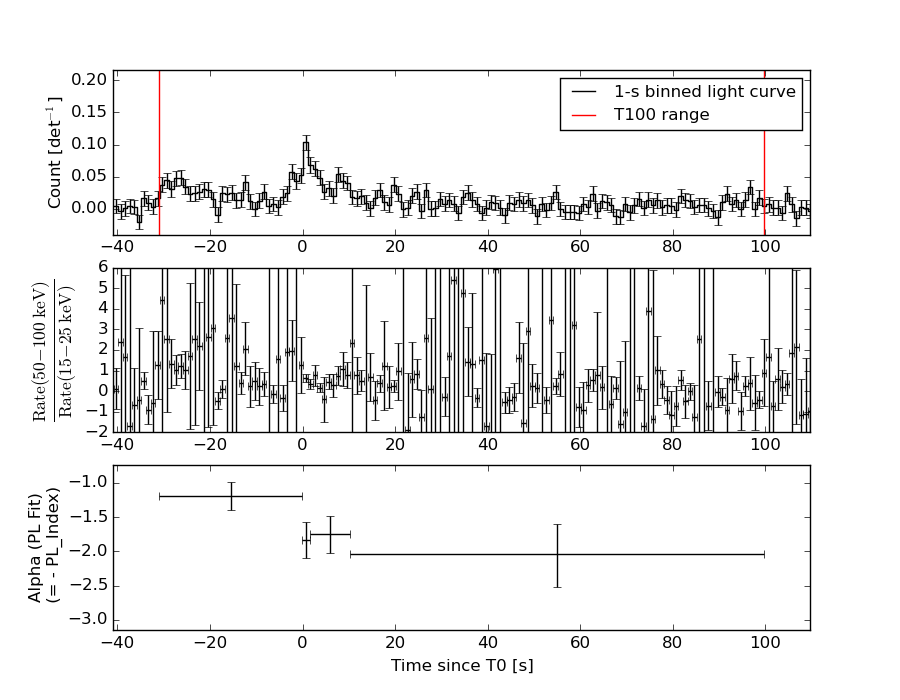
Lightcurves
Notes:
- 1) The mask-weighted light curves are using the flight position.
- 2) Multiple plots of different time binning/intervals are shown to cover all scenarios of short/long GRBs, rate/image triggers, and real/false positives.
- 3) For all the mask-weighted lightcurves, the y-axis units are counts/sec/det where a det is 0.4 x 0.4 = 0.16 sq cm.
- 4) The verticle lines correspond to following: green dotted lines are T50 interval, black dotted lines are T90 interval, blue solid line(s) is a spacecraft slew start time, and orange solid line(s) is a spacecraft slew end time.
- 5) Time of each bin is in the middle of the bin.
1 s binning
From T0-310 s to T0+310 s

From T100_start - 20 s to T100_end + 30 s
Full time interval

64 ms binning
Full time interval
From T100_start to T100_end
From T0-5 sec to T0+5 sec
16 ms binning
From T100_start-5 s to T100_start+5 s
Blue+Cyan dotted lines: Time interval of the scaled map
From 0.000000 to 1.408000
8 ms binning
From T100_start-3 s to T100_start+3 s

Blue+Cyan dotted lines: Time interval of the scaled map
From 0.000000 to 1.408000
2 ms binning
From T100_start-1 s to T100_start+1 s

Blue+Cyan dotted lines: Time interval of the scaled map
From 0.000000 to 1.408000
SN=5 or 10 sec. binning (whichever binning is satisfied first)

SN=5 or 10 sec. binning (T < 200 sec)
Quad-rate summed light curves (from T0-300s to T0+1000s)
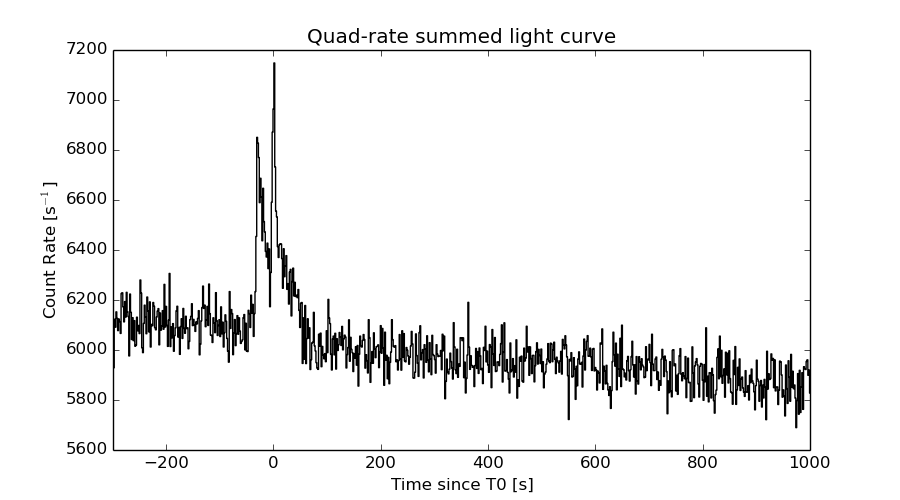
The mask-weighted light curves based on cleaned DPHs

Spectral Evolution
Spectra
Notes:
- 1) The fitting includes the systematic errors.
- 2) When the burst includes telescope slew time periods, the fitting uses an average response file made from multiple 5-s response files through out the slew time plus single time preiod for the non-slew times, and weighted by the total counts in the corresponding time period using addrmf. An average response file is needed becuase a spectral fit using the pre-slew DRM will introduce some errors in both a spectral shape and a normalization if the PHA file contains a lot of the slew/post-slew time interval.
- 3) For fits to more complicated models (e.g. a power-law over a cutoff power-law), the BAT team has decided to require a chi-square improvement of more than 6 for each extra dof.
Time averaged spectrum fit using the average DRM
Power-law model
Time interval is from  -31.064 sec. to   99.624 sec.

Spectral model in power-law:
------------------------------------------------------------
Parameters  : value       lower 90%   higher 90%
Photon index: 1.60955     ( -0.175058   0.176926 )
Norm@50keV  : 9.78043E-04    ( -0.000102678   0.00010189 )
------------------------------------------------------------
#Fit statistic : Chi-Squared =          71.70 using 59 PHA bins.
# Reduced chi-squared =          1.258 for     57 degrees of freedom
# Null hypothesis probability =   9.093038e-02

Photon flux (15-150 keV)    in 130.7 sec: 0.126058 ( -0.0128535  0.0128794 ) ph/cm2/s
Energy fluence (15-150 keV)             : 1.19412e-06 ( -1.33524e-07  1.35182e-07 ) ergs/cm2
Cutoff power-law model

Time interval is from  -31.064 sec. to   99.624 sec.
Spectral model in the cutoff power-law:
------------------------------------------------------------
Parameters  : value       lower 90%   higher 90%
Photon index: 0.960221     ( -0.820498   0.683628 )
Epeak [keV] : 76.1230      ( -21.0569 -76.123 )
Norm@50keV  : 2.13723E-03    ( -0.00117695   0.00346662 )
------------------------------------------------------------
#Fit statistic : Chi-Squared =          69.09 using 59 PHA bins.
# Reduced chi-squared =          1.234 for     56 degrees of freedom
# Null hypothesis probability =   1.124194e-01

Photon flux (15-150 keV)    in 130.7 sec: 0.122068 ( -0.01356  0.013543 ) ph/cm2/s
Energy fluence (15-150 keV)             : 1.12655e-06 ( -1.49151e-07  1.52379e-07 ) ergs/cm2
Band function

Time interval is from  -31.064 sec. to   99.624 sec.

Spectral model in the Band function:
------------------------------------------------------------
Parameters  : value       lower 90%   higher 90%
alpha       : -0.960087   ( -0.643399   0.725572 )
beta        : -10.0000    ( 10   5.32907e-15 )
Epeak [keV] : 76.1055      ( -32.5367 -76.1055 )
Norm@50keV   : 2.13741E-03    ( -0.00117814   0.00346165 )
------------------------------------------------------------
#Fit statistic : Chi-Squared =          69.09 using 59 PHA bins.
# Reduced chi-squared =          1.256 for     55 degrees of freedom
# Null hypothesis probability =   9.583141e-02

Photon flux (15-150 keV)    in 130.7 sec: 0.122192 (    ) ph/cm2/s
Energy fluence (15-150 keV)             : 1.12857e-06 ( 0  0 ) ergs/cm2
Single BB

Spectral model blackbody:
------------------------------------------------------------
Parameters  : value    Lower 90%  Upper 90%
kT [keV]    : 13.8113  (-1.63166  1.89054)
R^2/D10^2   : 1.85717E-02  (-0.00686806   0.0107212)
(R is the radius in km and D10 is the distance to the source in units of 10 kpc)
------------------------------------------------------------
#Fit statistic : Chi-Squared =          85.87 using 59 PHA bins.
# Reduced chi-squared =          1.507 for     57 degrees of freedom
# Null hypothesis probability =   8.015975e-03

Energy  Fluence     90% Error
[keV]   [erg/cm2]   [erg/cm2]
15- 25  9.792e-08   1.829e-08
25- 50  3.593e-07   5.052e-08
50-150  4.481e-07   1.012e-07
15-150  9.053e-07   1.293e-07
Thermal bremsstrahlung (OTTB)

Spectral model: thermal bremsstrahlung
------------------------------------------------------------
Parameters  : value         Lower 90%    Upper 90%
kT [keV]    : 161.151       (-60.7925      -160.578)
Norm        : 0.519006       (-0.0563633     0.0697521)
------------------------------------------------------------
#Fit statistic : Chi-Squared =          69.59 using 59 PHA bins.
# Reduced chi-squared =          1.221 for     57 degrees of freedom
# Null hypothesis probability =   1.222942e-01

Energy  Fluence     90% Error
[keV]   [erg/cm2]   [erg/cm2]
15- 25  1.731e-07   6.863e-08
25- 50  3.241e-07   1.595e-07
50-150  6.584e-07   3.537e-07
15-150  1.156e-06   6.188e-07
Double BB
Spectral model: bbodyrad<1> + bbodyrad<2>
------------------------------------------------------------
Parameters  : value         Lower 90%    Upper 90%
kT1 [keV]   : 5.71632        (-1.71095      2.65212)
R1^2/D10^2  : 0.248478        (-0.179858      0.757143)
kT2 [keV]   : 20.0075        (-4.01571      8.89079)
R2^2/D10^2  : 4.04915E-03    (-0.00309343   0.00567323)
------------------------------------------------------------
#Fit statistic : Chi-Squared =          68.22 using 59 PHA bins.
# Reduced chi-squared =          1.240 for     55 degrees of freedom
# Null hypothesis probability =   1.086396e-01

Energy  Fluence     90% Error
[keV]   [erg/cm2]   [erg/cm2]
15- 25  1.719e-07   8.420e-08
25- 50  3.209e-07   1.209e-07
50-150  6.126e-07   3.023e-07
15-150  1.105e-06   4.347e-07
Peak spectrum fit
Power-law model

Time interval is from   -0.020 sec. to    0.980 sec.

Spectral model in power-law:
------------------------------------------------------------
Parameters  : value       lower 90%   higher 90%
Photon index: 1.60286     ( -0.305578   0.310417 )
Norm@50keV  : 6.67547E-03    ( -0.00126318   0.00124501 )
------------------------------------------------------------
#Fit statistic : Chi-Squared =          44.75 using 59 PHA bins.
# Reduced chi-squared =         0.7851 for     57 degrees of freedom
# Null hypothesis probability =   8.806378e-01

Photon flux (15-150 keV)    in 1 sec: 0.858589 ( -0.155134  0.155466 ) ph/cm2/s
Energy fluence (15-150 keV)             : 6.24081e-08 ( -1.24675e-08  1.27385e-08 ) ergs/cm2
Cutoff power-law model

Time interval is from   -0.020 sec. to    0.980 sec.
Spectral model in the cutoff power-law:
------------------------------------------------------------
Parameters  : value       lower 90%   higher 90%
Photon index: 0.999543     ( -1.89352   0.871362 )
Epeak [keV] : 73.7944      ( -30.9409 -73.8509 )
Norm@50keV  : 1.44422E-02    ( -0.00884584   0.164715 )
------------------------------------------------------------
#Fit statistic : Chi-Squared =          44.12 using 59 PHA bins.
# Reduced chi-squared =         0.7879 for     56 degrees of freedom
# Null hypothesis probability =   8.746635e-01

Photon flux (15-150 keV)    in 1 sec: 0.839117 ( -0.161569  0.160913 ) ph/cm2/s
Energy fluence (15-150 keV)             : 5.84954e-08 ( -1.52095e-08  1.51017e-08 ) ergs/cm2
Band function

Time interval is from   -0.020 sec. to    0.980 sec.

Spectral model in the Band function:
------------------------------------------------------------
Parameters  : value       lower 90%   higher 90%
alpha       : 4.72089   ( -11.1274   -4.72089 )
beta        : -1.99495    ( -0.612655   0.459135 )
Epeak [keV] : 31.1398      ( -12.0047 13.6049 )
Norm@50keV   : 141.703    ( -24.7406   5080.12 )
------------------------------------------------------------
#Fit statistic : Chi-Squared =          41.71 using 59 PHA bins.
# Reduced chi-squared =         0.7584 for     55 degrees of freedom
# Null hypothesis probability =   9.068470e-01

Photon flux (15-150 keV)    in 1 sec:  (    ) ph/cm2/s
Energy fluence (15-150 keV)             : 5.81598e-08 ( -5.81528e-08  -1.31263e-08 ) ergs/cm2
Single BB

Spectral model blackbody:
------------------------------------------------------------
Parameters  : value    Lower 90%  Upper 90%
kT [keV]    : 11.7473  (-2.2334  3.03442)
R^2/D10^2   : 0.231278  (-0.13223   0.273452)
(R is the radius in km and D10 is the distance to the source in units of 10 kpc)
------------------------------------------------------------
#Fit statistic : Chi-Squared =          48.48 using 59 PHA bins.
# Reduced chi-squared =         0.8505 for     57 degrees of freedom
# Null hypothesis probability =   7.818909e-01

Energy  Fluence     90% Error
[keV]   [erg/cm2]   [erg/cm2]
15- 25  6.736e-09   2.243e-09
25- 50  2.067e-08   5.680e-09
50-150  1.691e-08   6.693e-09
15-150  4.431e-08   1.260e-08
Thermal bremsstrahlung (OTTB)

Spectral model: thermal bremsstrahlung
------------------------------------------------------------
Parameters  : value         Lower 90%    Upper 90%
kT [keV]    : 166.405       (-92.2825      -164.713)
Norm        : 3.53116       (-0.656435     0.957487)
------------------------------------------------------------
#Fit statistic : Chi-Squared =          44.20 using 59 PHA bins.
# Reduced chi-squared =         0.7754 for     57 degrees of freedom
# Null hypothesis probability =   8.923199e-01

Energy  Fluence     90% Error
[keV]   [erg/cm2]   [erg/cm2]
15- 25  8.982e-09   5.100e-09
25- 50  1.689e-08   9.170e-09
50-150  3.474e-08   1.981e-08
15-150  6.062e-08   3.453e-08
Double BB

Spectral model: bbodyrad<1> + bbodyrad<2>
------------------------------------------------------------
Parameters  : value         Lower 90%    Upper 90%
kT1 [keV]   : 8.73383        (-2.58946      2.9164)
R1^2/D10^2  : 0.559709        (-0.305628      1.00599)
kT2 [keV]   : 44.5947        (-35.3597      -54.6563)
R2^2/D10^2  : 1.49679E-03    (-0.00084865   0.0250681)
------------------------------------------------------------
#Fit statistic : Chi-Squared =          41.02 using 59 PHA bins.
# Reduced chi-squared =         0.7459 for     55 degrees of freedom
# Null hypothesis probability =   9.193736e-01

Energy  Fluence     90% Error
[keV]   [erg/cm2]   [erg/cm2]
15- 25  8.532e-09   5.005e-09
25- 50  1.907e-08   1.079e-08
50-150  3.281e-08   1.812e-08
15-150  6.041e-08   3.208e-08
Pre-slew spectrum (Pre-slew PHA with pre-slew DRM)
Power-law model

Spectral model in power-law:
------------------------------------------------------------
Parameters  : value       lower 90%   higher 90%
Photon index: 1.41384     ( -0.150953   0.149896 )
Norm@50keV  : 1.86210E-03    ( -0.000162046   0.000161898 )
------------------------------------------------------------
#Fit statistic : Chi-Squared =         102.66 using 59 PHA bins.
# Reduced chi-squared =         1.8011 for     57 degrees of freedom
# Null hypothesis probability =   1.991501e-04

Photon flux (15-150 keV)    in 52.73 sec: 0.227485 ( -0.0204609  0.0205237 ) ph/cm2/s
Energy fluence (15-150 keV)             : 9.46124e-07 ( -8.94923e-08  9.01952e-08 ) ergs/cm2
Cutoff power-law model

Spectral model in the cutoff power-law:
------------------------------------------------------------
Parameters  : value       lower 90%   higher 90%
Photon index: 0.685443     ( -0.705353   0.602293 )
Epeak [keV] : 91.3895      ( -23.4737 168.055 )
Norm@50keV  : 4.27354E-03    ( -0.00208334   0.00502465 )
------------------------------------------------------------
#Fit statistic : Chi-Squared =          98.26 using 59 PHA bins.
# Reduced chi-squared =          1.755 for     56 degrees of freedom
# Null hypothesis probability =   4.157502e-04

Photon flux (15-150 keV)    in 52.73 sec: 0.219099 ( -0.021608  0.021625 ) ph/cm2/s
Energy fluence (15-150 keV)             : 8.9274e-07 ( -9.9665e-08  1.00456e-07 ) ergs/cm2
Band function

Spectral model in the Band function:
------------------------------------------------------------
Parameters  : value       lower 90%   higher 90%
alpha       : -0.670173   ( -0.519247   0.715508 )
beta        : -9.37166    ( 9.36958   19.3696 )
Epeak [keV] : 91.6327      ( -19.3333 146.754 )
Norm@50keV   : 4.31762E-03    ( -0.00211562   0.00209788 )
------------------------------------------------------------
#Fit statistic : Chi-Squared =          98.27 using 59 PHA bins.
# Reduced chi-squared =          1.787 for     55 degrees of freedom
# Null hypothesis probability =   3.028756e-04

Photon flux (15-150 keV)    in 52.73 sec: 0.220276 (    ) ph/cm2/s
Energy fluence (15-150 keV)             : 8.94095e-07 ( 0  0 ) ergs/cm2
S(25-50 keV) vs. S(50-100 keV) plot

S(25-50 keV)  = 3.11e-07
S(50-100 keV) = 4.08e-07
T90 vs. Hardness ratio plot

T90                                   = 120.03200006485 sec.
Hardness ratio (energy fluence ratio) = 1.3119
Color vs. Color plot

Count Ratio  (25-50 keV) / (15-25 keV) = 1.09471
Count Ratio (50-100 keV) / (15-25 keV) = 0.846864
Mask shadow pattern
IMX = -2.452599905297882E-01, IMY = 2.702226795383771E-02
TIME vs. PHA plot around the trigger time
Blue+Cyan dotted lines: Time interval of the scaled map
From 0.000000 to 1.408000
TIME vs. DetID plot around the trigger time

Blue+Cyan dotted lines: Time interval of the scaled map
From 0.000000 to 1.408000
100 us light curve (15-350 keV)

Blue+Cyan dotted lines: Time interval of the scaled map
From 0.000000 to 1.408000
Spacecraft aspect plot
Bright source in the pre-burst/pre-slew/post-slew images
Pre-burst image of 15-350 keV band
Time interval of the image:
-239.832000 -31.064000

# RAcent  DECcent POSerr Theta    Phi  PeakCts   SNR AngSep     Name
#  [deg]    [deg]    ['] [deg]  [deg]                   [']
244.9818 -15.6425    0.3  23.8  100.8  14.2649  40.8    0.2	Sco X-1
256.1066 -37.8200    4.9  12.3   22.8   0.5633   2.3    5.9	4U 1700-377
256.3160 -36.3988    4.7  11.2   27.6   0.6420   2.4    5.9	GX 349+2
262.8637 -24.8564    6.8   5.2  123.3   0.3986   1.7   10.3	GX 1+4
264.6408 -44.5831   11.3  15.6  -14.1   0.2394   1.0    9.1	4U 1735-44
268.2905  -1.2740    0.0  27.8  165.3   0.6192   2.1   11.7	SW J1753.5-0127
270.4120 -25.1475    4.3   5.3 -155.1   0.7153   2.8    8.1	GX 5-1
270.3843 -25.6826    4.8   4.9 -151.1   0.7670   3.0    5.7	GRS 1758-258
273.9804 -14.0077    2.4  16.6 -172.1   1.0953   4.8    2.3	GX 17+2
276.1007 -30.3786    4.3   8.5  -97.1   0.6148   2.7    9.1	H1820-303
285.0268 -24.9096  220.0  17.1 -118.2  -0.0139  -0.1    0.8	HT1900.1-2455
288.7897  10.9351    1.7  45.4 -167.1   3.3158   6.7    0.8	GRS 1915+105
263.0329 -33.8885    4.3   5.7   10.9   0.6132   2.7    3.9	GX 354-0
296.8399  22.3012    3.4  59.1 -165.6   5.2967   3.4 ------	UNKNOWN
300.1702  20.8408    3.2  59.5 -161.7   7.4639   3.6 ------	UNKNOWN
310.6652  -4.6248    3.6  48.4 -130.3   3.4112   3.2 ------	UNKNOWN
Pre-slew background subtracted image of 15-350 keV band
Time interval of the image:
-31.064000 21.668600

# RAcent  DECcent POSerr Theta    Phi  PeakCts   SNR AngSep     Name
#  [deg]    [deg]    ['] [deg]  [deg]                   [']
244.9166 -15.6336  172.3  23.9  100.7   0.0085   0.1    3.7	Sco X-1
255.9681 -38.0022    4.4  12.5   22.6   0.2451   2.6    9.5	4U 1700-377
256.2879 -36.3261    3.4  11.2   28.0  -0.3221  -3.4    9.2	GX 349+2
262.8851 -24.6186    5.1   5.4  124.9  -0.2146  -2.3   10.2	GX 1+4
264.7992 -44.4384    4.8  15.5  -14.4   0.2169   2.4    2.5	4U 1735-44
268.3833  -1.4109   74.2  27.7  165.5   0.0184   0.2    2.7	SW J1753.5-0127
270.4800 -25.0089   12.4   5.4 -155.6  -0.0840  -0.9   11.4	GX 5-1
270.4867 -25.7110    7.4   4.9 -150.1   0.1474   1.6   10.1	GRS 1758-258
273.9904 -14.0152    4.1  16.6 -172.0  -0.2617  -2.8    1.6	GX 17+2
275.8485 -30.4305    3.8   8.3  -96.6   0.2758   3.0    5.5	H1820-303
284.8729 -24.9049    5.5  16.9 -118.4   0.2183   2.1    8.9	HT1900.1-2455
288.8023  10.9391    4.9  45.4 -167.0   0.3884   2.3    0.5	GRS 1915+105
262.9710 -33.6689   13.7   5.5   12.6  -0.0765  -0.8   10.0	GX 354-0
278.2582   8.2434    2.4  39.0 -179.9   0.6843   4.8 ------	UNKNOWN
272.4591 -16.3220    0.6  13.9 -173.7   1.9222  20.8 ------	UNKNOWN
269.0499 -44.0677    2.4  15.2  -26.0   0.4218   4.8 ------	UNKNOWN
Post-slew image of 15-350 keV band
Time interval of the image:
68.468590 962.312600

# RAcent  DECcent POSerr Theta    Phi  PeakCts   SNR AngSep     Name
#  [deg]    [deg]    ['] [deg]  [deg]                   [']
244.9828 -15.6527    0.3  26.3   95.0  55.8380  41.8    0.8	Sco X-1
254.5029  35.2175    4.8  54.3  169.4   8.9587   2.4    7.8	Her X-1
256.1703 -37.9299    9.5  25.9   37.7   1.2991   1.2   10.1	4U 1700-377
256.6184 -36.5223    5.6  24.5   39.1   2.0580   2.0   10.6	GX 349+2
263.1617 -24.6184    6.9  11.9   52.1   1.4334   1.7   11.3	GX 1+4
264.7486 -44.4464   14.4  28.8   18.7   0.7697   0.8    0.3	4U 1735-44
268.4408  -1.5303    3.5  15.3  172.3   2.5950   3.3    6.4	SW J1753.5-0127
270.2770 -25.0830    2.4   9.0   19.7   3.5808   4.8    0.4	GX 5-1
270.2342 -25.8065    6.3   9.7   18.9   1.3942   1.8    5.3	GRS 1758-258
274.0167 -14.0834    3.0   2.8 -137.4   3.1548   3.9    2.9	GX 17+2
275.8424 -30.3491    7.9  14.4   -4.8   1.0706   1.5    4.4	H1820-303
285.0126 -24.8981    5.8  14.6  -44.7   1.7237   2.0    1.9	HT1900.1-2455
288.8020  10.9433    1.0  31.8 -140.8  11.9825  11.3    0.3	GRS 1915+105
263.0555 -33.8079    3.9  19.4   31.3   2.2959   3.0    3.7	GX 354-0
232.8420 -54.6469    3.2  48.9   36.6  12.0047   3.6 ------	UNKNOWN
251.8171  20.3052    2.7  41.8  157.8   7.5242   4.3 ------	UNKNOWN
270.0683 -10.4504    4.1   6.3  166.3   2.3502   2.8 ------	UNKNOWN
277.3487 -23.8842    2.6   8.9  -23.6   3.6783   4.5 ------	UNKNOWN
303.7942 -22.2281    4.3  30.2  -66.4   2.9712   2.7 ------	UNKNOWN
285.1539  42.0215    4.0  59.6 -161.6  21.6284   2.9 ------	UNKNOWN
287.4182  40.7217    4.7  58.8 -159.3  16.4906   2.5 ------	UNKNOWN
	UNKNOWN
Plot creation:
Sat May 30 16:58:31 EDT 2015