Click here for the BAT GCN circular template
Image
Pre-slew 15.0-350.0 keV image (Event data)
#   RAcent    DECcent   POSerr    Theta     Phi              Peak Cts       SNR   Name
  296.2788    -7.9738   0.0045    35.0776  -142.2866         3.7913343     42.498 TRIG_00555821

Foreground time interval of the image:
 -7.088  14.485 (delta_t =  21.573 [sec])
Background time interval of the image:
-214.315  -7.088 (delta_t = 207.227 [sec])
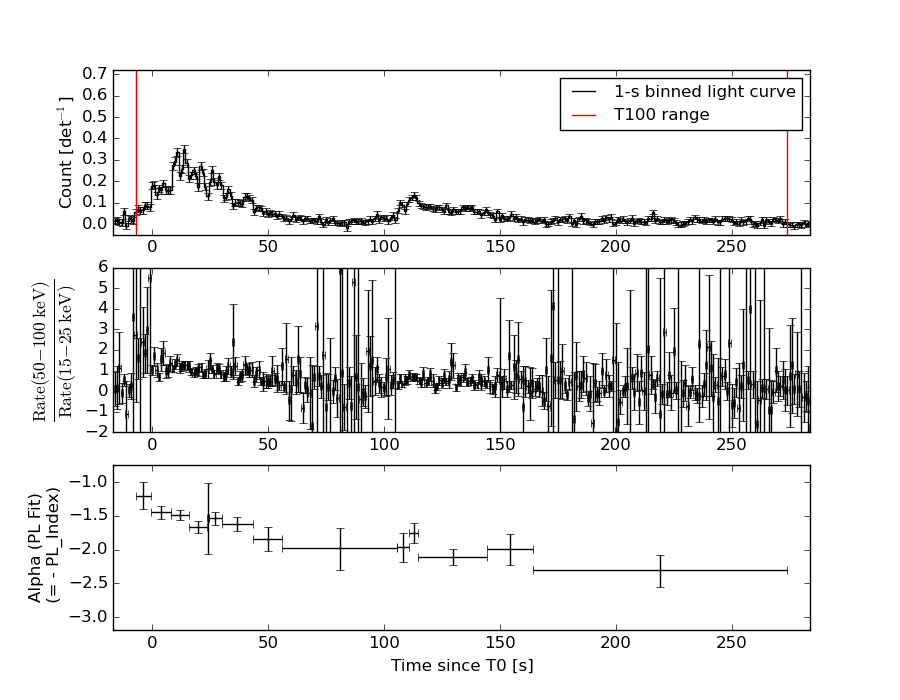
Lightcurves
Notes:
- 1) The mask-weighted light curves are using the flight position.
- 2) Multiple plots of different time binning/intervals are shown to cover all scenarios of short/long GRBs, rate/image triggers, and real/false positives.
- 3) For all the mask-weighted lightcurves, the y-axis units are counts/sec/det where a det is 0.4 x 0.4 = 0.16 sq cm.
- 4) The verticle lines correspond to following: green dotted lines are T50 interval, black dotted lines are T90 interval, blue solid line(s) is a spacecraft slew start time, and orange solid line(s) is a spacecraft slew end time.
- 5) Time of each bin is in the middle of the bin.
1 s binning
From T0-310 s to T0+310 s

From T100_start - 20 s to T100_end + 30 s
Full time interval

64 ms binning
Full time interval

From T100_start to T100_end

From T0-5 sec to T0+5 sec

16 ms binning
From T100_start-5 s to T100_start+5 s
8 ms binning
From T100_start-3 s to T100_start+3 s
2 ms binning
From T100_start-1 s to T100_start+1 s
SN=5 or 10 sec. binning (whichever binning is satisfied first)
SN=5 or 10 sec. binning (T < 200 sec)

Quad-rate summed light curves (from T0-300s to T0+1000s)

The mask-weighted light curves based on cleaned DPHs

Spectral Evolution
Spectra
Notes:
- 1) The fitting includes the systematic errors.
- 2) When the burst includes telescope slew time periods, the fitting uses an average response file made from multiple 5-s response files through out the slew time plus single time preiod for the non-slew times, and weighted by the total counts in the corresponding time period using addrmf. An average response file is needed becuase a spectral fit using the pre-slew DRM will introduce some errors in both a spectral shape and a normalization if the PHA file contains a lot of the slew/post-slew time interval.
- 3) For fits to more complicated models (e.g. a power-law over a cutoff power-law), the BAT team has decided to require a chi-square improvement of more than 6 for each extra dof.
Time averaged spectrum fit using the average DRM
Power-law model
Time interval is from   -7.088 sec. to  273.644 sec.

Spectral model in power-law:
------------------------------------------------------------
Parameters  : value       lower 90%   higher 90%
Photon index: 1.75522     ( -0.0521246   0.0523291 )
Norm@50keV  : 3.47381E-03    ( -9.23006e-05   9.21694e-05 )
------------------------------------------------------------
#Fit statistic : Chi-Squared =          36.25 using 59 PHA bins.
# Reduced chi-squared =         0.6359 for     57 degrees of freedom
# Null hypothesis probability =   9.854800e-01

Photon flux (15-150 keV)    in 280.7 sec: 0.470625 ( -0.0140397  0.0141036 ) ph/cm2/s
Energy fluence (15-150 keV)             : 8.99498e-06 ( -2.44555e-07  2.4489e-07 ) ergs/cm2
Cutoff power-law model
Time interval is from   -7.088 sec. to  273.644 sec.
Spectral model in the cutoff power-law:
------------------------------------------------------------
Parameters  : value       lower 90%   higher 90%
Photon index: 1.64174     ( -0.206251   0.153336 )
Epeak [keV] : 165.530      ( -74.4139 -165.53 )
Norm@50keV  : 3.93205E-03    ( -0.000526595   0.000964046 )
------------------------------------------------------------
#Fit statistic : Chi-Squared =          35.30 using 59 PHA bins.
# Reduced chi-squared =         0.6303 for     56 degrees of freedom
# Null hypothesis probability =   9.861904e-01

Photon flux (15-150 keV)    in 280.7 sec: 0.465870 ( -0.016066  0.015669 ) ph/cm2/s
Energy fluence (15-150 keV)             : 8.915e-06 ( -2.84546e-07  2.80447e-07 ) ergs/cm2
Band function

Time interval is from   -7.088 sec. to  273.644 sec.

Spectral model in the Band function:
------------------------------------------------------------
Parameters  : value       lower 90%   higher 90%
alpha       : -1.25293   ( 1.25362   1.25362 )
beta        : -1.79399    ( 1.79394   0.0745897 )
Epeak [keV] : 51.8389      ( -51.9176 -51.9176 )
Norm@50keV   : 7.03879E-03    ( -0.00388539   0 )
------------------------------------------------------------
#Fit statistic : Chi-Squared =          34.78 using 59 PHA bins.
# Reduced chi-squared =         0.6324 for     55 degrees of freedom
# Null hypothesis probability =   9.848900e-01

Photon flux (15-150 keV)    in 280.7 sec:  (    ) ph/cm2/s
Energy fluence (15-150 keV)             : 0 ( 0  0 ) ergs/cm2
Single BB
Spectral model blackbody:
------------------------------------------------------------
Parameters  : value    Lower 90%  Upper 90%
kT [keV]    : 14.2958  (  )
R^2/D10^2   : 5.58040E-02  (   )
(R is the radius in km and D10 is the distance to the source in units of 10 kpc)
------------------------------------------------------------
#Fit statistic : Chi-Squared =         375.99 using 59 PHA bins.
# Reduced chi-squared =         6.5963 for     57 degrees of freedom
# Null hypothesis probability =   1.597832e-48

Energy  Fluence     90% Error
[keV]   [erg/cm2]   [erg/cm2]
15- 25  6.747e-07   3.621e-08
25- 50  2.562e-06   8.898e-08
50-150  3.484e-06   1.768e-07
15-150  6.720e-06   1.965e-07
Thermal bremsstrahlung (OTTB)
Spectral model: thermal bremsstrahlung
------------------------------------------------------------
Parameters  : value         Lower 90%    Upper 90%
kT [keV]    : 128.919       (      )
Norm        : 1.93500       (-0.082778     0.0711214)
------------------------------------------------------------
#Fit statistic : Chi-Squared =          43.20 using 59 PHA bins.
# Reduced chi-squared =         0.7579 for     57 degrees of freedom
# Null hypothesis probability =   9.116305e-01

Energy  Fluence     90% Error
[keV]   [erg/cm2]   [erg/cm2]
15- 25  1.367e-06   7.635e-08
25- 50  2.503e-06   1.214e-07
50-150  4.766e-06   1.064e-06
15-150  8.636e-06   1.140e-06
Double BB

Spectral model: bbodyrad<1> + bbodyrad<2>
------------------------------------------------------------
Parameters  : value         Lower 90%    Upper 90%
kT1 [keV]   : 6.93636        (-0.596004      0.624081)
R1^2/D10^2  : 0.558158        (-0.149553      0.223701)
kT2 [keV]   : 25.7366        (-2.28647      2.88536)
R2^2/D10^2  : 5.13155E-03    (-0.00166288   0.00217394)
------------------------------------------------------------
#Fit statistic : Chi-Squared =          39.80 using 59 PHA bins.
# Reduced chi-squared =         0.7237 for     55 degrees of freedom
# Null hypothesis probability =   9.387332e-01

Energy  Fluence     90% Error
[keV]   [erg/cm2]   [erg/cm2]
15- 25  1.363e-06   1.156e-07
25- 50  2.553e-06   1.245e-07
50-150  4.850e-06   3.425e-07
15-150  8.766e-06   4.940e-07
Peak spectrum fit
Power-law model

Time interval is from   13.440 sec. to   14.440 sec.

Spectral model in power-law:
------------------------------------------------------------
Parameters  : value       lower 90%   higher 90%
Photon index: 1.49743     ( -0.146923   0.147365 )
Norm@50keV  : 2.35005E-02    ( -0.00210805   0.00210309 )
------------------------------------------------------------
#Fit statistic : Chi-Squared =          72.62 using 59 PHA bins.
# Reduced chi-squared =          1.274 for     57 degrees of freedom
# Null hypothesis probability =   7.944453e-02

Photon flux (15-150 keV)    in 1 sec: 2.93177 ( -0.267813  0.268292 ) ph/cm2/s
Energy fluence (15-150 keV)             : 2.23031e-07 ( -2.14973e-08  2.16167e-08 ) ergs/cm2
Cutoff power-law model

Time interval is from   13.440 sec. to   14.440 sec.
Spectral model in the cutoff power-law:
------------------------------------------------------------
Parameters  : value       lower 90%   higher 90%
Photon index: 0.986999     ( -0.6514   0.558999 )
Epeak [keV] : 99.2175      ( -31.7753 -99.2187 )
Norm@50keV  : 4.27884E-02    ( -0.0199966   0.0475154 )
------------------------------------------------------------
#Fit statistic : Chi-Squared =          70.27 using 59 PHA bins.
# Reduced chi-squared =          1.255 for     56 degrees of freedom
# Null hypothesis probability =   9.502732e-02

Photon flux (15-150 keV)    in 1 sec: 2.88024 ( -0.27401  0.27425 ) ph/cm2/s
Energy fluence (15-150 keV)             : 2.15893e-07 ( -2.3394e-08  2.3251e-08 ) ergs/cm2
Band function

Time interval is from   13.440 sec. to   14.440 sec.

Spectral model in the Band function:
------------------------------------------------------------
Parameters  : value       lower 90%   higher 90%
alpha       : 4.88134   ( -6.96968   -4.88134 )
beta        : -1.70745    ( -0.257794   0.191485 )
Epeak [keV] : 29.5044      ( -4.378 4.51126 )
Norm@50keV   : 776.151    ( -67.8223   2494.48 )
------------------------------------------------------------
#Fit statistic : Chi-Squared =          65.63 using 59 PHA bins.
# Reduced chi-squared =          1.193 for     55 degrees of freedom
# Null hypothesis probability =   1.544249e-01

Photon flux (15-150 keV)    in 1 sec:  (    ) ph/cm2/s
Energy fluence (15-150 keV)             : 2.16219e-07 ( -2.16212e-07  -2.2531e-08 ) ergs/cm2
Single BB
Spectral model blackbody:
------------------------------------------------------------
Parameters  : value    Lower 90%  Upper 90%
kT [keV]    : 14.7817  (-1.64317  1.87941)
R^2/D10^2   : 0.354200  (-0.122763   0.185036)
(R is the radius in km and D10 is the distance to the source in units of 10 kpc)
------------------------------------------------------------
#Fit statistic : Chi-Squared =          96.55 using 59 PHA bins.
# Reduced chi-squared =          1.694 for     57 degrees of freedom
# Null hypothesis probability =   8.351462e-04

Energy  Fluence     90% Error
[keV]   [erg/cm2]   [erg/cm2]
15- 25  1.624e-08   2.930e-09
25- 50  6.366e-08   7.490e-09
50-150  9.403e-08   1.543e-08
15-150  1.739e-07   2.000e-08
Thermal bremsstrahlung (OTTB)
Spectral model: thermal bremsstrahlung
------------------------------------------------------------
Parameters  : value         Lower 90%    Upper 90%
kT [keV]    : 200.000       (      )
Norm        : 12.0916       (-1.06483     1.06478)
------------------------------------------------------------
#Fit statistic : Chi-Squared =          71.02 using 59 PHA bins.
# Reduced chi-squared =          1.246 for     57 degrees of freedom
# Null hypothesis probability =   1.002334e-01

Energy  Fluence     90% Error
[keV]   [erg/cm2]   [erg/cm2]
15- 25  3.012e-08   3.885e-09
25- 50  5.793e-08   1.011e-08
50-150  1.270e-07   6.108e-08
15-150  2.151e-07   7.321e-08
Double BB
Spectral model: bbodyrad<1> + bbodyrad<2>
------------------------------------------------------------
Parameters  : value         Lower 90%    Upper 90%
kT1 [keV]   : 8.12975        (-1.74872      2.1031)
R1^2/D10^2  : 1.97852        (-1.00123      2.29589)
kT2 [keV]   : 30.1583        (-8.05692      23.1423)
R2^2/D10^2  : 2.12212E-02    (-0.0175444   0.0273351)
------------------------------------------------------------
#Fit statistic : Chi-Squared =          66.44 using 59 PHA bins.
# Reduced chi-squared =          1.208 for     55 degrees of freedom
# Null hypothesis probability =   1.388129e-01

Energy  Fluence     90% Error
[keV]   [erg/cm2]   [erg/cm2]
15- 25  2.693e-08   9.315e-09
25- 50  6.166e-08   1.924e-08
50-150  1.312e-07   6.090e-08
15-150  2.198e-07   8.211e-08
Pre-slew spectrum (Pre-slew PHA with pre-slew DRM)
Power-law model
Spectral model in power-law:
------------------------------------------------------------
Parameters  : value       lower 90%   higher 90%
Photon index: 1.43654     ( -0.0617922   0.0616621 )
Norm@50keV  : 1.24816E-02    ( -0.000438802   0.000438799 )
------------------------------------------------------------
#Fit statistic : Chi-Squared =          50.98 using 59 PHA bins.
# Reduced chi-squared =         0.8944 for     57 degrees of freedom
# Null hypothesis probability =   6.990605e-01

Photon flux (15-150 keV)    in 21.57 sec: 1.53312 ( -0.0587209  0.0588744 ) ph/cm2/s
Energy fluence (15-150 keV)             : 2.58281e-06 ( -9.53127e-08  9.54356e-08 ) ergs/cm2
Cutoff power-law model
Spectral model in the cutoff power-law:
------------------------------------------------------------
Parameters  : value       lower 90%   higher 90%
Photon index: 0.833805     ( -0.284417   0.267309 )
Epeak [keV] : 105.946      ( -17.7135 40.5091 )
Norm@50keV  : 2.37090E-02    ( -0.00573425   0.00810523 )
------------------------------------------------------------
#Fit statistic : Chi-Squared =          35.10 using 59 PHA bins.
# Reduced chi-squared =         0.6268 for     56 degrees of freedom
# Null hypothesis probability =   9.870721e-01

Photon flux (15-150 keV)    in 21.57 sec: 1.48028 ( -0.06251  0.06279 ) ph/cm2/s
Energy fluence (15-150 keV)             : 2.49949e-06 ( -1.03687e-07  1.0304e-07 ) ergs/cm2
Band function

Spectral model in the Band function:
------------------------------------------------------------
Parameters  : value       lower 90%   higher 90%
alpha       : -0.688426   ( -0.369051   0.859931 )
beta        : -1.86383    ( 1.86467   0.275952 )
Epeak [keV] : 90.6247      ( -36.2134 45.4968 )
Norm@50keV   : 2.85114E-02    ( -0.00969136   0.068514 )
------------------------------------------------------------
#Fit statistic : Chi-Squared =          34.28 using 59 PHA bins.
# Reduced chi-squared =         0.6232 for     55 degrees of freedom
# Null hypothesis probability =   9.872264e-01

Photon flux (15-150 keV)    in 21.57 sec:  (    ) ph/cm2/s
Energy fluence (15-150 keV)             : 0 ( 0  0 ) ergs/cm2
S(25-50 keV) vs. S(50-100 keV) plot
S(25-50 keV)  = 2.49e-06
S(50-100 keV) = 2.95e-06
T90 vs. Hardness ratio plot
T90                                   = 214.191999971867 sec.
Hardness ratio (energy fluence ratio) = 1.18474
Color vs. Color plot

Count Ratio  (25-50 keV) / (15-25 keV) = 1.19235
Count Ratio (50-100 keV) / (15-25 keV) = 0.767289
Mask shadow pattern
IMX = -5.555198484791486E-01, IMY = 4.295616410294206E-01
TIME vs. PHA plot around the trigger time

TIME vs. DetID plot around the trigger time
100 us light curve (15-350 keV)

Spacecraft aspect plot

Bright source in the pre-burst/pre-slew/post-slew images
Pre-burst image of 15-350 keV band
Time interval of the image:
-214.315410 -7.088000

# RAcent  DECcent POSerr Theta    Phi  PeakCts   SNR AngSep     Name
#  [deg]    [deg]    ['] [deg]  [deg]                   [']
244.9807 -15.6473    0.5  23.8   98.0   8.1782  24.9    0.4	Sco X-1
255.8779 -37.9674   71.2  12.5   20.0   0.0350   0.2    9.0	4U 1700-377
256.4809 -36.4266    2.0  11.2   24.1   1.2946   5.9    2.2	GX 349+2
263.2147 -24.6811    7.2   5.1  124.3   0.3762   1.6   11.9	GX 1+4
264.7025 -44.4031    5.0  15.5  -16.9   0.5047   2.3    3.3	4U 1735-44
268.3806  -1.5843    4.2  27.4  162.9   0.7340   2.7    7.9	SW J1753.5-0127
270.1159 -25.0965    5.9   5.1 -160.0  -0.4681  -2.0    9.2	GX 5-1
270.2161 -25.7182    9.1   4.7 -154.3   0.3156   1.3    4.9	GRS 1758-258
273.8971 -13.8982    5.8  16.6 -175.1   0.4488   2.0   10.4	GX 17+2
275.8753 -30.2948    4.2   8.3 -100.0   0.5785   2.8    5.0	H1820-303
285.2274 -24.8144    0.0  17.3 -120.9   0.1300   0.5   12.2	HT1900.1-2455
288.7943  10.9813    2.4  45.4 -169.8   2.0498   4.8    2.2	GRS 1915+105
263.0832 -34.0315    0.0   5.8    6.8   0.1169   0.5   12.7	GX 354-0
298.2646  19.6692    3.4  57.5 -165.4   3.7802   3.4 ------	UNKNOWN
302.3554  19.4395    3.7  59.6 -161.5   5.9150   3.1 ------	UNKNOWN
303.3878  17.6056    3.9  58.7 -159.3   4.9382   3.0 ------	UNKNOWN
303.1308 -42.4534    3.0  32.4  -76.9   1.4524   3.9 ------	UNKNOWN
322.0499 -68.4583    4.0  50.8  -44.5   4.1686   2.9 ------	UNKNOWN
Pre-slew background subtracted image of 15-350 keV band
Time interval of the image:
-7.088000 14.484590

# RAcent  DECcent POSerr Theta    Phi  PeakCts   SNR AngSep     Name
#  [deg]    [deg]    ['] [deg]  [deg]                   [']
244.9387 -15.7757   14.2  23.8   97.6  -0.0781  -0.8    8.5	Sco X-1
255.9182 -37.6469   71.0  12.3   21.0   0.0113   0.2   12.3	4U 1700-377
256.4336 -36.4825    9.9  11.2   24.0   0.0810   1.2    3.6	GX 349+2
262.9217 -24.5498    0.0   5.4  122.7  -0.0380  -0.6   12.7	GX 1+4
265.0133 -44.3662    0.0  15.4  -17.8  -0.1065  -1.6   12.6	4U 1735-44
268.5150  -1.4225   15.2  27.6  163.1  -0.0617  -0.8    9.0	SW J1753.5-0127
270.3513 -25.1164    4.6   5.2 -158.0   0.1663   2.6    4.3	GX 5-1
270.4095 -25.7271    4.8   4.8 -152.7  -0.1658  -2.6    5.9	GRS 1758-258
273.8623 -14.1473   10.9  16.4 -174.9  -0.0747  -1.1   10.7	GX 17+2
275.9827 -30.3381    5.7   8.4  -99.8   0.1421   2.0    3.5	H1820-303
285.0449 -24.7728    6.2  17.1 -121.2   0.1333   1.9    8.9	HT1900.1-2455
288.9051  10.9239    6.8  45.4 -169.6   0.2122   1.7    6.4	GRS 1915+105
263.1859 -33.8322    4.3   5.6    7.1   0.1747   2.7    9.8	GX 354-0
284.9992  13.0379    2.6  45.7 -175.7   0.5477   4.4 ------	UNKNOWN
296.2788  -7.9737    0.3  35.1 -142.3   3.7914  42.5 ------	UNKNOWN
304.2812  15.4206    2.4  57.5 -156.9   1.6968   4.9 ------	UNKNOWN
304.5168 -86.5001    2.3  58.3  -24.0   2.0579   5.0 ------	UNKNOWN
Post-slew image of 15-350 keV band
Time interval of the image:
77.484600 838.757100
840.384000 899.036100
900.384000 962.445800

# RAcent  DECcent POSerr Theta    Phi  PeakCts   SNR AngSep     Name
#  [deg]    [deg]    ['] [deg]  [deg]                   [']
262.8265 -24.6603    5.2  36.0   75.5  -3.9000  -2.2   11.2	GX 1+4
264.7885 -44.5059   61.7  45.6   48.6  -0.4453  -0.2    3.9	4U 1735-44
268.2225  -1.4698    5.4  28.7  118.8   2.1188   2.1    8.8	SW J1753.5-0127
270.2505 -24.9829   31.3  30.1   69.6  -0.4157  -0.4    6.1	GX 5-1
270.3188 -25.8745    4.4  30.5   68.0   3.0580   2.6    7.9	GRS 1758-258
274.0342 -14.0842    2.6  22.7   89.5   3.5970   4.4    3.3	GX 17+2
275.9372 -30.4472    5.6  29.5   54.7   2.0067   2.1    4.9	H1820-303
284.8989 -25.0178    5.3  20.2   48.3   1.5039   2.2    9.5	HT1900.1-2455
288.8168  10.9380    0.8  20.3  175.6   9.4514  14.0    1.2	GRS 1915+105
299.5855  35.1768    3.4  43.3 -158.9   4.1291   3.4    1.5	Cyg X-1
308.0409  40.9362    3.0  50.1 -151.3   6.6494   3.9    3.3	Cyg X-3
263.1377 -33.7157    0.0  39.9   62.2   4.3197   2.0   10.3	GX 354-0
291.2825 -20.6954    2.6  13.6   37.4   2.9625   4.5 ------	UNKNOWN
303.7133 -47.1409    2.6  39.7    9.2   4.6292   4.4 ------	UNKNOWN
296.2718  -7.9372    1.2   0.0 -179.6   5.9019   9.3 ------	UNKNOWN
306.6231 -28.4970    3.9  22.7   -7.0   1.8374   3.0 ------	UNKNOWN
Plot creation:
Sat May 30 16:53:19 EDT 2015