Special notes of this burst
Image
Pre-slew 15.0-350.0 keV image (Event data)
#   RAcent    DECcent   POSerr    Theta     Phi              Peak Cts       SNR   Name
   87.5672    14.4709   0.0125    22.9651   -82.6553         0.8141038     15.334 TRIG_00556344

Foreground time interval of the image:
 -0.644  12.640 (delta_t =  13.284 [sec])
Background time interval of the image:
-210.659  -0.644 (delta_t = 210.015 [sec])
Lightcurves
Notes:
- 1) The mask-weighted light curves are using the flight position.
- 2) Multiple plots of different time binning/intervals are shown to cover all scenarios of short/long GRBs, rate/image triggers, and real/false positives.
- 3) For all the mask-weighted lightcurves, the y-axis units are counts/sec/det where a det is 0.4 x 0.4 = 0.16 sq cm.
- 4) The verticle lines correspond to following: green dotted lines are T50 interval, black dotted lines are T90 interval, blue solid line(s) is a spacecraft slew start time, and orange solid line(s) is a spacecraft slew end time.
- 5) Time of each bin is in the middle of the bin.
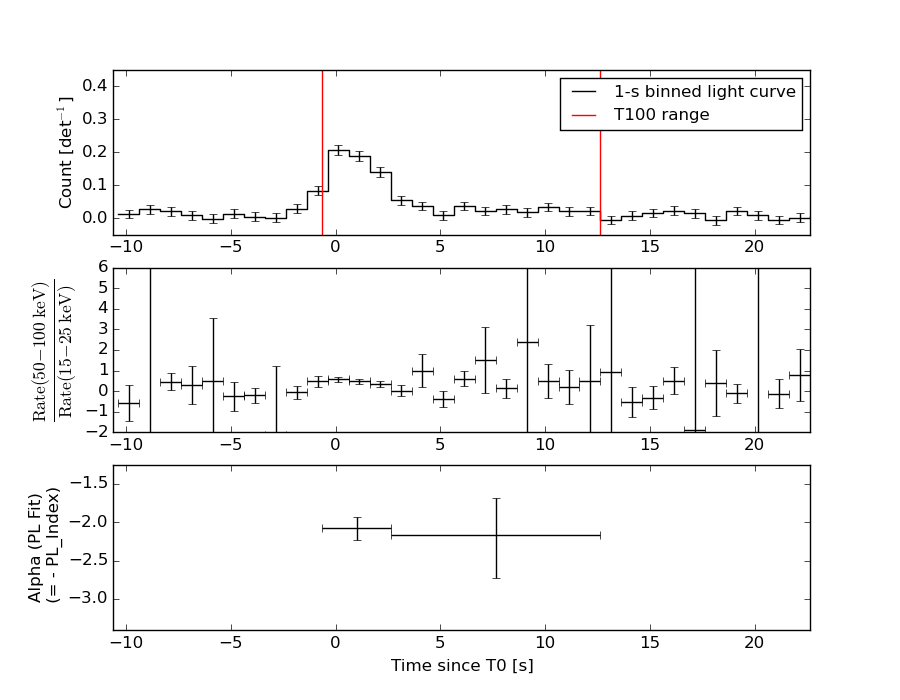
1 s binning
From T0-310 s to T0+310 s
From T100_start - 20 s to T100_end + 30 s
Full time interval
64 ms binning
Full time interval
From T100_start to T100_end
From T0-5 sec to T0+5 sec
16 ms binning
From T100_start-5 s to T100_start+5 s
8 ms binning
From T100_start-3 s to T100_start+3 s
2 ms binning
From T100_start-1 s to T100_start+1 s
SN=5 or 10 sec. binning (whichever binning is satisfied first)
SN=5 or 10 sec. binning (T < 200 sec)
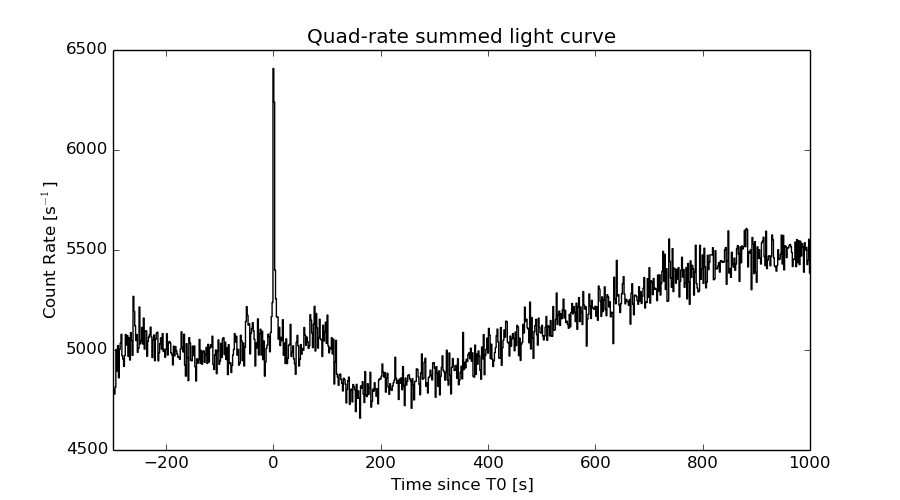
Quad-rate summed light curves (from T0-300s to T0+1000s)
Spectral Evolution
Spectra
Notes:
- 1) The fitting includes the systematic errors.
- 2) When the burst includes telescope slew time periods, the fitting uses an average response file made from multiple 5-s response files through out the slew time plus single time preiod for the non-slew times, and weighted by the total counts in the corresponding time period using addrmf. An average response file is needed becuase a spectral fit using the pre-slew DRM will introduce some errors in both a spectral shape and a normalization if the PHA file contains a lot of the slew/post-slew time interval.
- 3) For fits to more complicated models (e.g. a power-law over a cutoff power-law), the BAT team has decided to require a chi-square improvement of more than 6 for each extra dof.
Time averaged spectrum fit using the average DRM
Power-law model
Time interval is from   -0.644 sec. to   12.640 sec.

Spectral model in power-law:
------------------------------------------------------------
Parameters  : value       lower 90%   higher 90%
Photon index: 2.08788     ( -0.187755   0.198462 )
Norm@50keV  : 3.44525E-03    ( -0.000457922   0.000447201 )
------------------------------------------------------------
#Fit statistic : Chi-Squared =          50.70 using 59 PHA bins.
# Reduced chi-squared =         0.8895 for     57 degrees of freedom
# Null hypothesis probability =   7.089609e-01

Photon flux (15-150 keV)    in 13.28 sec: 0.538807 ( -0.0527837  0.0527904 ) ph/cm2/s
Energy fluence (15-150 keV)             : 4.24608e-07 ( -5.04926e-08  5.15743e-08 ) ergs/cm2
Cutoff power-law model

Time interval is from   -0.644 sec. to   12.640 sec.
Spectral model in the cutoff power-law:
------------------------------------------------------------
Parameters  : value       lower 90%   higher 90%
Photon index: 1.86176     ( -0.769822   0.216088 )
Epeak [keV] : 24.9548      (   )
Norm@50keV  : 4.68167E-03    (     )
------------------------------------------------------------
#Fit statistic : Chi-Squared =          50.37 using 59 PHA bins.
# Reduced chi-squared =         0.8994 for     56 degrees of freedom
# Null hypothesis probability =   6.871255e-01

Photon flux (15-150 keV)    in 13.28 sec: 0.534263 ( -0.053255  0.053773 ) ph/cm2/s
Energy fluence (15-150 keV)             : 4.14381e-07 ( -5.78118e-08  5.83112e-08 ) ergs/cm2
Band function

Time interval is from   -0.644 sec. to   12.640 sec.

Spectral model in the Band function:
------------------------------------------------------------
Parameters  : value       lower 90%   higher 90%
alpha       : -1.98309   ( -4.35593   1.98321 )
beta        : -9.37167    ( 9.3716   19.3716 )
Epeak [keV] : 6.30936      ( -4.50017 -6.30545 )
Norm@50keV   : 3.98852E-03    ( -0.000687131   0.000479931 )
------------------------------------------------------------
#Fit statistic : Chi-Squared =          50.45 using 59 PHA bins.
# Reduced chi-squared =         0.9173 for     55 degrees of freedom
# Null hypothesis probability =   6.487859e-01

Photon flux (15-150 keV)    in 13.28 sec: 0.534263 (    ) ph/cm2/s
Energy fluence (15-150 keV)             : 4.17843e-07 ( 0  0 ) ergs/cm2
Single BB
Spectral model blackbody:
------------------------------------------------------------
Parameters  : value    Lower 90%  Upper 90%
kT [keV]    : 9.00935  (-1.14754  1.31785)
R^2/D10^2   : 0.361714  (-0.148737   0.256032)
(R is the radius in km and D10 is the distance to the source in units of 10 kpc)
------------------------------------------------------------
#Fit statistic : Chi-Squared =          78.33 using 59 PHA bins.
# Reduced chi-squared =          1.374 for     57 degrees of freedom
# Null hypothesis probability =   3.195151e-02

Energy  Fluence     90% Error
[keV]   [erg/cm2]   [erg/cm2]
15- 25  7.595e-08   1.404e-08
25- 50  1.617e-07   2.219e-08
50-150  6.188e-08   1.878e-08
15-150  2.995e-07   3.785e-08
Thermal bremsstrahlung (OTTB)
Spectral model: thermal bremsstrahlung
------------------------------------------------------------
Parameters  : value         Lower 90%    Upper 90%
kT [keV]    : 57.8890       (-15.2092      23.6814)
Norm        : 2.85279       (-0.468328     0.558602)
------------------------------------------------------------
#Fit statistic : Chi-Squared =          51.79 using 59 PHA bins.
# Reduced chi-squared =         0.9085 for     57 degrees of freedom
# Null hypothesis probability =   6.704600e-01

Energy  Fluence     90% Error
[keV]   [erg/cm2]   [erg/cm2]
15- 25  9.464e-08   1.176e-08
25- 50  1.424e-07   1.546e-08
50-150  1.573e-07   4.510e-08
15-150  3.943e-07   5.544e-08
Double BB
Spectral model: bbodyrad<1> + bbodyrad<2>
------------------------------------------------------------
Parameters  : value         Lower 90%    Upper 90%
kT1 [keV]   : 5.02382        (-1.13177      1.34884)
R1^2/D10^2  : 2.71104        (-1.61865      5.11318)
kT2 [keV]   : 18.5639        (-4.61226      8.3503)
R2^2/D10^2  : 1.60612E-02    (-0.0121997   0.0206488)
------------------------------------------------------------
#Fit statistic : Chi-Squared =          49.26 using 59 PHA bins.
# Reduced chi-squared =         0.8956 for     55 degrees of freedom
# Null hypothesis probability =   6.928103e-01

Energy  Fluence     90% Error
[keV]   [erg/cm2]   [erg/cm2]
15- 25  1.038e-07   4.485e-08
25- 50  1.279e-07   4.265e-08
50-150  1.761e-07   9.777e-08
15-150  4.078e-07   1.440e-07
Peak spectrum fit
Power-law model
Time interval is from   -0.136 sec. to    0.864 sec.

Spectral model in power-law:
------------------------------------------------------------
Parameters  : value       lower 90%   higher 90%
Photon index: 2.15322     ( -0.210152   0.228189 )
Norm@50keV  : 1.19360E-02    ( -0.00189673   0.00184138 )
------------------------------------------------------------
#Fit statistic : Chi-Squared =          48.66 using 59 PHA bins.
# Reduced chi-squared =         0.8537 for     57 degrees of freedom
# Null hypothesis probability =   7.762194e-01

Photon flux (15-150 keV)    in 1 sec: 1.92872 ( -0.221082  0.221092 ) ph/cm2/s
Energy fluence (15-150 keV)             : 1.11541e-07 ( -1.54492e-08  1.57531e-08 ) ergs/cm2
Cutoff power-law model

Time interval is from   -0.136 sec. to    0.864 sec.
Spectral model in the cutoff power-law:
------------------------------------------------------------
Parameters  : value       lower 90%   higher 90%
Photon index: 1.63598     ( -0.990141   0.621463 )
Epeak [keV] : 29.0944      ( -25.2868 -29.0943 )
Norm@50keV  : 2.40157E-02    (     )
------------------------------------------------------------
#Fit statistic : Chi-Squared =          47.52 using 59 PHA bins.
# Reduced chi-squared =         0.8486 for     56 degrees of freedom
# Null hypothesis probability =   7.828199e-01

Photon flux (15-150 keV)    in 1 sec: 1.90520 ( -0.22405  0.22402 ) ph/cm2/s
Energy fluence (15-150 keV)             : 1.07204e-07 ( -1.64725e-08  1.7128e-08 ) ergs/cm2
Band function
Time interval is from   -0.136 sec. to    0.864 sec.

Spectral model in the Band function:
------------------------------------------------------------
Parameters  : value       lower 90%   higher 90%
alpha       : -1.63605   ( -4.05779   1.97814 )
beta        : -10.0000    ( 10   0 )
Epeak [keV] : 29.0874      ( -10.8552 106.044 )
Norm@50keV   : 2.40084E-02    ( -0.0115309   0.0678698 )
------------------------------------------------------------
#Fit statistic : Chi-Squared =          47.52 using 59 PHA bins.
# Reduced chi-squared =         0.8640 for     55 degrees of freedom
# Null hypothesis probability =   7.529782e-01

Photon flux (15-150 keV)    in 1 sec: 1.91040 (    ) ph/cm2/s
Energy fluence (15-150 keV)             : 1.07321e-07 ( 0  0 ) ergs/cm2
Single BB
Spectral model blackbody:
------------------------------------------------------------
Parameters  : value    Lower 90%  Upper 90%
kT [keV]    : 9.27493  (-1.29653  1.45199)
R^2/D10^2   : 1.19215  (-0.511892   0.94202)
(R is the radius in km and D10 is the distance to the source in units of 10 kpc)
------------------------------------------------------------
#Fit statistic : Chi-Squared =          65.20 using 59 PHA bins.
# Reduced chi-squared =          1.144 for     57 degrees of freedom
# Null hypothesis probability =   2.130501e-01

Energy  Fluence     90% Error
[keV]   [erg/cm2]   [erg/cm2]
15- 25  2.026e-08   3.980e-09
25- 50  4.512e-08   7.330e-09
50-150  1.886e-08   5.995e-09
15-150  8.424e-08   1.299e-08
Thermal bremsstrahlung (OTTB)
Spectral model: thermal bremsstrahlung
------------------------------------------------------------
Parameters  : value         Lower 90%    Upper 90%
kT [keV]    : 53.2779       (-14.4644      22.9275)
Norm        : 10.6446       (-1.89853     2.48957)
------------------------------------------------------------
#Fit statistic : Chi-Squared =          47.86 using 59 PHA bins.
# Reduced chi-squared =         0.8397 for     57 degrees of freedom
# Null hypothesis probability =   8.003880e-01

Energy  Fluence     90% Error
[keV]   [erg/cm2]   [erg/cm2]
15- 25  2.639e-08   4.125e-09
25- 50  3.874e-08   5.210e-09
50-150  3.989e-08   1.170e-08
15-150  1.050e-07   1.708e-08
Double BB
Spectral model: bbodyrad<1> + bbodyrad<2>
------------------------------------------------------------
Parameters  : value         Lower 90%    Upper 90%
kT1 [keV]   : 4.21872        (-1.35667      1.83605)
R1^2/D10^2  : 17.8709        (-13.0537      95.8191)
kT2 [keV]   : 14.5405        (-3.21709      6.07983)
R2^2/D10^2  : 0.158408    (-0.124155   0.305483)
------------------------------------------------------------
#Fit statistic : Chi-Squared =          47.24 using 59 PHA bins.
# Reduced chi-squared =         0.8590 for     55 degrees of freedom
# Null hypothesis probability =   7.621053e-01

Energy  Fluence     90% Error
[keV]   [erg/cm2]   [erg/cm2]
15- 25  2.796e-08   1.471e-08
25- 50  3.595e-08   1.731e-08
50-150  3.871e-08   2.325e-08
15-150  1.026e-07   4.140e-08
Pre-slew spectrum (Pre-slew PHA with pre-slew DRM)
Power-law model
Spectral model in power-law:
------------------------------------------------------------
Parameters  : value       lower 90%   higher 90%
Photon index: 2.08788     ( -0.187755   0.198462 )
Norm@50keV  : 3.44525E-03    ( -0.000457922   0.000447201 )
------------------------------------------------------------
#Fit statistic : Chi-Squared =          50.70 using 59 PHA bins.
# Reduced chi-squared =         0.8895 for     57 degrees of freedom
# Null hypothesis probability =   7.089609e-01

Photon flux (15-150 keV)    in 13.28 sec: 0.538807 ( -0.0527837  0.0527904 ) ph/cm2/s
Energy fluence (15-150 keV)             : 4.24608e-07 ( -5.04926e-08  5.15743e-08 ) ergs/cm2
Cutoff power-law model
Spectral model in the cutoff power-law:
------------------------------------------------------------
Parameters  : value       lower 90%   higher 90%
Photon index: 1.86176     ( -0.769822   0.216088 )
Epeak [keV] : 24.9548      (   )
Norm@50keV  : 4.68167E-03    (     )
------------------------------------------------------------
#Fit statistic : Chi-Squared =          50.37 using 59 PHA bins.
# Reduced chi-squared =         0.8994 for     56 degrees of freedom
# Null hypothesis probability =   6.871255e-01

Photon flux (15-150 keV)    in 13.28 sec: 0.534263 ( -0.053255  0.053773 ) ph/cm2/s
Energy fluence (15-150 keV)             : 4.14381e-07 ( -5.78118e-08  5.83112e-08 ) ergs/cm2
Band function

Spectral model in the Band function:
------------------------------------------------------------
Parameters  : value       lower 90%   higher 90%
alpha       : -1.98309   ( -4.35593   1.98321 )
beta        : -9.37167    ( 9.3716   19.3716 )
Epeak [keV] : 6.30936      ( -4.50017 -6.30545 )
Norm@50keV   : 3.98852E-03    ( -0.000687131   0.000479931 )
------------------------------------------------------------
#Fit statistic : Chi-Squared =          50.45 using 59 PHA bins.
# Reduced chi-squared =         0.9173 for     55 degrees of freedom
# Null hypothesis probability =   6.487859e-01

Photon flux (15-150 keV)    in 13.28 sec: 0.534263 (    ) ph/cm2/s
Energy fluence (15-150 keV)             : 4.17843e-07 ( 0  0 ) ergs/cm2
S(25-50 keV) vs. S(50-100 keV) plot
S(25-50 keV)  = 1.31e-07
S(50-100 keV) = 1.23e-07
T90 vs. Hardness ratio plot
T90                                   = 10.9559999704361 sec.
Hardness ratio (energy fluence ratio) = 0.938931
Color vs. Color plot
Count Ratio  (25-50 keV) / (15-25 keV) = 0.919444
Count Ratio (50-100 keV) / (15-25 keV) = 0.448793
Mask shadow pattern
IMX = 5.417203364954370E-02, IMY = 4.202798181786878E-01
TIME vs. PHA plot around the trigger time
TIME vs. DetID plot around the trigger time
100 us light curve (15-350 keV)
Spacecraft aspect plot
Bright source in the pre-burst/pre-slew/post-slew images
Pre-burst image of 15-350 keV band
Time interval of the image:
-210.659410 -0.644000

# RAcent  DECcent POSerr Theta    Phi  PeakCts   SNR AngSep     Name
#  [deg]    [deg]    ['] [deg]  [deg]                   [']
 83.6366  22.0178    0.4  31.0  -77.3   8.5240  28.9    0.3	Crab
126.4361 -25.7633    2.9  32.3   99.5   1.4378   4.0 ------	UNKNOWN
 80.2897 -49.3385    2.7  51.2  159.7   4.0091   4.3 ------	UNKNOWN
128.0260  49.1245    3.0  55.5  -20.3   2.4155   3.9 ------	UNKNOWN
111.5837  53.0211    2.3  55.6  -33.7   5.6750   4.9 ------	UNKNOWN
 55.9775  -0.9222    2.3  47.6 -128.8   4.2925   4.9 ------	UNKNOWN
Pre-slew background subtracted image of 15-350 keV band
Time interval of the image:
-0.644000 12.640000

# RAcent  DECcent POSerr Theta    Phi  PeakCts   SNR AngSep     Name
#  [deg]    [deg]    ['] [deg]  [deg]                   [']
 83.5246  21.9261    3.8  31.0  -77.6   0.2038   3.0    8.0	Crab
137.2958 -12.4180    2.6  35.0   69.2   0.3945   4.4 ------	UNKNOWN
149.7731  10.5896    2.5  47.7   34.0   0.6301   4.7 ------	UNKNOWN
 99.5743 -43.9954    2.7  42.0  144.7   0.4354   4.4 ------	UNKNOWN
 87.5671  14.4708    0.7  23.0  -82.7   0.8138  15.3 ------	UNKNOWN
Post-slew image of 15-350 keV band
Time interval of the image:
153.740600 334.540600

# RAcent  DECcent POSerr Theta    Phi  PeakCts   SNR AngSep     Name
#  [deg]    [deg]    ['] [deg]  [deg]                   [']
 16.7415  55.4782    2.6  50.7  -44.5   3.8282   4.4 ------	UNKNOWN
Plot creation:
Sat May 30 16:49:45 EDT 2015