Click here for the BAT GCN circular template
Image
Pre-slew 15.0-350.0 keV image (Event data)

#   RAcent    DECcent   POSerr    Theta     Phi              Peak Cts       SNR   Name
   24.3082   -64.1305   0.0118     9.4972  -126.9359         1.1279834     16.260 TRIG_00556930

Foreground time interval of the image:
 36.128  72.501 (delta_t =  36.373 [sec])
Background time interval of the image:
-465.699 -449.564 (delta_t =  16.135 [sec])
-239.000  36.128 (delta_t = 275.128 [sec])
Lightcurves
Notes:
- 1) The mask-weighted light curves are using the flight position.
- 2) Multiple plots of different time binning/intervals are shown to cover all scenarios of short/long GRBs, rate/image triggers, and real/false positives.
- 3) For all the mask-weighted lightcurves, the y-axis units are counts/sec/det where a det is 0.4 x 0.4 = 0.16 sq cm.
- 4) The verticle lines correspond to following: green dotted lines are T50 interval, black dotted lines are T90 interval, blue solid line(s) is a spacecraft slew start time, and orange solid line(s) is a spacecraft slew end time.
- 5) Time of each bin is in the middle of the bin.
1 s binning
From T0-310 s to T0+310 s

From T100_start - 20 s to T100_end + 30 s

Full time interval

64 ms binning
Full time interval

From T100_start to T100_end
From T0-5 sec to T0+5 sec

16 ms binning
From T100_start-5 s to T100_start+5 s

Blue+Cyan dotted lines: Time interval of the scaled map
From 0.000000 to 64.000000
8 ms binning
From T100_start-3 s to T100_start+3 s

Blue+Cyan dotted lines: Time interval of the scaled map
From 0.000000 to 64.000000
2 ms binning
From T100_start-1 s to T100_start+1 s

Blue+Cyan dotted lines: Time interval of the scaled map
From 0.000000 to 64.000000
SN=5 or 10 sec. binning (whichever binning is satisfied first)

SN=5 or 10 sec. binning (T < 200 sec)

Quad-rate summed light curves (from T0-300s to T0+1000s)
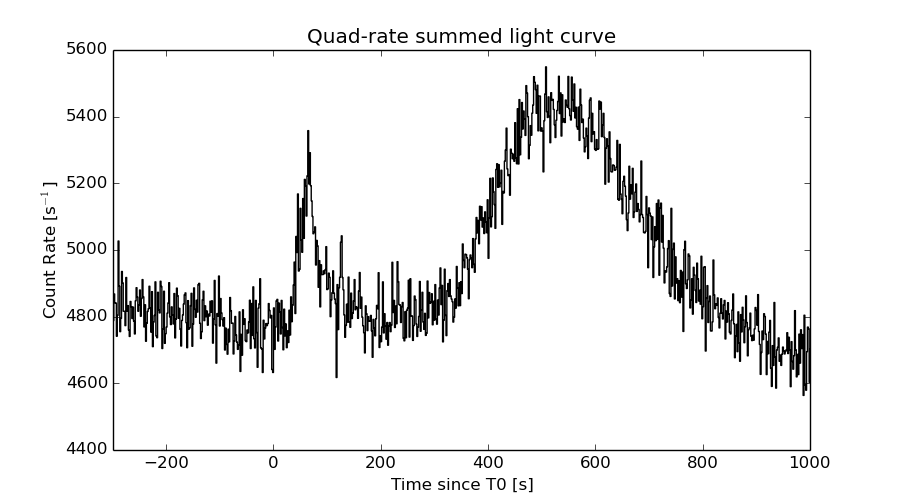
The mask-weighted light curves based on cleaned DPHs

Spectral Evolution

Spectra
Notes:
- 1) The fitting includes the systematic errors.
- 2) When the burst includes telescope slew time periods, the fitting uses an average response file made from multiple 5-s response files through out the slew time plus single time preiod for the non-slew times, and weighted by the total counts in the corresponding time period using addrmf. An average response file is needed becuase a spectral fit using the pre-slew DRM will introduce some errors in both a spectral shape and a normalization if the PHA file contains a lot of the slew/post-slew time interval.
- 3) For fits to more complicated models (e.g. a power-law over a cutoff power-law), the BAT team has decided to require a chi-square improvement of more than 6 for each extra dof.
Time averaged spectrum fit using the average DRM
Power-law model

Time interval is from   36.128 sec. to  146.460 sec.

Spectral model in power-law:
------------------------------------------------------------
Parameters  : value       lower 90%   higher 90%
Photon index: 1.60872     ( -0.144099   0.146453 )
Norm@50keV  : 1.22007E-03    ( -0.000109576   0.00010837 )
------------------------------------------------------------
#Fit statistic : Chi-Squared =          58.06 using 59 PHA bins.
# Reduced chi-squared =          1.019 for     57 degrees of freedom
# Null hypothesis probability =   4.360963e-01

Photon flux (15-150 keV)    in 110.3 sec: 0.157212 ( -0.0128307  0.0128342 ) ph/cm2/s
Energy fluence (15-150 keV)             : 1.25722e-06 ( -1.21754e-07  1.23564e-07 ) ergs/cm2
Cutoff power-law model

Time interval is from   36.128 sec. to  146.460 sec.
Spectral model in the cutoff power-law:
------------------------------------------------------------
Parameters  : value       lower 90%   higher 90%
Photon index: 1.20465     ( -0.615032   0.483609 )
Epeak [keV] : 88.9311      ( -30.8336 -88.9311 )
Norm@50keV  : 2.03219E-03    ( -0.000879437   0.00231839 )
------------------------------------------------------------
#Fit statistic : Chi-Squared =          56.45 using 59 PHA bins.
# Reduced chi-squared =          1.008 for     56 degrees of freedom
# Null hypothesis probability =   4.580259e-01

Photon flux (15-150 keV)    in 110.3 sec: 0.154444 ( -0.013349  0.006698 ) ph/cm2/s
Energy fluence (15-150 keV)             : 1.20272e-06 ( -1.40655e-07  1.42993e-07 ) ergs/cm2
Band function

Time interval is from   36.128 sec. to  146.460 sec.

Spectral model in the Band function:
------------------------------------------------------------
Parameters  : value       lower 90%   higher 90%
alpha       : 4.98781   ( -5.22718   -4.98781 )
beta        : -1.77384    ( -0.219428   0.179907 )
Epeak [keV] : 25.1965      ( -4.4643 3.29836 )
Norm@50keV   : 137.789    ( -11.1094   337.989 )
------------------------------------------------------------
#Fit statistic : Chi-Squared =          52.14 using 59 PHA bins.
# Reduced chi-squared =         0.9480 for     55 degrees of freedom
# Null hypothesis probability =   5.845266e-01

Photon flux (15-150 keV)    in 110.3 sec:  (    ) ph/cm2/s
Energy fluence (15-150 keV)             : 1.21974e-06 ( -1.21897e-06  -1.2447e-07 ) ergs/cm2
Single BB

Spectral model blackbody:
------------------------------------------------------------
Parameters  : value    Lower 90%  Upper 90%
kT [keV]    : 12.7409  (-1.37283  1.55398)
R^2/D10^2   : 3.07839E-02  (-0.01037   0.0156252)
(R is the radius in km and D10 is the distance to the source in units of 10 kpc)
------------------------------------------------------------
#Fit statistic : Chi-Squared =          89.73 using 59 PHA bins.
# Reduced chi-squared =          1.574 for     57 degrees of freedom
# Null hypothesis probability =   3.676324e-03

Energy  Fluence     90% Error
[keV]   [erg/cm2]   [erg/cm2]
15- 25  1.169e-07   1.738e-08
25- 50  3.939e-07   3.960e-08
50-150  3.994e-07   7.550e-08
15-150  9.102e-07   9.817e-08
Thermal bremsstrahlung (OTTB)

Spectral model: thermal bremsstrahlung
------------------------------------------------------------
Parameters  : value         Lower 90%    Upper 90%
kT [keV]    : 161.608       (-56.5768      -160.554)
Norm        : 0.646718       (-0.0557134     0.0689689)
------------------------------------------------------------
#Fit statistic : Chi-Squared =          56.45 using 59 PHA bins.
# Reduced chi-squared =         0.9903 for     57 degrees of freedom
# Null hypothesis probability =   4.957812e-01

Energy  Fluence     90% Error
[keV]   [erg/cm2]   [erg/cm2]
15- 25  1.820e-07   3.243e-08
25- 50  3.409e-07   1.046e-07
50-150  6.932e-07   3.821e-07
15-150  1.216e-06   4.848e-07
Double BB

Spectral model: bbodyrad<1> + bbodyrad<2>
------------------------------------------------------------
Parameters  : value         Lower 90%    Upper 90%
kT1 [keV]   : 6.12977        (-1.20424      1.49046)
R1^2/D10^2  : 0.277521        (-0.144444      0.334251)
kT2 [keV]   : 22.5623        (-4.45488      7.99391)
R2^2/D10^2  : 3.12817E-03    (-0.00206727   0.0040104)
------------------------------------------------------------
#Fit statistic : Chi-Squared =          52.94 using 59 PHA bins.
# Reduced chi-squared =         0.9625 for     55 degrees of freedom
# Null hypothesis probability =   5.537330e-01

Energy  Fluence     90% Error
[keV]   [erg/cm2]   [erg/cm2]
15- 25  1.896e-07   8.453e-08
25- 50  3.369e-07   1.067e-07
50-150  6.722e-07   3.145e-07
15-150  1.199e-06   4.285e-07
Peak spectrum fit
Power-law model

Time interval is from   59.132 sec. to   60.132 sec.

Spectral model in power-law:
------------------------------------------------------------
Parameters  : value       lower 90%   higher 90%
Photon index: 1.59196     ( -0.463889   0.503924 )
Norm@50keV  : 3.75045E-03    ( -0.00116906   0.00112704 )
------------------------------------------------------------
#Fit statistic : Chi-Squared =          56.61 using 59 PHA bins.
# Reduced chi-squared =         0.9932 for     57 degrees of freedom
# Null hypothesis probability =   4.896599e-01

Photon flux (15-150 keV)    in 1 sec: 0.480759 ( -0.132487  0.132522 ) ph/cm2/s
Energy fluence (15-150 keV)             : 3.51089e-08 ( -1.13761e-08  1.19277e-08 ) ergs/cm2
Cutoff power-law model

Time interval is from   59.132 sec. to   60.132 sec.
Spectral model in the cutoff power-law:
------------------------------------------------------------
Parameters  : value       lower 90%   higher 90%
Photon index: -0.187670     ( -5.09576   2.39503 )
Epeak [keV] : 55.6365      (   )
Norm@50keV  : 3.42784E-02    (     )
------------------------------------------------------------
#Fit statistic : Chi-Squared =          55.31 using 59 PHA bins.
# Reduced chi-squared =         0.9877 for     56 degrees of freedom
# Null hypothesis probability =   5.008473e-01

Photon flux (15-150 keV)    in 1 sec: 0.450151 ( -0.142829  0.141034 ) ph/cm2/s
Energy fluence (15-150 keV)             : 3.03448e-08 ( -1.04098e-08  1.36877e-08 ) ergs/cm2
Band function

Time interval is from   59.132 sec. to   60.132 sec.

Spectral model in the Band function:
------------------------------------------------------------
Parameters  : value       lower 90%   higher 90%
alpha       : 0.173578   ( -0.758028   -0.758028 )
beta        : -3.29764    ( 3.36086   5.27413 )
Epeak [keV] : 55.9705      ( -54.4763 44.8811 )
Norm@50keV   : 3.34185E-02    ( -0.0196729   102.605 )
------------------------------------------------------------
#Fit statistic : Chi-Squared =          55.23 using 59 PHA bins.
# Reduced chi-squared =          1.004 for     55 degrees of freedom
# Null hypothesis probability =   4.659559e-01

Photon flux (15-150 keV)    in 1 sec:  (    ) ph/cm2/s
Energy fluence (15-150 keV)             : 0 ( 0  0 ) ergs/cm2
Single BB

Spectral model blackbody:
------------------------------------------------------------
Parameters  : value    Lower 90%  Upper 90%
kT [keV]    : 13.2234  (-3.16062  4.39054)
R^2/D10^2   : 8.92554E-02  (-0.0577685   0.145491)
(R is the radius in km and D10 is the distance to the source in units of 10 kpc)
------------------------------------------------------------
#Fit statistic : Chi-Squared =          55.55 using 59 PHA bins.
# Reduced chi-squared =         0.9745 for     57 degrees of freedom
# Null hypothesis probability =   5.297799e-01

Energy  Fluence     90% Error
[keV]   [erg/cm2]   [erg/cm2]
15- 25  3.309e-09   2.011e-09
25- 50  1.161e-08   5.713e-09
50-150  1.296e-08   9.225e-09
15-150  2.787e-08   1.481e-08
Thermal bremsstrahlung (OTTB)

Spectral model: thermal bremsstrahlung
------------------------------------------------------------
Parameters  : value         Lower 90%    Upper 90%
kT [keV]    : 172.134       (-116.115      -169.175)
Norm        : 1.98387       (-0.55127     0.832439)
------------------------------------------------------------
#Fit statistic : Chi-Squared =          56.12 using 59 PHA bins.
# Reduced chi-squared =         0.9846 for     57 degrees of freedom
# Null hypothesis probability =   5.079352e-01

Energy  Fluence     90% Error
[keV]   [erg/cm2]   [erg/cm2]
15- 25  5.028e-09   2.995e-09
25- 50  9.498e-09   5.660e-09
50-150  1.979e-08   1.195e-08
15-150  3.431e-08   2.107e-08
Double BB

R1^2/D10^2  : 2.97376E+04        (      )
kT2 [keV]   : 13.9824        (-3.55977      5.05868)
R2^2/D10^2  : 7.06117E-02    (   )
------------------------------------------------------------
#Fit statistic : Chi-Squared =          53.96 using 59 PHA bins.
#Fit statistic : Chi-Squared =          53.78 using 59 PHA bins.
#Fit statistic : Chi-Squared =          53.74 using 59 PHA bins.
# Reduced chi-squared =         0.9810 for     55 degrees of freedom
# Reduced chi-squared =         0.9778 for     55 degrees of freedom
# Reduced chi-squared =         0.9771 for     55 degrees of freedom
# Null hypothesis probability =   5.145519e-01
# Null hypothesis probability =   5.212583e-01
# Null hypothesis probability =   5.228612e-01

Energy  Fluence     90% Error
[keV]   [erg/cm2]   [erg/cm2]
15- 25  4.170e-09   1.837e-09
25- 50  1.063e-08   6.370e-09
50-150  1.419e-08   9.280e-09
15-150  2.899e-08   1.669e-08
Pre-slew spectrum (Pre-slew PHA with pre-slew DRM)
Power-law model

Spectral model in power-law:
------------------------------------------------------------
Parameters  : value       lower 90%   higher 90%
Photon index: 1.49593     ( -0.168062   0.170197 )
Norm@50keV  : 1.81212E-03    ( -0.000187257   0.000185588 )
------------------------------------------------------------
#Fit statistic : Chi-Squared =          43.22 using 59 PHA bins.
# Reduced chi-squared =         0.7582 for     57 degrees of freedom
# Null hypothesis probability =   9.112703e-01

Photon flux (15-150 keV)    in 36.37 sec: 0.225977 ( -0.0220257  0.0220345 ) ph/cm2/s
Energy fluence (15-150 keV)             : 6.2564e-07 ( -7.14303e-08  7.25454e-08 ) ergs/cm2
Cutoff power-law model

Spectral model in the cutoff power-law:
------------------------------------------------------------
Parameters  : value       lower 90%   higher 90%
Photon index: 0.848020     ( -0.852079   0.698653 )
Epeak [keV] : 82.1311      ( -24.7903 -82.1311 )
Norm@50keV  : 4.04454E-03    ( -0.00228895   0.00744534 )
------------------------------------------------------------
#Fit statistic : Chi-Squared =          40.79 using 59 PHA bins.
# Reduced chi-squared =         0.7284 for     56 degrees of freedom
# Null hypothesis probability =   9.367795e-01

Photon flux (15-150 keV)    in 36.37 sec: 0.219764 ( -0.023153  0.023036 ) ph/cm2/s
Energy fluence (15-150 keV)             : 5.84768e-07 ( -8.30109e-08  8.5084e-08 ) ergs/cm2
Band function

Spectral model in the Band function:
------------------------------------------------------------
Parameters  : value       lower 90%   higher 90%
alpha       : 4.70068   ( -12.4518   -4.70068 )
beta        : -1.66241    ( -0.229068   0.210462 )
Epeak [keV] : 27.0812      ( -5.4131 4.97136 )
Norm@50keV   : 74.3856    ( -7.16556   838.749 )
------------------------------------------------------------
#Fit statistic : Chi-Squared =          39.74 using 59 PHA bins.
# Reduced chi-squared =         0.7226 for     55 degrees of freedom
# Null hypothesis probability =   9.395451e-01

Photon flux (15-150 keV)    in 36.37 sec:  (    ) ph/cm2/s
Energy fluence (15-150 keV)             : 5.91634e-07 ( 0  0 ) ergs/cm2
S(25-50 keV) vs. S(50-100 keV) plot

S(25-50 keV)  = 3.27e-07
S(50-100 keV) = 4.29e-07
T90 vs. Hardness ratio plot
T90                                   = 87.5919999480247 sec.
Hardness ratio (energy fluence ratio) = 1.31193
Color vs. Color plot
Count Ratio  (25-50 keV) / (15-25 keV) = 1.21489
Count Ratio (50-100 keV) / (15-25 keV) = 0.853815
Mask shadow pattern

IMX = -1.005298123265684E-01, IMY = 1.337184207226820E-01
TIME vs. PHA plot around the trigger time

Blue+Cyan dotted lines: Time interval of the scaled map
From 0.000000 to 64.000000
TIME vs. DetID plot around the trigger time
Blue+Cyan dotted lines: Time interval of the scaled map
From 0.000000 to 64.000000
100 us light curve (15-350 keV)
Blue+Cyan dotted lines: Time interval of the scaled map
From 0.000000 to 64.000000
Spacecraft aspect plot
Bright source in the pre-burst/pre-slew/post-slew images
Pre-burst image of 15-350 keV band
Time interval of the image:
-465.699400 -449.564300
-239.000000 36.128000

# RAcent  DECcent POSerr Theta    Phi  PeakCts   SNR AngSep     Name
#  [deg]    [deg]    ['] [deg]  [deg]                   [']
135.5134 -40.6786   11.8  57.4   -8.9   1.3195   1.0    7.5	Vela X-1
169.9734 -60.5052   36.3  44.2   24.8   0.1617   0.3   12.3	Cen X-3
186.7563 -62.7379  216.9  43.3   36.6   0.0311   0.1    3.4	GX 301-2
296.2606 -49.5125    2.2  42.0  122.2   4.9608   5.2 ------	UNKNOWN
152.4087 -54.4010    3.1  47.7    9.9   1.8592   3.7 ------	UNKNOWN
151.9749 -48.5695    2.3  53.2    7.5   4.5405   5.1 ------	UNKNOWN
358.9529 -16.2769    4.8  58.8 -159.3   4.0432   2.4 ------	UNKNOWN
 97.7328 -37.0831    5.5  50.7  -44.6   2.8720   2.1 ------	UNKNOWN
Pre-slew background subtracted image of 15-350 keV band
Time interval of the image:
36.128000 72.500600

# RAcent  DECcent POSerr Theta    Phi  PeakCts   SNR AngSep     Name
#  [deg]    [deg]    ['] [deg]  [deg]                   [']
135.3516 -40.6039    5.0  57.4   -9.1   0.8460   2.3    8.6	Vela X-1
170.2517 -60.7239   18.0  44.0   25.0   0.1056   0.6    6.3	Cen X-3
186.8659 -62.6897   14.5  43.4   36.7   0.1625   0.8    7.5	GX 301-2
134.8614 -52.0192    2.6  46.5   -4.7   0.5689   4.5 ------	UNKNOWN
 24.3082 -64.1305    0.7   9.5 -126.9   1.1281  16.3 ------	UNKNOWN
104.2562 -38.9233    1.9  50.8  -37.5   1.4366   5.9 ------	UNKNOWN
Post-slew image of 15-350 keV band
Time interval of the image:
101.500600 963.057000

# RAcent  DECcent POSerr Theta    Phi  PeakCts   SNR AngSep     Name
#  [deg]    [deg]    ['] [deg]  [deg]                   [']
 38.8885 -77.0609    3.5  13.7   37.7   1.8414   3.3 ------	UNKNOWN
  2.8810 -45.5846    3.5  22.0 -171.3   1.7992   3.3 ------	UNKNOWN
113.0122 -38.4226    3.6  55.5  -20.4   6.9540   3.2 ------	UNKNOWN
 89.7573 -32.4201    5.2  50.6  -44.5   8.7301   2.3 ------	UNKNOWN
 89.9619 -32.2667    4.9  50.8  -44.5  10.9870   2.8 ------	UNKNOWN
Plot creation:
Sat May 30 16:44:27 EDT 2015