Special notes of this burst
Image
Pre-slew 15.0-350.0 keV image (Event data)
#   RAcent    DECcent   POSerr    Theta     Phi              Peak Cts       SNR   Name
   86.9305    82.9109   0.0088    18.6644   -22.1108         3.4578330     21.865 TRIG_00557274

Foreground time interval of the image:
-20.812 104.980 (delta_t = 125.792 [sec])
Background time interval of the image:
-590.195 -572.306 (delta_t =  17.890 [sec])
-239.296 -20.812 (delta_t = 218.484 [sec])
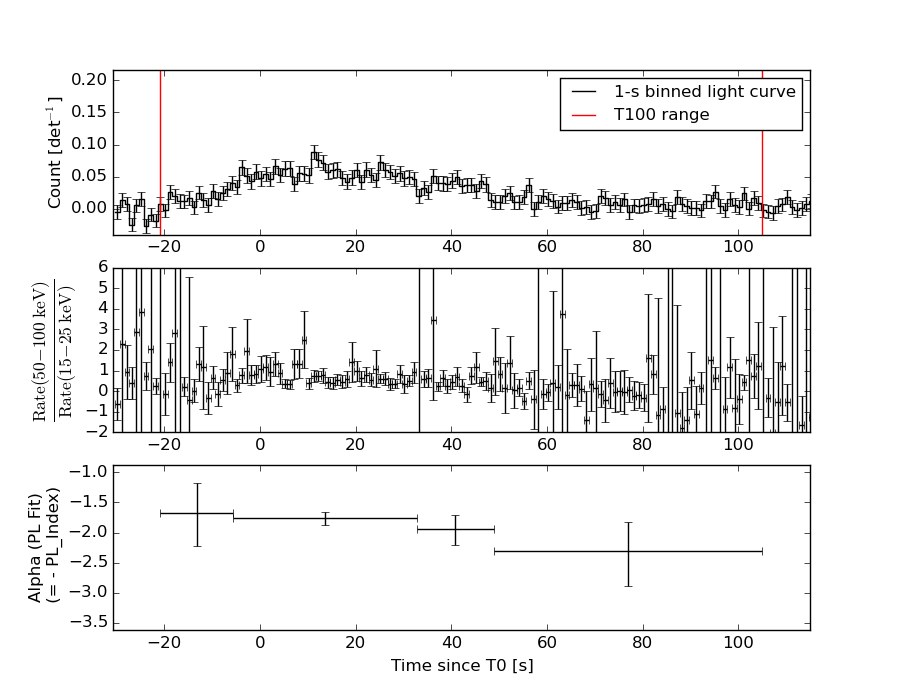
Lightcurves
Notes:
- 1) The mask-weighted light curves are using the flight position.
- 2) Multiple plots of different time binning/intervals are shown to cover all scenarios of short/long GRBs, rate/image triggers, and real/false positives.
- 3) For all the mask-weighted lightcurves, the y-axis units are counts/sec/det where a det is 0.4 x 0.4 = 0.16 sq cm.
- 4) The verticle lines correspond to following: green dotted lines are T50 interval, black dotted lines are T90 interval, blue solid line(s) is a spacecraft slew start time, and orange solid line(s) is a spacecraft slew end time.
- 5) Time of each bin is in the middle of the bin.
1 s binning
From T0-310 s to T0+310 s
From T100_start - 20 s to T100_end + 30 s
Full time interval
64 ms binning
Full time interval
From T100_start to T100_end

From T0-5 sec to T0+5 sec
16 ms binning
From T100_start-5 s to T100_start+5 s
Blue+Cyan dotted lines: Time interval of the scaled map
From 0.000000 to 8.192000
8 ms binning
From T100_start-3 s to T100_start+3 s
Blue+Cyan dotted lines: Time interval of the scaled map
From 0.000000 to 8.192000
2 ms binning
From T100_start-1 s to T100_start+1 s
Blue+Cyan dotted lines: Time interval of the scaled map
From 0.000000 to 8.192000
SN=5 or 10 sec. binning (whichever binning is satisfied first)
SN=5 or 10 sec. binning (T < 200 sec)
Quad-rate summed light curves (from T0-300s to T0+1000s)
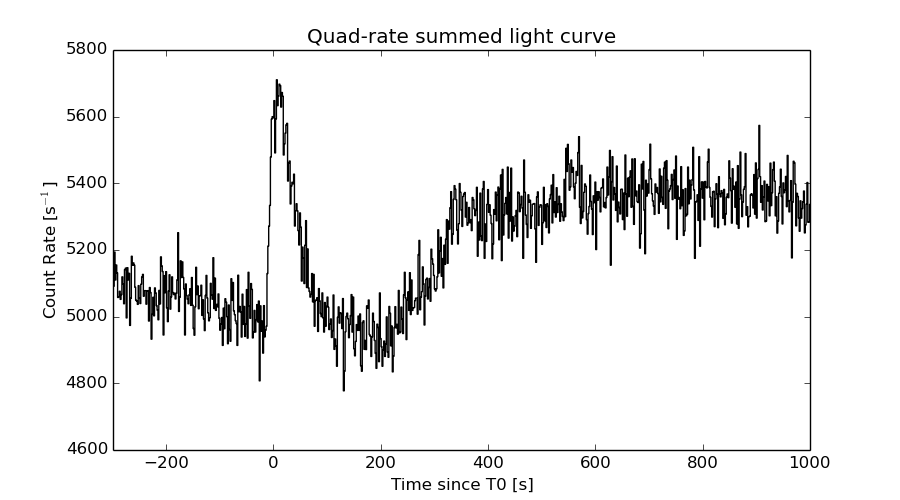
The mask-weighted light curves based on cleaned DPHs

Spectral Evolution
Spectra
Notes:
- 1) The fitting includes the systematic errors.
- 2) When the burst includes telescope slew time periods, the fitting uses an average response file made from multiple 5-s response files through out the slew time plus single time preiod for the non-slew times, and weighted by the total counts in the corresponding time period using addrmf. An average response file is needed becuase a spectral fit using the pre-slew DRM will introduce some errors in both a spectral shape and a normalization if the PHA file contains a lot of the slew/post-slew time interval.
- 3) For fits to more complicated models (e.g. a power-law over a cutoff power-law), the BAT team has decided to require a chi-square improvement of more than 6 for each extra dof.
Time averaged spectrum fit using the average DRM
Power-law model

Time interval is from  -20.812 sec. to  104.980 sec.

Spectral model in power-law:
------------------------------------------------------------
Parameters  : value       lower 90%   higher 90%
Photon index: 1.83538     ( -0.119303   0.122132 )
Norm@50keV  : 1.64484E-03    ( -0.000115207   0.000113692 )
------------------------------------------------------------
#Fit statistic : Chi-Squared =          40.94 using 59 PHA bins.
# Reduced chi-squared =         0.7182 for     57 degrees of freedom
# Null hypothesis probability =   9.463526e-01

Photon flux (15-150 keV)    in 125.8 sec: 0.229839 ( -0.0140227  0.0140501 ) ph/cm2/s
Energy fluence (15-150 keV)             : 1.90306e-06 ( -1.33903e-07  1.35541e-07 ) ergs/cm2
Cutoff power-law model
Time interval is from  -20.812 sec. to  104.980 sec.
Spectral model in the cutoff power-law:
------------------------------------------------------------
Parameters  : value       lower 90%   higher 90%
Photon index: 1.70516     ( -0.46928   0.246063 )
Epeak [keV] : 104.229      (   )
Norm@50keV  : 1.93030E-03    (     )
------------------------------------------------------------
#Fit statistic : Chi-Squared =          40.68 using 59 PHA bins.
# Reduced chi-squared =         0.7264 for     56 degrees of freedom
# Null hypothesis probability =   9.384025e-01

Photon flux (15-150 keV)    in 125.8 sec: 0.227935 ( -0.015277  0.01511 ) ph/cm2/s
Energy fluence (15-150 keV)             : 1.87754e-06 ( -1.58822e-07  1.54759e-07 ) ergs/cm2
Band function
Time interval is from  -20.812 sec. to  104.980 sec.

Spectral model in the Band function:
------------------------------------------------------------
Parameters  : value       lower 90%   higher 90%
alpha       : -1.60901   ( -4.6296   0.384925 )
beta        : -8.58710    ( 9.01086   19.0109 )
Epeak [keV] : 81.6978      ( -30.4436 -81.6978 )
Norm@50keV   : 2.15805E-03    ( -0.000128875   0.00109755 )
------------------------------------------------------------
#Fit statistic : Chi-Squared =          40.80 using 59 PHA bins.
# Reduced chi-squared =         0.7418 for     55 degrees of freedom
# Null hypothesis probability =   9.231620e-01

Photon flux (15-150 keV)    in 125.8 sec:  (    ) ph/cm2/s
Energy fluence (15-150 keV)             : 0 ( 0  0 ) ergs/cm2
Single BB
Spectral model blackbody:
------------------------------------------------------------
Parameters  : value    Lower 90%  Upper 90%
kT [keV]    : 11.6462  (-0.931951  1.02739)
R^2/D10^2   : 5.83116E-02  (-0.0156862   0.0212918)
(R is the radius in km and D10 is the distance to the source in units of 10 kpc)
------------------------------------------------------------
#Fit statistic : Chi-Squared =         108.41 using 59 PHA bins.
# Reduced chi-squared =         1.9020 for     57 degrees of freedom
# Null hypothesis probability =   4.778200e-05

Energy  Fluence     90% Error
[keV]   [erg/cm2]   [erg/cm2]
15- 25  2.098e-07   2.283e-08
25- 50  6.371e-07   4.611e-08
50-150  5.090e-07   7.982e-08
15-150  1.356e-06   9.800e-08
Thermal bremsstrahlung (OTTB)

Spectral model: thermal bremsstrahlung
------------------------------------------------------------
Parameters  : value         Lower 90%    Upper 90%
kT [keV]    : 98.0235       (-21.2559      32.2584)
Norm        : 1.00401       (-0.0878385     0.101796)
------------------------------------------------------------
#Fit statistic : Chi-Squared =          42.85 using 59 PHA bins.
# Reduced chi-squared =         0.7518 for     57 degrees of freedom
# Null hypothesis probability =   9.177863e-01

Energy  Fluence     90% Error
[keV]   [erg/cm2]   [erg/cm2]
15- 25  3.301e-07   3.472e-08
25- 50  5.685e-07   4.296e-08
50-150  9.108e-07   2.907e-07
15-150  1.809e-06   3.013e-07
Double BB
Spectral model: bbodyrad<1> + bbodyrad<2>
------------------------------------------------------------
Parameters  : value         Lower 90%    Upper 90%
kT1 [keV]   : 5.59045        (-1.21094      1.29604)
R1^2/D10^2  : 0.625993        (-0.330746      1.05706)
kT2 [keV]   : 20.9126        (-3.70739      5.67039)
R2^2/D10^2  : 5.33129E-03    (-0.00315096   0.00608872)
------------------------------------------------------------
#Fit statistic : Chi-Squared =          43.56 using 59 PHA bins.
# Reduced chi-squared =         0.7920 for     55 degrees of freedom
# Null hypothesis probability =   8.669534e-01

Energy  Fluence     90% Error
[keV]   [erg/cm2]   [erg/cm2]
15- 25  3.488e-07   9.573e-08
25- 50  5.344e-07   1.084e-07
50-150  9.443e-07   2.374e-07
15-150  1.827e-06   3.898e-07
Peak spectrum fit
Power-law model
Time interval is from   11.268 sec. to   12.268 sec.

Spectral model in power-law:
------------------------------------------------------------
Parameters  : value       lower 90%   higher 90%
Photon index: 1.46054     ( -0.335075   0.341095 )
Norm@50keV  : 6.06180E-03    ( -0.00122674   0.00120385 )
------------------------------------------------------------
#Fit statistic : Chi-Squared =          55.40 using 59 PHA bins.
# Reduced chi-squared =         0.9719 for     57 degrees of freedom
# Null hypothesis probability =   5.353561e-01

Photon flux (15-150 keV)    in 1 sec: 0.749005 ( -0.14241  0.142482 ) ph/cm2/s
Energy fluence (15-150 keV)             : 5.78956e-08 ( -1.28963e-08  1.32718e-08 ) ergs/cm2
Cutoff power-law model

Time interval is from   11.268 sec. to   12.268 sec.
Spectral model in the cutoff power-law:
------------------------------------------------------------
Parameters  : value       lower 90%   higher 90%
Photon index: 1.25464     ( -1.43315   1.39582 )
Epeak [keV] : 171.372      ( -172.222 -172.222 )
Norm@50keV  : 7.80331E-03    ( -0.00779484   0.0364665 )
------------------------------------------------------------
#Fit statistic : Chi-Squared =          55.31 using 59 PHA bins.
# Reduced chi-squared =         0.9876 for     56 degrees of freedom
# Null hypothesis probability =   5.010486e-01

Photon flux (15-150 keV)    in 1 sec: 0.742935 ( -0.146538  0.145956 ) ph/cm2/s
Energy fluence (15-150 keV)             : 5.67554e-08 ( -1.45043e-08  1.41401e-08 ) ergs/cm2
Band function
Time interval is from   11.268 sec. to   12.268 sec.

Spectral model in the Band function:
------------------------------------------------------------
Parameters  : value       lower 90%   higher 90%
alpha       : 4.77936   ( -4.77936   -4.77936 )
beta        : -1.60211    ( -0.464747   0.397069 )
Epeak [keV] : 26.0574      ( -26.0574 105.628 )
Norm@50keV   : 345.633    ( -65.0946   3.58619e+06 )
------------------------------------------------------------
#Fit statistic : Chi-Squared =          54.68 using 59 PHA bins.
# Reduced chi-squared =         0.9942 for     55 degrees of freedom
# Null hypothesis probability =   4.867322e-01

Photon flux (15-150 keV)    in 1 sec: 0.738867 (    ) ph/cm2/s
Energy fluence (15-150 keV)             : 0 ( 0  0 ) ergs/cm2
Single BB
Spectral model blackbody:
------------------------------------------------------------
Parameters  : value    Lower 90%  Upper 90%
kT [keV]    : 14.1900  (-3.41867  4.8181)
R^2/D10^2   : 0.102428  (-0.0648935   0.166973)
(R is the radius in km and D10 is the distance to the source in units of 10 kpc)
------------------------------------------------------------
#Fit statistic : Chi-Squared =          62.56 using 59 PHA bins.
# Reduced chi-squared =          1.097 for     57 degrees of freedom
# Null hypothesis probability =   2.855357e-01

Energy  Fluence     90% Error
[keV]   [erg/cm2]   [erg/cm2]
15- 25  4.351e-09   1.776e-09
25- 50  1.640e-08   5.743e-09
50-150  2.189e-08   1.075e-08
15-150  4.264e-08   1.498e-08
Thermal bremsstrahlung (OTTB)

Spectral model: thermal bremsstrahlung
------------------------------------------------------------
Parameters  : value         Lower 90%    Upper 90%
kT [keV]    : 199.359       (-106.81      -199.363)
Norm        : 3.06333       (-0.579704     0.580213)
------------------------------------------------------------
#Fit statistic : Chi-Squared =          55.46 using 59 PHA bins.
# Reduced chi-squared =         0.9731 for     57 degrees of freedom
# Null hypothesis probability =   5.328912e-01

Energy  Fluence     90% Error
[keV]   [erg/cm2]   [erg/cm2]
15- 25  7.628e-09   4.472e-09
25- 50  1.467e-08   8.465e-09
50-150  3.218e-08   1.834e-08
15-150  5.448e-08   3.089e-08
Double BB

Spectral model: bbodyrad<1> + bbodyrad<2>
------------------------------------------------------------
Parameters  : value         Lower 90%    Upper 90%
kT1 [keV]   : 6.38457        (-2.72164      4.59281)
R1^2/D10^2  : 1.09610        (-0.899467      7.84078)
kT2 [keV]   : 26.3903        (-10.2052      89.0562)
R2^2/D10^2  : 9.87810E-03    (-0.00956745   0.0525948)
------------------------------------------------------------
#Fit statistic : Chi-Squared =          54.70 using 59 PHA bins.
# Reduced chi-squared =         0.9946 for     55 degrees of freedom
# Null hypothesis probability =   4.860176e-01

Energy  Fluence     90% Error
[keV]   [erg/cm2]   [erg/cm2]
15- 25  7.617e-09   4.427e-09
25- 50  1.411e-08   7.490e-09
50-150  3.545e-08   2.121e-08
15-150  5.717e-08   3.015e-08
Pre-slew spectrum (Pre-slew PHA with pre-slew DRM)
Power-law model

Spectral model in power-law:
------------------------------------------------------------
Parameters  : value       lower 90%   higher 90%
Photon index: 1.83538     ( -0.119303   0.122132 )
Norm@50keV  : 1.64484E-03    ( -0.000115207   0.000113692 )
------------------------------------------------------------
#Fit statistic : Chi-Squared =          40.94 using 59 PHA bins.
# Reduced chi-squared =         0.7182 for     57 degrees of freedom
# Null hypothesis probability =   9.463526e-01

Photon flux (15-150 keV)    in 125.8 sec: 0.229839 ( -0.0140227  0.0140501 ) ph/cm2/s
Energy fluence (15-150 keV)             : 1.90306e-06 ( -1.33903e-07  1.35541e-07 ) ergs/cm2
Cutoff power-law model

Spectral model in the cutoff power-law:
------------------------------------------------------------
Parameters  : value       lower 90%   higher 90%
Photon index: 1.70516     ( -0.46928   0.246063 )
Epeak [keV] : 104.229      (   )
Norm@50keV  : 1.93030E-03    (     )
------------------------------------------------------------
#Fit statistic : Chi-Squared =          40.68 using 59 PHA bins.
# Reduced chi-squared =         0.7264 for     56 degrees of freedom
# Null hypothesis probability =   9.384025e-01

Photon flux (15-150 keV)    in 125.8 sec: 0.227935 ( -0.015277  0.01511 ) ph/cm2/s
Energy fluence (15-150 keV)             : 1.87754e-06 ( -1.58822e-07  1.54759e-07 ) ergs/cm2
Band function

Spectral model in the Band function:
------------------------------------------------------------
Parameters  : value       lower 90%   higher 90%
alpha       : -1.60901   ( -4.6296   0.384925 )
beta        : -8.58710    ( 9.01086   19.0109 )
Epeak [keV] : 81.6978      ( -30.4436 -81.6978 )
Norm@50keV   : 2.15805E-03    ( -0.000128875   0.00109755 )
------------------------------------------------------------
#Fit statistic : Chi-Squared =          40.80 using 59 PHA bins.
# Reduced chi-squared =         0.7418 for     55 degrees of freedom
# Null hypothesis probability =   9.231620e-01

Photon flux (15-150 keV)    in 125.8 sec:  (    ) ph/cm2/s
Energy fluence (15-150 keV)             : 0 ( 0  0 ) ergs/cm2
S(25-50 keV) vs. S(50-100 keV) plot

S(25-50 keV)  = 5.43e-07
S(50-100 keV) = 6.08e-07
T90 vs. Hardness ratio plot

T90                                   = 69.1279999613762 sec.
Hardness ratio (energy fluence ratio) = 1.11971
Color vs. Color plot

Count Ratio  (25-50 keV) / (15-25 keV) = 1.01932
Count Ratio (50-100 keV) / (15-25 keV) = 0.642686
Mask shadow pattern

IMX = 3.129479552960023E-01, IMY = 1.271434766404723E-01
TIME vs. PHA plot around the trigger time
Blue+Cyan dotted lines: Time interval of the scaled map
From 0.000000 to 8.192000
TIME vs. DetID plot around the trigger time
Blue+Cyan dotted lines: Time interval of the scaled map
From 0.000000 to 8.192000
100 us light curve (15-350 keV)
Blue+Cyan dotted lines: Time interval of the scaled map
From 0.000000 to 8.192000
Spacecraft aspect plot

Bright source in the pre-burst/pre-slew/post-slew images
Pre-burst image of 15-350 keV band
Time interval of the image:
-590.195400 -572.305500
-239.296000 -20.812000

# RAcent  DECcent POSerr Theta    Phi  PeakCts   SNR AngSep     Name
#  [deg]    [deg]    ['] [deg]  [deg]                   [']
196.9250  37.2128    2.4  40.8  113.9   3.7648   4.8 ------	UNKNOWN
169.7399  61.6142    2.1  11.2  119.8   1.0585   5.7 ------	UNKNOWN
168.5712  61.8390    2.6  10.7  121.3   0.8967   4.7 ------	UNKNOWN
346.4959  83.0952    2.3  27.6   -6.5   1.0157   5.1 ------	UNKNOWN
111.7924  23.3483    2.6  51.0 -135.9   4.3694   4.4 ------	UNKNOWN
Pre-slew background subtracted image of 15-350 keV band
Time interval of the image:
-20.812000 104.980000

# RAcent  DECcent POSerr Theta    Phi  PeakCts   SNR AngSep     Name
#  [deg]    [deg]    ['] [deg]  [deg]                   [']
 86.9305  82.9109    0.5  18.7  -22.1   3.4582  21.9 ------	UNKNOWN
121.8799  59.1287    2.2  15.4 -118.7   0.7968   5.3 ------	UNKNOWN
Post-slew image of 15-350 keV band
Time interval of the image:
344.804590 496.904600

# RAcent  DECcent POSerr Theta    Phi  PeakCts   SNR AngSep     Name
#  [deg]    [deg]    ['] [deg]  [deg]                   [']
170.1432 -60.5149  173.0  43.8 -155.5  -0.0201  -0.1    8.2	Cen X-3
186.4523 -62.6909    5.8  40.8 -166.6   0.4822   2.0    7.4	GX 301-2
244.9570 -15.6270    1.2  38.6   86.1   7.6527   9.9    1.5	Sco X-1
235.8238  13.5614    2.0  48.1   43.0   4.8775   5.7 ------	UNKNOWN
227.9613   5.5757    2.4  37.1   41.2   1.5574   4.9 ------	UNKNOWN
223.5443 -62.8885    2.2  41.1  167.8   1.4637   5.2 ------	UNKNOWN
218.8327 -77.4069    3.1  54.1  176.9   2.4893   3.8 ------	UNKNOWN
141.9307 -70.7246    3.6  58.8 -159.3   3.2651   3.2 ------	UNKNOWN
159.5224 -24.0094    3.5  41.2  -99.2   2.8985   3.3 ------	UNKNOWN
Plot creation:
Sat May 30 16:42:41 EDT 2015