Special notes of this burst
Image
Pre-slew 15.0-350.0 keV image (Event data; DETECTION mask)
#   RAcent    DECcent   POSerr    Theta     Phi              Peak Cts       SNR   Name
  134.5339   -33.4817   0.0128    42.7103  -110.5366         3.6670870     15.072 TRIG_00557508

Foreground time interval of the image:
 -1.544  16.597 (delta_t =  18.141 [sec])
Background time interval of the image:
-196.003  -1.544 (delta_t = 194.459 [sec])
Lightcurves
Notes:
- 1) All plots contain as much data as has been downloaded to date.
- 2) The mask-weighted light curves are using the flight position.
- 3) Multiple plots of different time binning/intervals are shown to cover all scenarios of short/long GRBs, rate/image triggers, and real/false positives.
- 4) For all the mask-weighted lightcurves, the y-axis units are counts/sec/det where a det is 0.4 x 0.4 = 0.16 sq cm.
- 5) The verticle lines correspond to following: green dotted lines are T50 interval, black dotted lines are T90 interval, blue solid line(s) is a spacecraft slew start time, and orange solid line(s) is a spacecraft slew end time.
- 6) Time of each bin is in the middle of the bin.
1 s binning
From T0-310 s to T0+310 s
From T100_start - 20 s to T100_end + 30 s
Full time interval
64 ms binning
Full time interval
From T100_start to T100_end

From T0-5 sec to T0+5 sec
16 ms binning
From T100_start-5 s to T100_start+5 s

Blue+Cyan dotted lines: Time interval of the scaled map
From 0.000000 to 1.024000
8 ms binning
From T100_start-3 s to T100_start+3 s

Blue+Cyan dotted lines: Time interval of the scaled map
From 0.000000 to 1.024000
2 ms binning
From T100_start-1 s to T100_start+1 s

Blue+Cyan dotted lines: Time interval of the scaled map
From 0.000000 to 1.024000
SN=5 or 10 sec. binning (whichever binning is satisfied first)
SN=5 or 10 sec. binning (T < 200 sec)
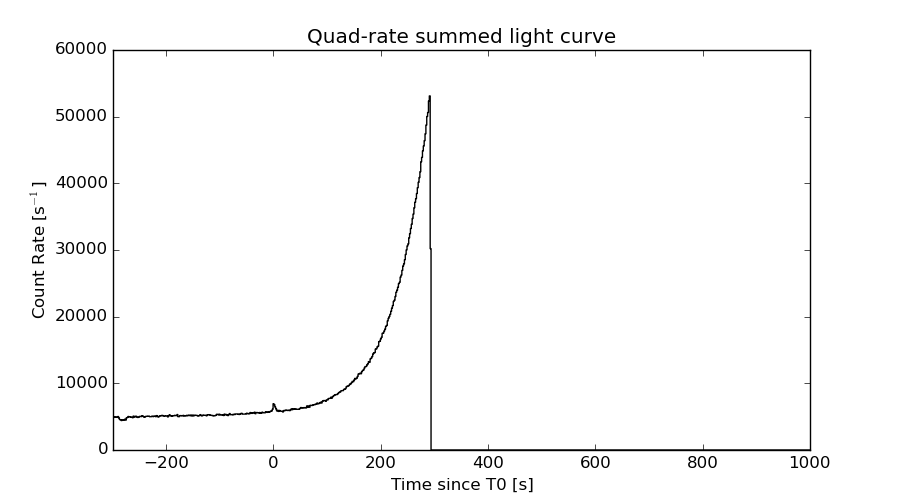
Quad-rate summed light curves (from T0-300s to T0+1000s)
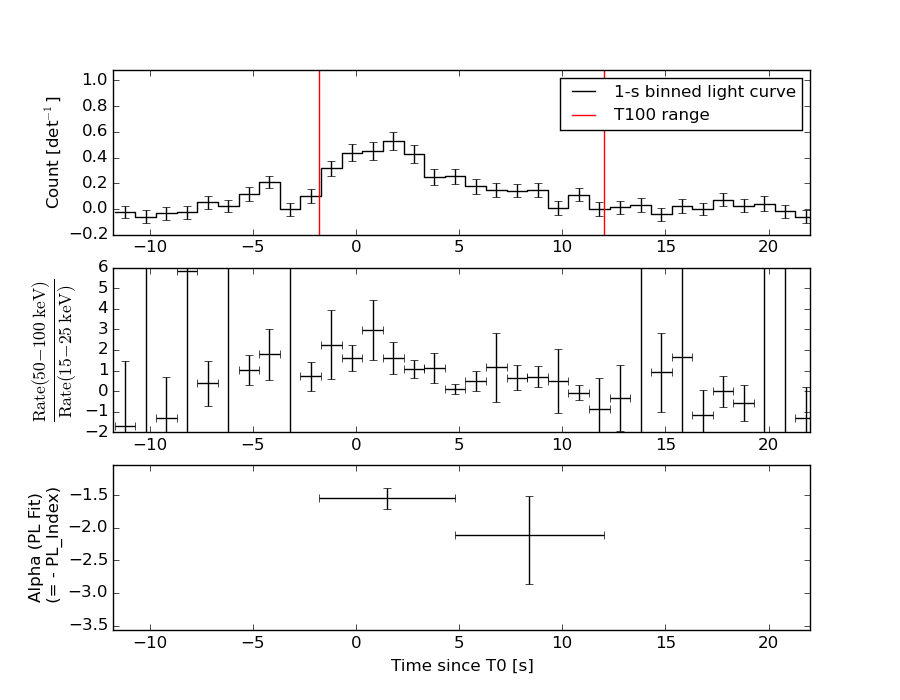
Spectral Evolution
Spectra
Notes:
- 1) The fitting includes the systematic errors.
- 2) For long bursts, a spectral fit of the pre-slew DRM will introduce some errors in both a spectral shape and a normalization if the PHA file contains a lot of the slew/post-slew time interval.
- 3) For fits to more complicated models (e.g. a power-law over a cutoff power-law), the BAT team has decided to require a chi-square improvement of more than 6 for each extra dof.
- 4) For short bursts (T90<1sec), the specrtum is also fit with Blackbody, OTTB, and Double Blackbody.
Time averaged spectrum fit using the pre-slew DRM
Power-law model
Time interval is from   -1.816 sec. to   12.008 sec.

Spectral model in power-law:
------------------------------------------------------------
Parameters  : value       lower 90%   higher 90%
Photon index: 1.61968     ( -0.170881   0.174721 )
Norm@50keV  : 1.76857E-02    ( -0.00189795   0.00188229 )
------------------------------------------------------------
#Fit statistic : Chi-Squared =          73.18 using 59 PHA bins.
# Reduced chi-squared =          1.284 for     57 degrees of freedom
# Null hypothesis probability =   7.315466e-02

Photon flux (15-150 keV)    in 13.82 sec: 2.28677 ( -0.237376  0.237711 ) ph/cm2/s
Energy fluence (15-150 keV)             : 2.28053e-06 ( -2.59437e-07  2.61769e-07 ) ergs/cm2
Cutoff power-law model

Time interval is from   -1.816 sec. to   12.008 sec.
Spectral model in the cutoff power-law:
------------------------------------------------------------
Parameters  : value       lower 90%   higher 90%
Photon index: 0.925919     ( -0.837212   0.70163 )
Epeak [keV] : 75.2505      ( -19.9255 1996.42 )
Norm@50keV  : 4.05091E-02    ( -0.0226431   0.0680615 )
------------------------------------------------------------
#Fit statistic : Chi-Squared =          70.35 using 59 PHA bins.
# Reduced chi-squared =          1.256 for     56 degrees of freedom
# Null hypothesis probability =   9.404477e-02

Photon flux (15-150 keV)    in 13.82 sec: 2.22775 ( -0.24539  0.24525 ) ph/cm2/s
Energy fluence (15-150 keV)             : 2.17611e-06 ( -2.83186e-07  2.84761e-07 ) ergs/cm2
Band function
Time interval is from   -1.816 sec. to   12.008 sec.

Spectral model in the Band function:
------------------------------------------------------------
Parameters  : value       lower 90%   higher 90%
alpha       : -0.845004   ( -0.675015   0.844407 )
beta        : -2.26295    ( 2.27095   0.711628 )
Epeak [keV] : 70.3341      ( -26.7662 756.89 )
Norm@50keV   : 4.52998E-02    ( -0.0279797   382.507 )
------------------------------------------------------------
#Fit statistic : Chi-Squared =          70.26 using 59 PHA bins.
# Reduced chi-squared =          1.277 for     55 degrees of freedom
# Null hypothesis probability =   8.063952e-02

Photon flux (15-150 keV)    in 13.82 sec: 2.22497 ( 4.77503  -0.24462 ) ph/cm2/s
Energy fluence (15-150 keV)             : 2.17628e-06 ( 0  0 ) ergs/cm2
Single BB
Spectral model blackbody:
------------------------------------------------------------
Parameters  : value    Lower 90%  Upper 90%
kT [keV]    : 13.7433  (-1.63151  1.85955)
R^2/D10^2   : 0.352048  (-0.129464   0.2033)
(R is the radius in km and D10 is the distance to the source in units of 10 kpc)
------------------------------------------------------------
#Fit statistic : Chi-Squared =          86.65 using 59 PHA bins.
# Reduced chi-squared =          1.520 for     57 degrees of freedom
# Null hypothesis probability =   6.875432e-03

Energy  Fluence     90% Error
[keV]   [erg/cm2]   [erg/cm2]
15- 25  1.944e-07   3.773e-08
25- 50  7.098e-07   1.003e-07
50-150  8.743e-07   1.888e-07
15-150  1.778e-06   2.446e-07
Thermal bremsstrahlung (OTTB)
Spectral model: thermal bremsstrahlung
------------------------------------------------------------
Parameters  : value         Lower 90%    Upper 90%
kT [keV]    : 158.955       (-56.2082      -158.609)
Norm        : 9.47105       (-1.05076     0.669534)
------------------------------------------------------------
#Fit statistic : Chi-Squared =          70.93 using 59 PHA bins.
# Reduced chi-squared =          1.244 for     57 degrees of freedom
# Null hypothesis probability =   1.015601e-01

Energy  Fluence     90% Error
[keV]   [erg/cm2]   [erg/cm2]
15- 25  3.344e-07   7.401e-08
25- 50  6.250e-07   2.595e-07
50-150  1.263e-06   6.810e-07
15-150  2.222e-06   1.034e-06
Double BB
Spectral model: bbodyrad<1> + bbodyrad<2>
------------------------------------------------------------
Parameters  : value         Lower 90%    Upper 90%
kT1 [keV]   : 6.96909        (-2.34319      2.98946)
R1^2/D10^2  : 2.34777        (-1.52323      7.19884)
kT2 [keV]   : 22.3514        (-5.63693      17.6985)
R2^2/D10^2  : 4.55241E-02    (-0.0403026   0.102889)
------------------------------------------------------------
#Fit statistic : Chi-Squared =          70.11 using 59 PHA bins.
# Reduced chi-squared =          1.275 for     55 degrees of freedom
# Null hypothesis probability =   8.242644e-02

Energy  Fluence     90% Error
[keV]   [erg/cm2]   [erg/cm2]
15- 25  3.097e-07   1.653e-07
25- 50  6.503e-07   3.256e-07
50-150  1.206e-06   6.682e-07
15-150  2.166e-06   1.129e-06
Peak spectrum fit
Power-law model
Time interval is from   -0.108 sec. to    0.892 sec.

Spectral model in power-law:
------------------------------------------------------------
Parameters  : value       lower 90%   higher 90%
Photon index: 1.19547     ( -0.337487   0.355394 )
Norm@50keV  : 3.28733E-02    ( -0.00719765   0.00716341 )
------------------------------------------------------------
#Fit statistic : Chi-Squared =          66.21 using 59 PHA bins.
# Reduced chi-squared =          1.162 for     57 degrees of freedom
# Null hypothesis probability =   1.889517e-01

Photon flux (15-150 keV)    in 1 sec: 3.85615 ( -0.882178  0.887786 ) ph/cm2/s
Energy fluence (15-150 keV)             : 3.33946e-07 ( -7.53587e-08  7.52316e-08 ) ergs/cm2
Cutoff power-law model

Time interval is from   -0.108 sec. to    0.892 sec.
Spectral model in the cutoff power-law:
------------------------------------------------------------
Parameters  : value       lower 90%   higher 90%
Photon index: -0.818746     ( -8.65068   3.34203 )
Epeak [keV] : 106.183      ( -25.9123 -105.052 )
Norm@50keV  : 0.149993    ( -0.164761   35.2796 )
------------------------------------------------------------
#Fit statistic : Chi-Squared =          64.47 using 59 PHA bins.
# Reduced chi-squared =          1.151 for     56 degrees of freedom
# Null hypothesis probability =   2.045349e-01

Photon flux (15-150 keV)    in 1 sec: 3.49673 ( -1.05483  1.02566 ) ph/cm2/s
Energy fluence (15-150 keV)             : 3.60901e-07 ( -8.2823e-08  8.5062e-08 ) ergs/cm2
Band function
Time interval is from   -0.108 sec. to    0.892 sec.

Spectral model in the Band function:
------------------------------------------------------------
Parameters  : value       lower 90%   higher 90%
alpha       : 0.773036   ( -1.35444   -0.106502 )
beta        : -10.0000    ( 10   1.42109e-14 )
Epeak [keV] : 106.752      ( -22.4312 228.731 )
Norm@50keV   : 0.145952    ( -0.145572   2.38688 )
------------------------------------------------------------
#Fit statistic : Chi-Squared =          64.48 using 59 PHA bins.
# Reduced chi-squared =          1.172 for     55 degrees of freedom
# Null hypothesis probability =   1.790471e-01

Photon flux (15-150 keV)    in 1 sec: 3.81810 (    ) ph/cm2/s
Energy fluence (15-150 keV)             : 0 ( 0  0 ) ergs/cm2
Single BB
Spectral model blackbody:
------------------------------------------------------------
Parameters  : value    Lower 90%  Upper 90%
kT [keV]    : 25.6152  (-4.50172  5.59587)
R^2/D10^2   : 9.37854E-02  (-0.0453094   0.0780865)
(R is the radius in km and D10 is the distance to the source in units of 10 kpc)
------------------------------------------------------------
#Fit statistic : Chi-Squared =          64.00 using 59 PHA bins.
# Reduced chi-squared =          1.123 for     57 degrees of freedom
# Null hypothesis probability =   2.442764e-01

Energy  Fluence     90% Error
[keV]   [erg/cm2]   [erg/cm2]
15- 25  1.055e-08   4.110e-09
25- 50  6.060e-08   2.000e-08
50-150  2.937e-07   1.017e-07
15-150  3.648e-07   1.238e-07
Thermal bremsstrahlung (OTTB)
Spectral model: thermal bremsstrahlung
------------------------------------------------------------
Parameters  : value         Lower 90%    Upper 90%
kT [keV]    : 200.000       (-65.0113      -200)
Norm        : 16.1993       (-3.6176     3.6176)
------------------------------------------------------------
#Fit statistic : Chi-Squared =          69.88 using 59 PHA bins.
# Reduced chi-squared =          1.226 for     57 degrees of freedom
# Null hypothesis probability =   1.175724e-01

Energy  Fluence     90% Error
[keV]   [erg/cm2]   [erg/cm2]
15- 25  4.036e-08   2.417e-08
25- 50  7.764e-08   4.547e-08
50-150  1.703e-07   1.002e-07
15-150  2.883e-07   1.666e-07
Double BB

Spectral model: bbodyrad<1> + bbodyrad<2>
------------------------------------------------------------
Parameters  : value         Lower 90%    Upper 90%
kT1 [keV]   : 2.85178        (-1.41986      2.00133)
R1^2/D10^2  : 242.733        (-231.424      49928.6)
kT2 [keV]   : 27.3232        (-4.91825      6.67518)
R2^2/D10^2  : 7.25103E-02    (-0.0379511   0.064211)
------------------------------------------------------------
#Fit statistic : Chi-Squared =          56.07 using 59 PHA bins.
# Reduced chi-squared =          1.020 for     55 degrees of freedom
# Null hypothesis probability =   4.343904e-01

Energy  Fluence     90% Error
[keV]   [erg/cm2]   [erg/cm2]
15- 25  4.185e-08   2.262e-08
25- 50  5.703e-08   2.616e-08
50-150  2.883e-07   1.169e-07
15-150  3.872e-07   1.401e-07
Pre-slew spectrum (Pre-slew PHA with pre-slew DRM)
Power-law model

Spectral model in power-law:
------------------------------------------------------------
Parameters  : value       lower 90%   higher 90%
Photon index: 1.61968     ( -0.170881   0.174721 )
Norm@50keV  : 1.76857E-02    ( -0.00189795   0.00188229 )
------------------------------------------------------------
#Fit statistic : Chi-Squared =          73.18 using 59 PHA bins.
# Reduced chi-squared =          1.284 for     57 degrees of freedom
# Null hypothesis probability =   7.315466e-02

Photon flux (15-150 keV)    in 13.82 sec: 2.28677 ( -0.237376  0.237711 ) ph/cm2/s
Energy fluence (15-150 keV)             : 2.28053e-06 ( -2.59437e-07  2.61769e-07 ) ergs/cm2
Cutoff power-law model

Spectral model in the cutoff power-law:
------------------------------------------------------------
Parameters  : value       lower 90%   higher 90%
Photon index: 0.925919     ( -0.837212   0.70163 )
Epeak [keV] : 75.2505      ( -19.9255 2429.28 )
Norm@50keV  : 4.05091E-02    ( -0.0226431   0.0680615 )
------------------------------------------------------------
#Fit statistic : Chi-Squared =          70.35 using 59 PHA bins.
# Reduced chi-squared =          1.256 for     56 degrees of freedom
# Null hypothesis probability =   9.404477e-02

Photon flux (15-150 keV)    in 13.82 sec: 2.22775 ( -0.24539  0.24525 ) ph/cm2/s
Energy fluence (15-150 keV)             : 2.17611e-06 ( -2.83186e-07  2.84761e-07 ) ergs/cm2
Band function

Spectral model in the Band function:
------------------------------------------------------------
Parameters  : value       lower 90%   higher 90%
alpha       : -0.845004   ( -0.67504   0.844407 )
beta        : -2.26295    ( 2.27095   0.711862 )
Epeak [keV] : 70.3341      ( -26.7662 756.89 )
Norm@50keV   : 4.52998E-02    ( -0.0279797   382.387 )
------------------------------------------------------------
#Fit statistic : Chi-Squared =          70.26 using 59 PHA bins.
# Reduced chi-squared =          1.277 for     55 degrees of freedom
# Null hypothesis probability =   8.063952e-02

Photon flux (15-150 keV)    in 13.82 sec: 2.22497 ( 4.77503  -0.24462 ) ph/cm2/s
Energy fluence (15-150 keV)             : 2.17628e-06 ( 0  0 ) ergs/cm2
S(25-50 keV) vs. S(50-100 keV) plot
S(25-50 keV)  = 5.96e-07
S(50-100 keV) = 7.76e-07
T90 vs. Hardness ratio plot
T90                                   = 10.1759999990463 sec.
Hardness ratio (energy fluence ratio) = 1.30201
Color vs. Color plot
Count Ratio  (25-50 keV) / (15-25 keV) = 1.73511
Count Ratio (50-100 keV) / (15-25 keV) = 1.137
Mask shadow pattern (with DETECTION mask)
IMX = -3.238303501896034E-01, IMY = 8.644403243361053E-01
TIME vs. PHA plot around the trigger time
Blue+Cyan dotted lines: Time interval of the scaled map
From 0.000000 to 1.024000
TIME vs. DetID plot around the trigger time
Blue+Cyan dotted lines: Time interval of the scaled map
From 0.000000 to 1.024000
100 us light curve (15-350 keV)
Blue+Cyan dotted lines: Time interval of the scaled map
From 0.000000 to 1.024000
Spacecraft aspect plot
Bright source in the pre-burst/pre-slew/post-slew images
Pre-burst image of 15-350 keV band
Time interval of the image:
-196.003400 -1.816000

# RAcent  DECcent POSerr Theta    Phi  PeakCts   SNR AngSep     Name
#  [deg]    [deg]    ['] [deg]  [deg]                   [']
135.5868 -40.5645    3.9  41.0 -120.9   1.4422   2.9    2.7	Vela X-1
170.4718 -60.6596    7.4  31.1 -169.1   0.3255   1.5    5.1	Cen X-3
186.8793 -62.6817   18.4  31.5  175.4  -0.1440  -0.6    8.1	GX 301-2
210.2346 -54.8845    3.1  29.4  147.3   0.9633   3.7 ------	UNKNOWN
155.7084  -4.1392    2.8  39.0  -55.5   1.5331   4.1 ------	UNKNOWN
Pre-slew background subtracted image of 15-350 keV band
Time interval of the image:
-1.816000 12.008000

# RAcent  DECcent POSerr Theta    Phi  PeakCts   SNR AngSep     Name
#  [deg]    [deg]    ['] [deg]  [deg]                   [']
135.4463 -40.3690    5.4  41.1 -120.6  -0.3836  -2.1   11.8	Vela X-1
170.0502 -60.6122    6.8  31.1 -168.7   0.1016   1.7    7.8	Cen X-3
186.5881 -62.7885    4.3  31.6  175.7  -0.1622  -2.7    2.2	GX 301-2
213.1119   2.4936    2.1  42.7   39.5   0.7024   5.5 ------	UNKNOWN
215.2905 -16.1913    2.2  31.0   64.4   0.4457   5.3 ------	UNKNOWN
224.9804 -47.8314    2.7  34.1  127.1   0.3765   4.3 ------	UNKNOWN
125.9260 -60.2450    2.4  48.3 -148.5   0.5825   4.8 ------	UNKNOWN
134.5383 -33.4725    0.9  42.7 -110.5   4.0662  13.5 ------	UNKNOWN
Post-slew image of 15-350 keV band
Time interval of the image:
76.596590 302.356000

# RAcent  DECcent POSerr Theta    Phi  PeakCts   SNR AngSep     Name
#  [deg]    [deg]    ['] [deg]  [deg]                   [']
135.6125 -40.7242    4.7   7.3  138.4   0.5251   2.4   10.9	Vela X-1
170.3539 -60.7028   11.7  35.7  115.3   0.4860   1.0    4.9	Cen X-3
138.3952 -63.7793    2.6  30.4  141.3   1.2839   4.4 ------	UNKNOWN
146.6079  -4.5191    2.9  31.1  -11.6   0.9424   4.0 ------	UNKNOWN
157.3279  19.3950    2.7  57.2   -9.6   4.2933   4.2 ------	UNKNOWN
 60.2060 -41.3116    2.8  57.8 -156.6   4.7511   4.1 ------	UNKNOWN
 87.0374 -20.2945    2.6  44.0 -120.4   4.2593   4.5 ------	UNKNOWN
Plot creation:
Fri Dec 18 19:05:35 EST 2015