Click here for the BAT GCN circular template
Image
Pre-slew 15.0-350.0 keV image (Event data)
#   RAcent    DECcent   POSerr    Theta     Phi              Peak Cts       SNR   Name
  249.3898    29.7973   0.0171    22.7361  -158.7690         0.5935933     11.257 TRIG_00557589

Foreground time interval of the image:
 -1.344  16.837 (delta_t =  18.181 [sec])
Background time interval of the image:
-190.763  -1.344 (delta_t = 189.419 [sec])
Lightcurves
Notes:
- 1) The mask-weighted light curves are using the flight position.
- 2) Multiple plots of different time binning/intervals are shown to cover all scenarios of short/long GRBs, rate/image triggers, and real/false positives.
- 3) For all the mask-weighted lightcurves, the y-axis units are counts/sec/det where a det is 0.4 x 0.4 = 0.16 sq cm.
- 4) The verticle lines correspond to following: green dotted lines are T50 interval, black dotted lines are T90 interval, blue solid line(s) is a spacecraft slew start time, and orange solid line(s) is a spacecraft slew end time.
- 5) Time of each bin is in the middle of the bin.
1 s binning
From T0-310 s to T0+310 s
From T100_start - 20 s to T100_end + 30 s
Full time interval
64 ms binning
Full time interval

From T100_start to T100_end
From T0-5 sec to T0+5 sec
16 ms binning
From T100_start-5 s to T100_start+5 s

Blue+Cyan dotted lines: Time interval of the scaled map
From 0.000000 to 1.024000
8 ms binning
From T100_start-3 s to T100_start+3 s
Blue+Cyan dotted lines: Time interval of the scaled map
From 0.000000 to 1.024000
2 ms binning
From T100_start-1 s to T100_start+1 s
Blue+Cyan dotted lines: Time interval of the scaled map
From 0.000000 to 1.024000
SN=5 or 10 sec. binning (whichever binning is satisfied first)
SN=5 or 10 sec. binning (T < 200 sec)
Quad-rate summed light curves (from T0-300s to T0+1000s)
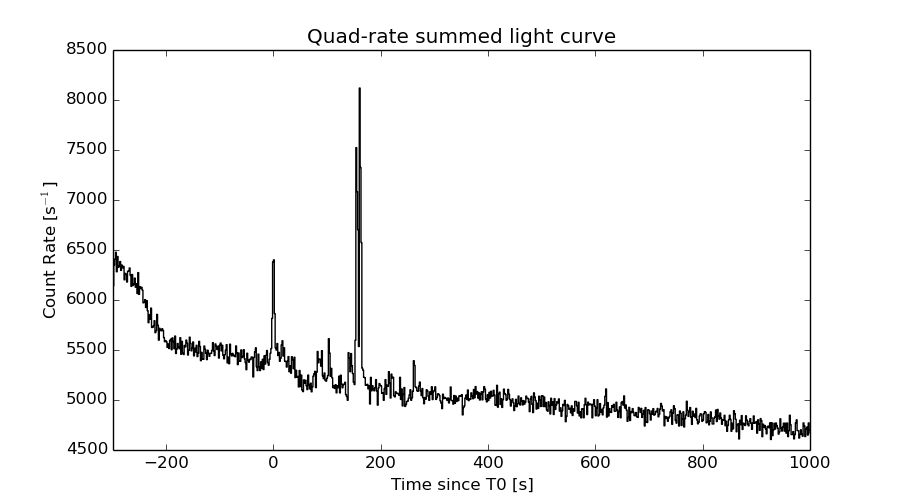
The mask-weighted light curves based on cleaned DPHs

Spectral Evolution

Spectra
Notes:
- 1) The fitting includes the systematic errors.
- 2) When the burst includes telescope slew time periods, the fitting uses an average response file made from multiple 5-s response files through out the slew time plus single time preiod for the non-slew times, and weighted by the total counts in the corresponding time period using addrmf. An average response file is needed becuase a spectral fit using the pre-slew DRM will introduce some errors in both a spectral shape and a normalization if the PHA file contains a lot of the slew/post-slew time interval.
- 3) For fits to more complicated models (e.g. a power-law over a cutoff power-law), the BAT team has decided to require a chi-square improvement of more than 6 for each extra dof.
Time averaged spectrum fit using the average DRM
Power-law model

Time interval is from   -1.344 sec. to  296.912 sec.

Spectral model in power-law:
------------------------------------------------------------
Parameters  : value       lower 90%   higher 90%
Photon index: 1.51869     ( -0.120014   0.120788 )
Norm@50keV  : 9.77123E-04    ( -6.81123e-05   6.77404e-05 )
------------------------------------------------------------
#Fit statistic : Chi-Squared =          52.24 using 59 PHA bins.
# Reduced chi-squared =         0.9165 for     57 degrees of freedom
# Null hypothesis probability =   6.538391e-01

Photon flux (15-150 keV)    in 298.3 sec: 0.122606 ( -0.00827506  0.0082825 ) ph/cm2/s
Energy fluence (15-150 keV)             : 2.75683e-06 ( -2.1168e-07  2.13664e-07 ) ergs/cm2
Cutoff power-law model
Time interval is from   -1.344 sec. to  296.912 sec.
Spectral model in the cutoff power-law:
------------------------------------------------------------
Parameters  : value       lower 90%   higher 90%
Photon index: 1.29075     ( -0.488257   0.291279 )
Epeak [keV] : 150.292      ( -72.4793 -150.3 )
Norm@50keV  : 1.28335E-03    ( -0.000361368   0.000981835 )
------------------------------------------------------------
#Fit statistic : Chi-Squared =          51.48 using 59 PHA bins.
# Reduced chi-squared =         0.9193 for     56 degrees of freedom
# Null hypothesis probability =   6.463191e-01

Photon flux (15-150 keV)    in 298.3 sec: 0.121189 ( -0.008719  0.008702 ) ph/cm2/s
Energy fluence (15-150 keV)             : 2.6976e-06 ( -2.42494e-07  2.37104e-07 ) ergs/cm2
Band function
Time interval is from   -1.344 sec. to  296.912 sec.

Spectral model in the Band function:
------------------------------------------------------------
Parameters  : value       lower 90%   higher 90%
alpha       : 3.45261   ( -3.9959   -3.9959 )
beta        : -1.57652    ( -0.151858   0.14271 )
Epeak [keV] : 24.3197      ( -23.9374 105.438 )
Norm@50keV   : 8.49016    ( -8.46493   49.4338 )
------------------------------------------------------------
#Fit statistic : Chi-Squared =          50.73 using 59 PHA bins.
# Reduced chi-squared =         0.9224 for     55 degrees of freedom
# Null hypothesis probability =   6.382957e-01

Photon flux (15-150 keV)    in 298.3 sec:  (    ) ph/cm2/s
Energy fluence (15-150 keV)             : 2.72532e-06 ( -2.72323e-06  -2.20465e-07 ) ergs/cm2
Single BB
Spectral model blackbody:
------------------------------------------------------------
Parameters  : value    Lower 90%  Upper 90%
kT [keV]    : 14.4294  (-1.25623  1.39613)
R^2/D10^2   : 1.55089E-02  (-0.00430367   0.00589164)
(R is the radius in km and D10 is the distance to the source in units of 10 kpc)
------------------------------------------------------------
#Fit statistic : Chi-Squared =         102.96 using 59 PHA bins.
# Reduced chi-squared =         1.8064 for     57 degrees of freedom
# Null hypothesis probability =   1.852875e-04

Energy  Fluence     90% Error
[keV]   [erg/cm2]   [erg/cm2]
15- 25  2.028e-07   2.653e-08
25- 50  7.769e-07   6.309e-08
50-150  1.081e-06   1.535e-07
15-150  2.061e-06   1.793e-07
Thermal bremsstrahlung (OTTB)
Spectral model: thermal bremsstrahlung
------------------------------------------------------------
Parameters  : value         Lower 90%    Upper 90%
kT [keV]    : 200.000       (      )
Norm        : 0.499536       (-0.0331303     0.0331296)
------------------------------------------------------------
#Fit statistic : Chi-Squared =          51.69 using 59 PHA bins.
# Reduced chi-squared =         0.9068 for     57 degrees of freedom
# Null hypothesis probability =   6.740102e-01

Energy  Fluence     90% Error
[keV]   [erg/cm2]   [erg/cm2]
15- 25  3.711e-07   3.117e-08
25- 50  7.139e-07   9.277e-08
50-150  1.566e-06   4.642e-07
15-150  2.651e-06   5.881e-07
Double BB

Spectral model: bbodyrad<1> + bbodyrad<2>
------------------------------------------------------------
Parameters  : value         Lower 90%    Upper 90%
kT1 [keV]   : 6.17849        (-1.28828      1.63312)
R1^2/D10^2  : 0.192464        (-0.104311      0.263942)
kT2 [keV]   : 23.7075        (-4.10843      7.38048)
R2^2/D10^2  : 2.24050E-03    (-0.00138252   0.00228535)
------------------------------------------------------------
#Fit statistic : Chi-Squared =          51.66 using 59 PHA bins.
# Reduced chi-squared =         0.9392 for     55 degrees of freedom
# Null hypothesis probability =   6.031809e-01

Energy  Fluence     90% Error
[keV]   [erg/cm2]   [erg/cm2]
15- 25  3.704e-07   1.173e-07
25- 50  6.923e-07   1.577e-07
50-150  1.584e-06   5.046e-07
15-150  2.647e-06   6.837e-07
Peak spectrum fit
Power-law model
Time interval is from  160.356 sec. to  161.356 sec.

Spectral model in power-law:
------------------------------------------------------------
Parameters  : value       lower 90%   higher 90%
Photon index: 1.01167     ( -0.125553   0.124083 )
Norm@50keV  : 2.17567E-02    ( -0.00153797   0.0015366 )
------------------------------------------------------------
#Fit statistic : Chi-Squared =          63.13 using 59 PHA bins.
# Reduced chi-squared =          1.108 for     57 degrees of freedom
# Null hypothesis probability =   2.686305e-01

Photon flux (15-150 keV)    in 1 sec: 2.50683 ( -0.17944  0.179015 ) ph/cm2/s
Energy fluence (15-150 keV)             : 2.34303e-07 ( -1.87006e-08  1.8792e-08 ) ergs/cm2
Cutoff power-law model

Time interval is from  160.356 sec. to  161.356 sec.
Spectral model in the cutoff power-law:
------------------------------------------------------------
Parameters  : value       lower 90%   higher 90%
Photon index: 0.913282     ( -0.482285   0.1582 )
Epeak [keV] : 625.590      ( -625.59 -625.59 )
Norm@50keV  : 2.41234E-02    ( -0.00360537   0.0151456 )
------------------------------------------------------------
#Fit statistic : Chi-Squared =          62.99 using 59 PHA bins.
# Reduced chi-squared =          1.125 for     56 degrees of freedom
# Null hypothesis probability =   2.427356e-01

Photon flux (15-150 keV)    in 1 sec: 2.50769 ( -0.19786  0.17676 ) ph/cm2/s
Energy fluence (15-150 keV)             : 2.3327e-07 ( -1.962e-08  1.9455e-08 ) ergs/cm2
Band function

Time interval is from  160.356 sec. to  161.356 sec.

Spectral model in the Band function:
------------------------------------------------------------
Parameters  : value       lower 90%   higher 90%
alpha       : -0.836154   ( 0.836154   0.836154 )
beta        : -1.01170    ( -0.124029   0.125601 )
Epeak [keV] : 60.0661      (   )
Norm@50keV   : 3.49990E-02    (     )
------------------------------------------------------------
#Fit statistic : Chi-Squared =          63.13 using 59 PHA bins.
# Reduced chi-squared =          1.148 for     55 degrees of freedom
# Null hypothesis probability =   2.109608e-01

Photon flux (15-150 keV)    in 1 sec:  (    ) ph/cm2/s
Energy fluence (15-150 keV)             : 0 ( 0  0 ) ergs/cm2
Single BB
Spectral model blackbody:
------------------------------------------------------------
Parameters  : value    Lower 90%  Upper 90%
kT [keV]    : 21.8102  (-2.20505  2.53204)
R^2/D10^2   : 9.13812E-02  (-0.0262621   0.0359681)
(R is the radius in km and D10 is the distance to the source in units of 10 kpc)
------------------------------------------------------------
#Fit statistic : Chi-Squared =         103.02 using 59 PHA bins.
# Reduced chi-squared =         1.8074 for     57 degrees of freedom
# Null hypothesis probability =   1.825475e-04

Energy  Fluence     90% Error
[keV]   [erg/cm2]   [erg/cm2]
15- 25  8.076e-09   1.088e-09
25- 50  4.249e-08   4.350e-09
50-150  1.510e-07   1.920e-08
15-150  2.015e-07   1.720e-08
Thermal bremsstrahlung (OTTB)
Spectral model: thermal bremsstrahlung
------------------------------------------------------------
Parameters  : value         Lower 90%    Upper 90%
kT [keV]    : 200.000       (      )
Norm        : 9.95064       (-0.734448     0.734447)
------------------------------------------------------------
#Fit statistic : Chi-Squared =         112.05 using 59 PHA bins.
# Reduced chi-squared =         1.9659 for     57 degrees of freedom
# Null hypothesis probability =   1.863768e-05

Energy  Fluence     90% Error
[keV]   [erg/cm2]   [erg/cm2]
15- 25  2.478e-08   2.645e-09
25- 50  4.766e-08   1.036e-08
50-150  1.045e-07   4.515e-08
15-150  1.770e-07   4.260e-08
Double BB
Spectral model: bbodyrad<1> + bbodyrad<2>
------------------------------------------------------------
Parameters  : value         Lower 90%    Upper 90%
kT1 [keV]   : 8.66222        (-2.25581      2.55859)
R1^2/D10^2  : 0.936446        (-0.487403      1.45209)
kT2 [keV]   : 37.6164        (-8.3797      18.9199)
R2^2/D10^2  : 1.46694E-02    (-0.00996073   0.0178131)
------------------------------------------------------------
#Fit statistic : Chi-Squared =          62.99 using 59 PHA bins.
# Reduced chi-squared =          1.145 for     55 degrees of freedom
# Null hypothesis probability =   2.145418e-01

Energy  Fluence     90% Error
[keV]   [erg/cm2]   [erg/cm2]
15- 25  1.619e-08   5.824e-09
25- 50  4.552e-08   1.375e-08
50-150  1.746e-07   8.106e-08
15-150  2.364e-07   8.135e-08
Pre-slew spectrum (Pre-slew PHA with pre-slew DRM)
Power-law model
Spectral model in power-law:
------------------------------------------------------------
Parameters  : value       lower 90%   higher 90%
Photon index: 1.66597     ( -0.230388   0.237668 )
Norm@50keV  : 2.02838E-03    ( -0.000302016   0.000296134 )
------------------------------------------------------------
#Fit statistic : Chi-Squared =          79.05 using 59 PHA bins.
# Reduced chi-squared =          1.387 for     57 degrees of freedom
# Null hypothesis probability =   2.824939e-02

Photon flux (15-150 keV)    in 18.18 sec: 0.266268 ( -0.0351031  0.0351133 ) ph/cm2/s
Energy fluence (15-150 keV)             : 3.42429e-07 ( -5.34901e-08  5.47563e-08 ) ergs/cm2
Cutoff power-law model
Spectral model in the cutoff power-law:
------------------------------------------------------------
Parameters  : value       lower 90%   higher 90%
Photon index: 1.23826     ( -1.03455   0.629485 )
Epeak [keV] : 78.5430      ( -31.1032 -78.543 )
Norm@50keV  : 3.52056E-03    ( -0.00112658   0.0097763 )
------------------------------------------------------------
#Fit statistic : Chi-Squared =          78.33 using 59 PHA bins.
# Reduced chi-squared =          1.399 for     56 degrees of freedom
# Null hypothesis probability =   2.606693e-02

Photon flux (15-150 keV)    in 18.18 sec: 0.261867 ( -0.036154  0.03614 ) ph/cm2/s
Energy fluence (15-150 keV)             : 3.26633e-07 ( -6.10357e-08  6.27046e-08 ) ergs/cm2
Band function

Spectral model in the Band function:
------------------------------------------------------------
Parameters  : value       lower 90%   higher 90%
alpha       : -1.25630   ( -0.507038   0.654304 )
beta        : -9.37068    ( 9.37161   19.3716 )
Epeak [keV] : 80.1105      ( -32.4955 -79.747 )
Norm@50keV   : 3.43865E-03    ( -0.00168869   0.00102028 )
------------------------------------------------------------
#Fit statistic : Chi-Squared =          78.33 using 59 PHA bins.
# Reduced chi-squared =          1.424 for     55 degrees of freedom
# Null hypothesis probability =   2.107565e-02

Photon flux (15-150 keV)    in 18.18 sec:  (    ) ph/cm2/s
Energy fluence (15-150 keV)             : 3.28909e-07 ( -3.28782e-07  -5.46e-08 ) ergs/cm2
S(25-50 keV) vs. S(50-100 keV) plot
S(25-50 keV)  = 6.88e-07
S(50-100 keV) = 9.60e-07
T90 vs. Hardness ratio plot
T90                                   = 276.65600001812 sec.
Hardness ratio (energy fluence ratio) = 1.39535
Color vs. Color plot
Count Ratio  (25-50 keV) / (15-25 keV) = 1.30783
Count Ratio (50-100 keV) / (15-25 keV) = 0.976729
Mask shadow pattern
IMX = -3.906085022890637E-01, IMY = 1.517500515839977E-01
TIME vs. PHA plot around the trigger time
Blue+Cyan dotted lines: Time interval of the scaled map
From 0.000000 to 1.024000
TIME vs. DetID plot around the trigger time
Blue+Cyan dotted lines: Time interval of the scaled map
From 0.000000 to 1.024000
100 us light curve (15-350 keV)
Blue+Cyan dotted lines: Time interval of the scaled map
From 0.000000 to 1.024000
Spacecraft aspect plot

Bright source in the pre-burst/pre-slew/post-slew images
Pre-burst image of 15-350 keV band
Time interval of the image:
-190.763400 -1.344000

# RAcent  DECcent POSerr Theta    Phi  PeakCts   SNR AngSep     Name
#  [deg]    [deg]    ['] [deg]  [deg]                   [']
254.6423  35.4200    7.6  21.9 -140.0  -0.2941  -1.5   10.2	Her X-1
268.4821  -1.4196    6.5  21.4   89.9  -0.3981  -1.8    7.1	SW J1753.5-0127
273.9632 -13.9037   12.6  33.7   76.9   0.3789   0.9    8.3	GX 17+2
288.8033  10.9552    0.8  18.5   16.3   2.6162  15.2    0.7	GRS 1915+105
299.5890  35.1256    3.4  28.8  -47.5   0.7408   3.4    4.6	Cyg X-1
308.0704  40.8973    3.7  37.3  -52.1   0.9860   3.2    3.8	Cyg X-3
326.3080  38.2501   30.0  50.3  -43.3   0.4238   0.4    7.7	Cyg X-2
214.8382  16.5822    3.1  54.1  177.1   2.8787   3.7 ------	UNKNOWN
232.9090  31.6368    2.7  36.9 -162.7   0.9717   4.2 ------	UNKNOWN
326.7058  39.1790    4.1  50.7  -44.5   3.0004   2.8 ------	UNKNOWN
Pre-slew background subtracted image of 15-350 keV band
Time interval of the image:
-1.344000 16.836600

# RAcent  DECcent POSerr Theta    Phi  PeakCts   SNR AngSep     Name
#  [deg]    [deg]    ['] [deg]  [deg]                   [']
254.3170  35.4843    4.6  22.1 -140.3  -0.1365  -2.5   10.9	Her X-1
268.2454  -1.3322    5.0  21.4   90.6   0.1555   2.3   10.3	SW J1753.5-0127
273.8571 -14.1087  101.2  33.9   77.1   0.0124   0.1    9.7	GX 17+2
288.9093  10.7735    0.0  18.7   16.7  -0.0589  -1.2   12.2	GRS 1915+105
299.5286  35.0683   26.4  28.8  -47.4  -0.0271  -0.4    8.6	Cyg X-1
308.0057  41.1083    7.6  37.4  -52.4   0.1366   1.5   10.5	Cyg X-3
326.1372  38.3927    3.5  50.1  -43.5   0.7808   3.3    4.6	Cyg X-2
235.5920  -4.3384    2.1  43.0  140.4   0.8476   5.4 ------	UNKNOWN
249.3898  29.7973    1.0  22.7 -158.8   0.5935  11.3 ------	UNKNOWN
265.1741  40.7074    1.9  21.8 -113.3   0.3351   6.1 ------	UNKNOWN
Post-slew image of 15-350 keV band
Time interval of the image:
61.436590 962.386000

# RAcent  DECcent POSerr Theta    Phi  PeakCts   SNR AngSep     Name
#  [deg]    [deg]    ['] [deg]  [deg]                   [']
254.4107  35.2935    6.6   6.9  -47.1   0.9617   1.7    3.7	Her X-1
268.3745  -1.4416   16.2  36.1   63.4   0.9418   0.7    0.8	SW J1753.5-0127
288.7875  10.9231    1.0  41.2   25.7  11.1224  11.9    1.5	GRS 1915+105
299.5790  35.0841    2.9  42.2  -13.9   3.0302   4.0    7.1	Cyg X-1
308.0922  40.9609    2.5  48.2  -23.2   5.7029   4.7    1.0	Cyg X-3
220.2207  -7.0118    2.8  46.3  138.9  10.2571   4.2 ------	UNKNOWN
195.3402   9.8236    4.6  54.1  177.0   5.7673   2.5 ------	UNKNOWN
249.3903  29.8293    1.2   0.1 -115.5   4.9402   9.4 ------	UNKNOWN
190.8572  11.3177    3.7  57.2 -178.9  11.4269   3.2 ------	UNKNOWN
212.8719  33.7836    3.5  31.2 -156.2   2.3693   3.3 ------	UNKNOWN
220.6487  37.2982    3.1  25.0 -148.0   2.0125   3.8 ------	UNKNOWN
225.9346  43.1627    3.1  23.0 -131.2   2.1397   3.7 ------	UNKNOWN
185.3452  21.3341    4.1  57.7 -165.4   9.4656   2.8 ------	UNKNOWN
184.2286  20.2947    3.7  59.1 -166.1  14.5760   3.1 ------	UNKNOWN
182.1903  25.8401    3.7  58.7 -159.3  16.6563   3.1 ------	UNKNOWN
223.2586  67.8604    6.1  41.1  -97.8   7.2354   1.9 ------	UNKNOWN
186.1790  46.3146    4.0  51.0 -135.7  10.4110   2.9 ------	UNKNOWN
Plot creation:
Sat May 30 16:37:12 EDT 2015