Click here for the BAT GCN circular template
Image
Pre-slew 15-350 keV image (Event data; bkg subtracted)

#   RAcent  DECcent POSerr  Theta    Phi     Peak Cts     SNR  Name
  256.0638 -37.4519 1.0105    8.8   83.7      -0.1315    -0.2  TRIG_00557674
------------------------------------------

Foreground time interval of the image:
  0.000 768.000 (delta_t = 768.000 [sec])
Background time interval of the image:
Lightcurves
Notes:
- 1) All plots contain as much data as has been downloaded to date.
- 2) The mask-weighted light curves are using the flight position.
- 3) Multiple plots of different time binning/intervals are shown to cover all scenarios of short/long GRBs, rate/image triggers, and real/false positives.
- 4) For all the mask-weighted lightcurves, the y-axis units are counts/sec/det where a det is 0.4 x 0.4 = 0.16 sq cm.
- 5) The verticle lines correspond to following: green dotted lines are T50 interval, black dotted lines are T90 interval, blue solid line(s) is a spacecraft slew start time, and orange solid line(s) is a spacecraft slew end time.
- 6) Time of each bin is in the middle of the bin.
1 s binning
From T0-310 s to T0+310 s

From T100_start - 20 s to T100_end + 30 s

Full time interval

64 ms binning
Full time interval

From T100_start to T100_end

From T0-5 sec to T0+5 sec

16 ms binning
From T100_start-5 s to T100_start+5 s

8 ms binning
From T100_start-3 s to T100_start+3 s

2 ms binning
From T100_start-1 s to T100_start+1 s

SN=5 or 10 sec. binning (whichever binning is satisfied first)

SN=5 or 10 sec. binning (T < 200 sec)

Spectra
Notes:
- 1) The fitting includes the systematic errors.
- 2) For long bursts, a spectral fit of the pre-slew DRM will introduce some errors in both a spectral shape and a normalization if the PHA file contains a lot of the slew/post-slew time interval.
- 3) For fits to more complicated models (e.g. a power-law over a cutoff power-law), the BAT team has decided to require a chi-square improvement of more than 6 for each extra dof.
- 4) For short bursts (T90<1sec), the specrtum is also fit with Blackbody, OTTB, and Double Blackbody.
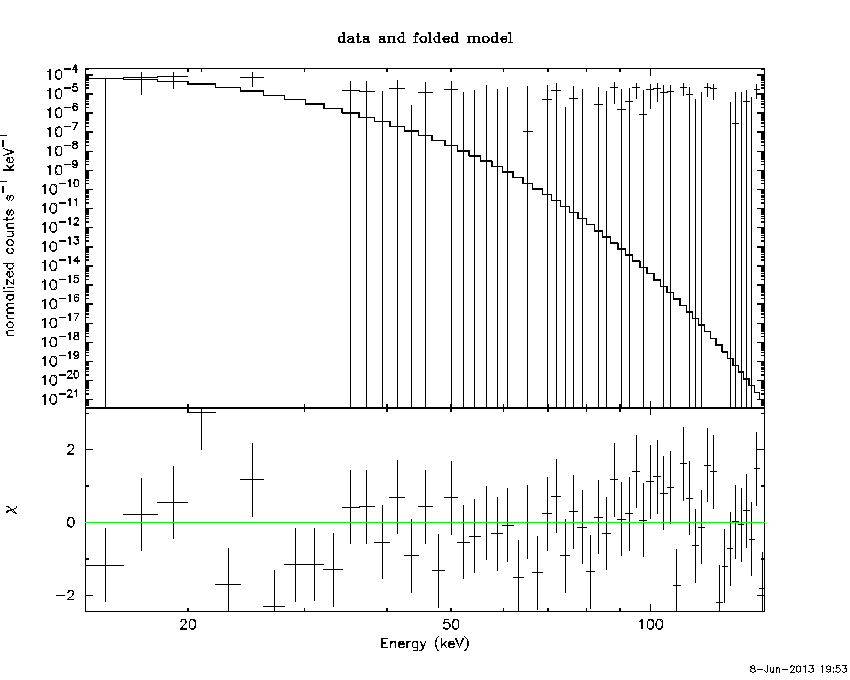
Time averaged spectrum fit using the pre-slew DRM
Power-law model

Time interval is from    0.000 sec. to  768.000 sec.

Spectral model in power-law:
------------------------------------------------------------
Parameters  : value       lower 90%   higher 90%
Photon index: 1.50000     ( -1.5   -1.5 )
Norm@50keV  : 0.0    ( 0   4.50931e-05 )
------------------------------------------------------------
#Fit statistic : Chi-Squared =          71.66 using 59 PHA bins.
# Reduced chi-squared =          1.257 for     57 degrees of freedom
# Null hypothesis probability =   9.155875e-02

Photon flux (15-150 keV)    in 768 sec: 3.37686E-03 ( -0.00337686  0.00460079 ) ph/cm2/s
Energy fluence (15-150 keV)             : 8.49976e-08 ( -8.49976e-08  1.56732e-07 ) ergs/cm2
Cutoff power-law model

Time interval is from    0.000 sec. to  768.000 sec.
Spectral model in the cutoff power-law:
------------------------------------------------------------
Parameters  : value       lower 90%   higher 90%
Photon index: 1.00000     (     )
Epeak [keV] : 50.0000      (   )
Norm@50keV  : 0.0    (     )
------------------------------------------------------------
#Fit statistic : Chi-Squared =          71.66 using 59 PHA bins.
# Reduced chi-squared =          1.280 for     56 degrees of freedom
# Null hypothesis probability =   7.751167e-02

Photon flux (15-150 keV)    in 768 sec: 5.51485E-03 ( -0.00436845  0.00445687 ) ph/cm2/s
Energy fluence (15-150 keV)             : 0 ( 0  7.34008e-07 ) ergs/cm2
Band function

Time interval is from    0.000 sec. to  768.000 sec.

Spectral model in the Band function:
------------------------------------------------------------
Parameters  : value       lower 90%   higher 90%
alpha       : 3.10527   ( 0.98395   0.98395 )
beta        : -9.37167    ( 2.5   2.5 )
Epeak [keV] : 13.7396      ( -80 -80 )
Norm@50keV   : 10.5528    ( -11.2391   695.387 )
------------------------------------------------------------
#Fit statistic : Chi-Squared =          68.35 using 59 PHA bins.
# Reduced chi-squared =          1.243 for     55 degrees of freedom
# Null hypothesis probability =   1.065919e-01

Photon flux (15-150 keV)    in 768 sec:  (    ) ph/cm2/s
Energy fluence (15-150 keV)             : 0 ( 0  0 ) ergs/cm2
Single BB

Spectral model blackbody:
------------------------------------------------------------
Parameters  : value    Lower 90%  Upper 90%
kT [keV]    : 3.13124  (-3.11632  3.14278)
R^2/D10^2   : 0.490679  (-0.514376   167.147)
(R is the radius in km and D10 is the distance to the source in units of 10 kpc)
------------------------------------------------------------
#Fit statistic : Chi-Squared =          68.55 using 59 PHA bins.
# Reduced chi-squared =          1.203 for     57 degrees of freedom
# Null hypothesis probability =   1.406277e-01

Energy  Fluence     90% Error
[keV]   [erg/cm2]   [erg/cm2]
15- 25  9.147e-08   5.898e-08
25- 50  1.544e-08   1.197e-08
50-150  3.495e-11   4.044e-11
15-150  1.069e-07   7.837e-08
Thermal bremsstrahlung (OTTB)

Spectral model: thermal bremsstrahlung
------------------------------------------------------------
Parameters  : value         Lower 90%    Upper 90%
kT [keV]    : 6.07104       (-6.10339      -6.10339)
Norm        : 0.477323       (-0.46735     -0.46735)
------------------------------------------------------------
#Fit statistic : Chi-Squared =          69.11 using 59 PHA bins.
# Reduced chi-squared =          1.212 for     57 degrees of freedom
# Null hypothesis probability =   1.304874e-01

Energy  Fluence     90% Error
[keV]   [erg/cm2]   [erg/cm2]
15- 25  7.870e-08   5.257e-08
25- 50  1.498e-08   1.114e-08
50-150  1.897e-10   2.713e-10
15-150  9.388e-08   5.633e-08
Double BB

Spectral model: bbodyrad<1> + bbodyrad<2>
------------------------------------------------------------
Parameters  : value         Lower 90%    Upper 90%
kT1 [keV]   : 3.10577        (-3.1007      3.17285)
R1^2/D10^2  : 0.516892        (-0.523892      163.395)
kT2 [keV]   : 0.145302        (-0.145302      -0.145302)
R2^2/D10^2  : 9.98027E-04    (-0.000999681   -0.000999681)
------------------------------------------------------------
#Fit statistic : Chi-Squared =          68.55 using 59 PHA bins.
# Reduced chi-squared =          1.246 for     55 degrees of freedom
# Null hypothesis probability =   1.036659e-01

Energy  Fluence     90% Error
[keV]   [erg/cm2]   [erg/cm2]
15- 25  0.000e+00   0.000e+00
25- 50  0.000e+00   0.000e+00
50-150  0.000e+00   0.000e+00
15-150  0.000e+00   0.000e+00
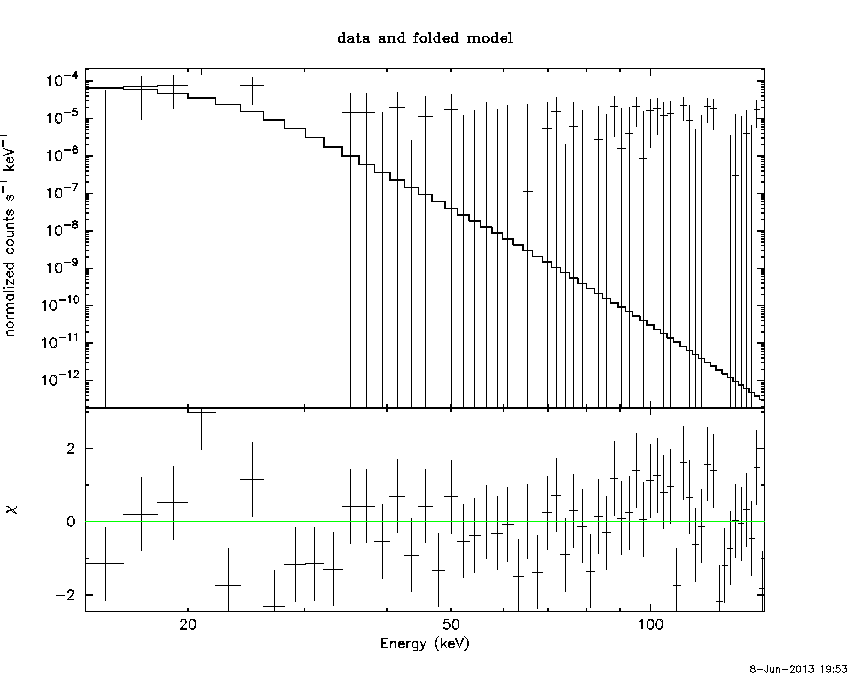
Peak spectrum fit
Power-law model

Time interval is from    0.000 sec. to  768.000 sec.

Spectral model in power-law:
------------------------------------------------------------
Parameters  : value       lower 90%   higher 90%
Photon index: 1.50000     ( -1.5   -1.5 )
Norm@50keV  : 0.0    ( 0   4.50931e-05 )
------------------------------------------------------------
#Fit statistic : Chi-Squared =          71.66 using 59 PHA bins.
# Reduced chi-squared =          1.257 for     57 degrees of freedom
# Null hypothesis probability =   9.155875e-02

Photon flux (15-150 keV)    in 768 sec: 3.37686E-03 ( -0.00337686  0.00460079 ) ph/cm2/s
Energy fluence (15-150 keV)             : 8.49976e-08 ( -8.49976e-08  1.56732e-07 ) ergs/cm2
Cutoff power-law model

Time interval is from    0.000 sec. to  768.000 sec.
Spectral model in the cutoff power-law:
------------------------------------------------------------
Parameters  : value       lower 90%   higher 90%
Photon index: 1.00000     (     )
Epeak [keV] : 50.0000      (   )
Norm@50keV  : 0.0    (     )
------------------------------------------------------------
#Fit statistic : Chi-Squared =          71.66 using 59 PHA bins.
# Reduced chi-squared =          1.280 for     56 degrees of freedom
# Null hypothesis probability =   7.751167e-02

Photon flux (15-150 keV)    in 768 sec: 5.51485E-03 ( -0.00436845  0.00445687 ) ph/cm2/s
Energy fluence (15-150 keV)             : 0 ( 0  7.34008e-07 ) ergs/cm2
Band function

Time interval is from    0.000 sec. to  768.000 sec.

Spectral model in the Band function:
------------------------------------------------------------
Parameters  : value       lower 90%   higher 90%
alpha       : 3.10527   ( 0.98395   0.98395 )
beta        : -9.37167    ( 2.5   2.5 )
Epeak [keV] : 13.7396      ( -80 -80 )
Norm@50keV   : 10.5528    ( -11.2391   695.387 )
------------------------------------------------------------
#Fit statistic : Chi-Squared =          68.35 using 59 PHA bins.
# Reduced chi-squared =          1.243 for     55 degrees of freedom
# Null hypothesis probability =   1.065919e-01

Photon flux (15-150 keV)    in 768 sec:  (    ) ph/cm2/s
Energy fluence (15-150 keV)             : 0 ( 0  0 ) ergs/cm2
Single BB

Spectral model blackbody:
------------------------------------------------------------
Parameters  : value    Lower 90%  Upper 90%
kT [keV]    : 3.13124  (-3.11632  3.14278)
R^2/D10^2   : 0.490679  (-0.514376   167.147)
(R is the radius in km and D10 is the distance to the source in units of 10 kpc)
------------------------------------------------------------
#Fit statistic : Chi-Squared =          68.55 using 59 PHA bins.
# Reduced chi-squared =          1.203 for     57 degrees of freedom
# Null hypothesis probability =   1.406277e-01

Energy  Fluence     90% Error
[keV]   [erg/cm2]   [erg/cm2]
15- 25  9.147e-08   6.351e-08
25- 50  1.544e-08   1.268e-08
50-150  3.495e-11   7.972e-11
15-150  1.069e-07   7.780e-08
Thermal bremsstrahlung (OTTB)

Spectral model: thermal bremsstrahlung
------------------------------------------------------------
Parameters  : value         Lower 90%    Upper 90%
kT [keV]    : 6.07104       (-6.10339      -6.10339)
Norm        : 0.477323       (-0.46735     -0.46735)
------------------------------------------------------------
#Fit statistic : Chi-Squared =          69.11 using 59 PHA bins.
# Reduced chi-squared =          1.212 for     57 degrees of freedom
# Null hypothesis probability =   1.304874e-01

Energy  Fluence     90% Error
[keV]   [erg/cm2]   [erg/cm2]
15- 25  7.870e-08   5.556e-08
25- 50  1.498e-08   1.441e-08
50-150  1.897e-10   1.907e-10
15-150  9.388e-08   6.086e-08
Double BB
Spectral model: bbodyrad<1> + bbodyrad<2>
------------------------------------------------------------
Parameters  : value         Lower 90%    Upper 90%
kT1 [keV]   : 3.10577        (-3.1007      3.17285)
R1^2/D10^2  : 0.516892        (-0.523892      163.395)
kT2 [keV]   : 0.145302        (-0.145302      -0.145302)
R2^2/D10^2  : 9.98027E-04    (-0.000999681   -0.000999681)
------------------------------------------------------------
#Fit statistic : Chi-Squared =          68.55 using 59 PHA bins.
# Reduced chi-squared =          1.246 for     55 degrees of freedom
# Null hypothesis probability =   1.036659e-01

Energy  Fluence     90% Error
[keV]   [erg/cm2]   [erg/cm2]
15- 25  0.000e+00   0.000e+00
25- 50  0.000e+00   0.000e+00
50-150  0.000e+00   0.000e+00
15-150  0.000e+00   0.000e+00
Pre-slew spectrum (Pre-slew PHA with pre-slew DRM)
Power-law model
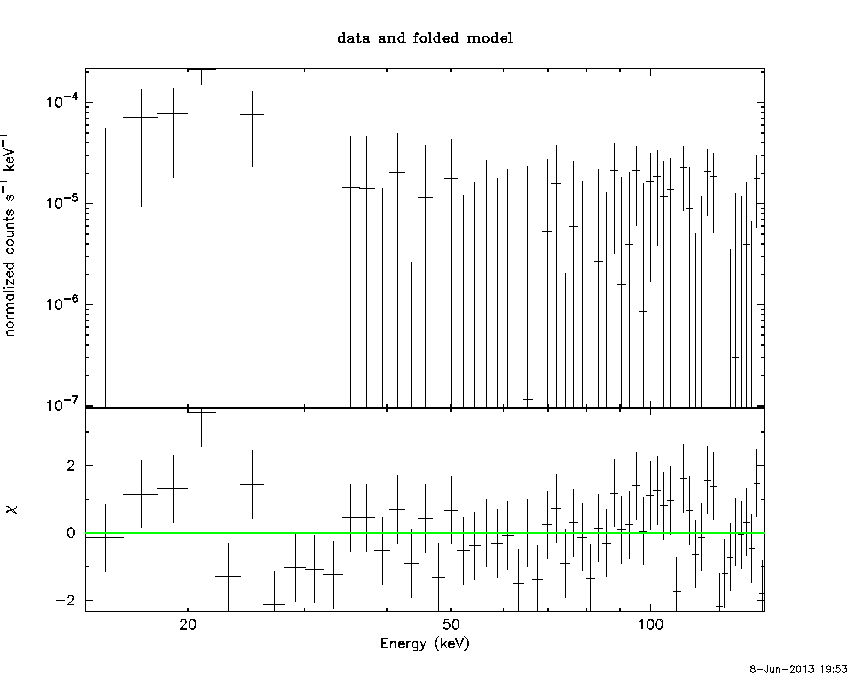
Spectral model in power-law:
------------------------------------------------------------
Parameters  : value       lower 90%   higher 90%
Photon index: 1.50000     ( -1.5   -1.5 )
Norm@50keV  : 0.0    ( 0   4.50931e-05 )
------------------------------------------------------------
#Fit statistic : Chi-Squared =          71.66 using 59 PHA bins.
# Reduced chi-squared =          1.257 for     57 degrees of freedom
# Null hypothesis probability =   9.155875e-02

Photon flux (15-150 keV)    in 768 sec: 3.37686E-03 ( -0.00337686  0.00460079 ) ph/cm2/s
Energy fluence (15-150 keV)             : 8.49976e-08 ( -8.49976e-08  1.56732e-07 ) ergs/cm2
Cutoff power-law model

Spectral model in the cutoff power-law:
------------------------------------------------------------
Parameters  : value       lower 90%   higher 90%
Photon index: 1.00000     (     )
Epeak [keV] : 50.0000      (   )
Norm@50keV  : 0.0    (     )
------------------------------------------------------------
#Fit statistic : Chi-Squared =          71.66 using 59 PHA bins.
# Reduced chi-squared =          1.280 for     56 degrees of freedom
# Null hypothesis probability =   7.751167e-02

Photon flux (15-150 keV)    in 768 sec: 5.51485E-03 ( -0.00436845  0.00445687 ) ph/cm2/s
Energy fluence (15-150 keV)             : 0 ( 0  7.34008e-07 ) ergs/cm2
Band function
Spectral model in the Band function:
------------------------------------------------------------
Parameters  : value       lower 90%   higher 90%
alpha       : 3.10527   ( 0.98395   0.98395 )
beta        : -9.37167    ( 2.5   2.5 )
Epeak [keV] : 13.7396      ( -80 -80 )
Norm@50keV   : 10.5528    ( -11.2391   695.387 )
------------------------------------------------------------
#Fit statistic : Chi-Squared =          68.35 using 59 PHA bins.
# Reduced chi-squared =          1.243 for     55 degrees of freedom
# Null hypothesis probability =   1.065919e-01

Photon flux (15-150 keV)    in 768 sec:  (    ) ph/cm2/s
Energy fluence (15-150 keV)             : 0 ( 0  0 ) ergs/cm2
S(25-50 keV) vs. S(50-100 keV) plot

S(25-50 keV)  = 1.79262e-08
S(50-100 keV) = 2.70376e-09
T90 vs. Hardness ratio plot

T90                                   = 768 sec.
Hardness ratio (energy fluence ratio) = 0.150827
Color vs. Color plot

Count Ratio  (25-50 keV) / (15-25 keV) = -0.609833
Count Ratio (50-100 keV) / (15-25 keV) = -0.252312
Mask shadow pattern

IMX = 1.716788778749617E-02, IMY = -1.543861788549412E-01
TIME vs. PHA plot around the trigger time

TIME vs. DetID plot around the trigger time

100 us light curve (15-350 keV)

Spacecraft aspect plot

Bright source in the pre-burst/pre-slew/post-slew images
Pre-burst image of 15-350 keV band
Time interval of the image:
Pre-slew background subtracted image of 15-350 keV band
Time interval of the image:
0.000000 768.000000

# RAcent  DECcent POSerr Theta    Phi  PeakCts   SNR AngSep     Name
#  [deg]    [deg]    ['] [deg]  [deg]                   [']
186.9901 -62.8711    0.0  39.3  -81.1  -5.1132  -1.3   11.0	GX 301-2
244.9781 -15.6362    0.4  30.4   46.3  36.5015  32.6    0.3	Sco X-1
256.0115 -37.8226    0.9   8.5   84.3   8.9064  13.4    1.8	4U 1700-377
256.4842 -36.4836    4.1   9.9   83.4   1.9257   2.8    4.3	GX 349+2
263.2171 -24.6667    0.0  23.0   87.1   2.0055   2.0   12.3	GX 1+4
264.7679 -44.3866  304.7   9.6  146.3   0.0299   0.0    3.9	4U 1735-44
270.2636 -25.1052   14.2  25.5  101.5   0.9590   0.8    1.9	GX 5-1
270.2892 -25.7894   29.4  24.9  102.4   0.4490   0.4    2.9	GRS 1758-258
274.0073 -14.0371   28.0  36.9   97.0   0.9206   0.4    0.1	GX 17+2
275.7404 -30.4285   16.8  24.3  118.4  -0.6732  -0.7   10.2	H1820-303
285.0990 -25.0158   10.0  34.0  122.8  -1.8973  -1.2    6.7	HT1900.1-2455
262.9674 -33.8121    3.3  14.7   99.7   2.6959   3.5    1.7	GX 354-0
255.3275 -41.7120    2.3   4.8   96.8   3.7995   5.0 ------	UNKNOWN
333.0325 -46.0895    3.9  54.2 -179.3   8.7909   2.9 ------	UNKNOWN
353.3397 -55.5473    3.8  59.6 -161.5  22.7856   3.0 ------	UNKNOWN
187.8186 -18.1471    4.5  58.7  -25.9  12.2113   2.6 ------	UNKNOWN
184.3433 -35.0264    4.0  50.7  -44.5  15.3854   2.9 ------	UNKNOWN
Post-slew image of 15-350 keV band
Time interval of the image:
933.500600 938.440000

# RAcent  DECcent POSerr Theta    Phi  PeakCts   SNR AngSep     Name
#  [deg]    [deg]    ['] [deg]  [deg]                   [']
254.4876  35.4947    6.5   7.2  -46.5   0.0454   1.8    9.3	Her X-1
268.3757  -1.5980    7.4  36.2   64.7  -0.1060  -1.5    8.7	SW J1753.5-0127
288.7872  10.8510    6.6  41.2   27.0   0.0899   1.8    5.7	GRS 1915+105
299.7976  35.2485    0.0  42.4  -13.0  -0.0287  -0.7   10.5	Cyg X-1
308.0481  40.8522    5.4  48.2  -21.9   0.1234   2.1    6.7	Cyg X-3
204.8394  -1.4774    2.3  52.7  159.9   0.7207   5.1 ------	UNKNOWN
194.0015   9.6182    2.1  55.3  178.8   0.6122   5.4 ------	UNKNOWN
252.6470  55.4766    2.1  25.8  -77.7   0.1799   5.6 ------	UNKNOWN
Plot creation:
Sat Jun  8 19:54:13 EDT 2013