Click here for the BAT GCN circular template
Image
Pre-slew 15.0-350.0 keV image (Event data)
#   RAcent    DECcent   POSerr    Theta     Phi              Peak Cts       SNR   Name
   24.5974    41.4913   0.0241    41.1765  -147.9737         1.4603147      8.020 TRIG_00557771

Foreground time interval of the image:
-75.299  21.728 (delta_t =  97.027 [sec])
Background time interval of the image:
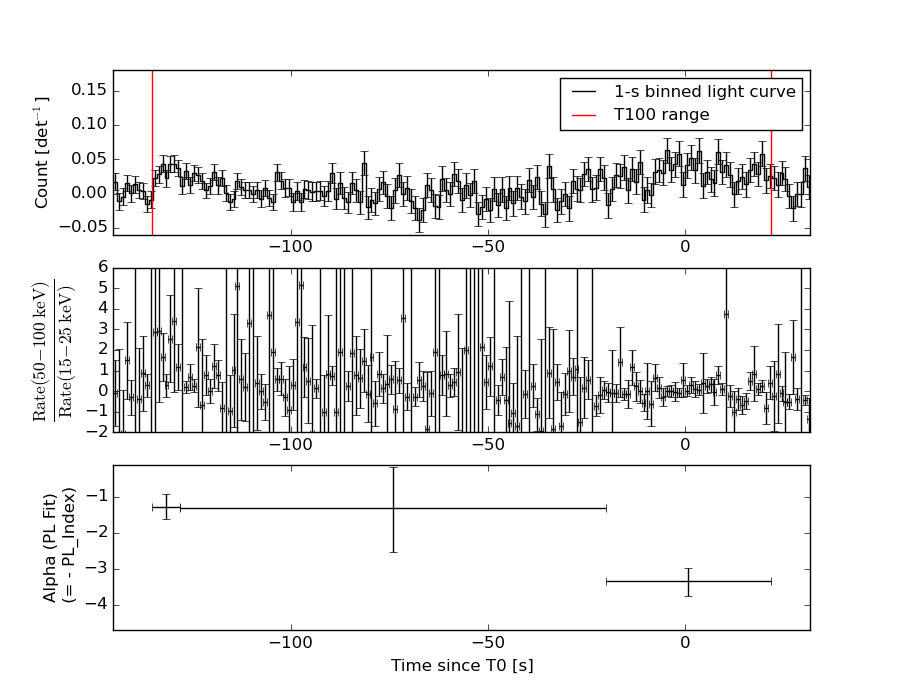
Lightcurves
Notes:
- 1) The mask-weighted light curves are using the flight position.
- 2) Multiple plots of different time binning/intervals are shown to cover all scenarios of short/long GRBs, rate/image triggers, and real/false positives.
- 3) For all the mask-weighted lightcurves, the y-axis units are counts/sec/det where a det is 0.4 x 0.4 = 0.16 sq cm.
- 4) The verticle lines correspond to following: green dotted lines are T50 interval, black dotted lines are T90 interval, blue solid line(s) is a spacecraft slew start time, and orange solid line(s) is a spacecraft slew end time.
- 5) Time of each bin is in the middle of the bin.
1 s binning
From T0-310 s to T0+310 s
From T100_start - 20 s to T100_end + 30 s
Full time interval

64 ms binning
Full time interval
From T100_start to T100_end

From T0-5 sec to T0+5 sec
16 ms binning
From T100_start-5 s to T100_start+5 s

8 ms binning
From T100_start-3 s to T100_start+3 s
2 ms binning
From T100_start-1 s to T100_start+1 s
SN=5 or 10 sec. binning (whichever binning is satisfied first)

SN=5 or 10 sec. binning (T < 200 sec)

Quad-rate summed light curves (from T0-300s to T0+1000s)
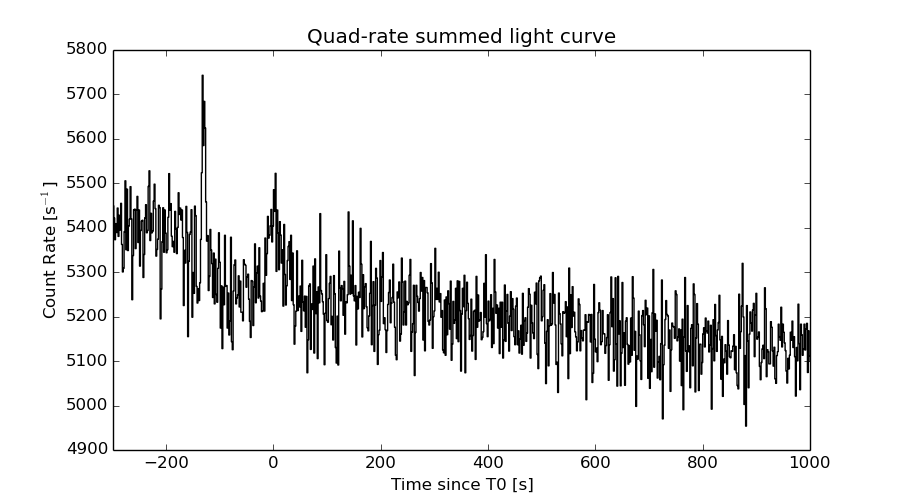
The mask-weighted light curves based on cleaned DPHs

Spectral Evolution
Spectra
Notes:
- 1) The fitting includes the systematic errors.
- 2) When the burst includes telescope slew time periods, the fitting uses an average response file made from multiple 5-s response files through out the slew time plus single time preiod for the non-slew times, and weighted by the total counts in the corresponding time period using addrmf. An average response file is needed becuase a spectral fit using the pre-slew DRM will introduce some errors in both a spectral shape and a normalization if the PHA file contains a lot of the slew/post-slew time interval.
- 3) For fits to more complicated models (e.g. a power-law over a cutoff power-law), the BAT team has decided to require a chi-square improvement of more than 6 for each extra dof.
Time averaged spectrum fit using the average DRM
Power-law model
Time interval is from -135.196 sec. to   21.728 sec.

Spectral model in power-law:
------------------------------------------------------------
Parameters  : value       lower 90%   higher 90%
Photon index: 2.62427     ( -0.359798   0.424854 )
Norm@50keV  : 5.46619E-04    ( -0.0001682   0.000169508 )
------------------------------------------------------------
#Fit statistic : Chi-Squared =          54.70 using 59 PHA bins.
# Reduced chi-squared =         0.9596 for     57 degrees of freedom
# Null hypothesis probability =   5.619548e-01

Photon flux (15-150 keV)    in 156.9 sec: 0.116105 ( -0.0183423  0.0183621 ) ph/cm2/s
Energy fluence (15-150 keV)             : 8.89556e-07 ( -1.83549e-07  1.96268e-07 ) ergs/cm2
Cutoff power-law model

Time interval is from -135.196 sec. to   21.728 sec.
Spectral model in the cutoff power-law:
------------------------------------------------------------
Parameters  : value       lower 90%   higher 90%
Photon index: 1.97253     (     )
Epeak [keV] : 1.55958      (   )
Norm@50keV  : 1.42126E-03    (     )
------------------------------------------------------------
#Fit statistic : Chi-Squared =          54.96 using 59 PHA bins.
# Reduced chi-squared =         0.9814 for     56 degrees of freedom
# Null hypothesis probability =   5.144023e-01

Photon flux (15-150 keV)    in 156.9 sec: 0.115436 ( -0.0183261  0.018609 ) ph/cm2/s
Energy fluence (15-150 keV)             : 8.68799e-07 ( -1.9775e-07  2.11868e-07 ) ergs/cm2
Band function
Time interval is from -135.196 sec. to   21.728 sec.

Spectral model in the Band function:
------------------------------------------------------------
Parameters  : value       lower 90%   higher 90%
alpha       : -3.20076   ( 3.20076   3.20076 )
beta        : -2.62427    ( -0.424756   0.359654 )
Epeak [keV] : 3.19920      ( -3.1992 -3.1992 )
Norm@50keV   : 7.42931E-02    ( -0.0228607   0.0230387 )
------------------------------------------------------------
#Fit statistic : Chi-Squared =          54.70 using 59 PHA bins.
# Reduced chi-squared =         0.9945 for     55 degrees of freedom
# Null hypothesis probability =   4.861414e-01

Photon flux (15-150 keV)    in 156.9 sec:  (    ) ph/cm2/s
Energy fluence (15-150 keV)             : 0 ( 0  0 ) ergs/cm2
Single BB
Spectral model blackbody:
------------------------------------------------------------
Parameters  : value    Lower 90%  Upper 90%
kT [keV]    : 5.63795  (-1.07826  1.47028)
R^2/D10^2   : 0.531294  (-0.333737   0.860564)
(R is the radius in km and D10 is the distance to the source in units of 10 kpc)
------------------------------------------------------------
#Fit statistic : Chi-Squared =          64.28 using 59 PHA bins.
# Reduced chi-squared =          1.128 for     57 degrees of freedom
# Null hypothesis probability =   2.368365e-01

Energy  Fluence     90% Error
[keV]   [erg/cm2]   [erg/cm2]
15- 25  3.202e-07   8.904e-08
25- 50  2.780e-07   1.054e-07
50-150  1.958e-08   1.343e-08
15-150  6.177e-07   2.147e-07
Thermal bremsstrahlung (OTTB)

Spectral model: thermal bremsstrahlung
------------------------------------------------------------
Parameters  : value         Lower 90%    Upper 90%
kT [keV]    : 27.5756       (-9.8656      16.4019)
Norm        : 0.996936       (-0.323677     0.598619)
------------------------------------------------------------
#Fit statistic : Chi-Squared =          56.19 using 59 PHA bins.
# Reduced chi-squared =         0.9857 for     57 degrees of freedom
# Null hypothesis probability =   5.055687e-01

Energy  Fluence     90% Error
[keV]   [erg/cm2]   [erg/cm2]
15- 25  3.041e-07   6.715e-08
25- 50  3.312e-07   9.037e-08
50-150  1.619e-07   9.025e-08
15-150  7.972e-07   2.024e-07
Double BB

Spectral model: bbodyrad<1> + bbodyrad<2>
------------------------------------------------------------
Parameters  : value         Lower 90%    Upper 90%
kT1 [keV]   : 3.98321        (-0.977074      1.13019)
R1^2/D10^2  : 2.06786        (-1.39917      2.99565)
kT2 [keV]   : 15.2834        (-4.8452      8.13363)
R2^2/D10^2  : 5.68442E-03    (-0.00469907   0.0219431)
------------------------------------------------------------
#Fit statistic : Chi-Squared =          51.83 using 59 PHA bins.
# Reduced chi-squared =         0.9423 for     55 degrees of freedom
# Null hypothesis probability =   5.965586e-01

Energy  Fluence     90% Error
[keV]   [erg/cm2]   [erg/cm2]
15- 25  3.326e-07   1.807e-07
25- 50  2.789e-07   1.470e-07
50-150  2.828e-07   1.818e-07
15-150  8.943e-07   4.685e-07
Peak spectrum fit
Power-law model

Time interval is from   19.056 sec. to   20.056 sec.

Spectral model in power-law:
------------------------------------------------------------
Parameters  : value       lower 90%   higher 90%
Photon index: 2.31900     ( -0.794689   1.10838 )
Norm@50keV  : 3.39942E-03    ( -0.00221256   0.00217299 )
------------------------------------------------------------
#Fit statistic : Chi-Squared =          69.76 using 59 PHA bins.
# Reduced chi-squared =          1.224 for     57 degrees of freedom
# Null hypothesis probability =   1.194955e-01

Photon flux (15-150 keV)    in 1 sec: 0.600422 ( -0.255339  0.255506 ) ph/cm2/s
Energy fluence (15-150 keV)             : 3.26027e-08 ( -1.65202e-08  1.86444e-08 ) ergs/cm2
Cutoff power-law model

Time interval is from   19.056 sec. to   20.056 sec.
Spectral model in the cutoff power-law:
------------------------------------------------------------
Parameters  : value       lower 90%   higher 90%
Photon index: 1.92577     (     )
Epeak [keV] : 6.96407      (   )
Norm@50keV  : 6.02423E-03    (     )
------------------------------------------------------------
#Fit statistic : Chi-Squared =          69.70 using 59 PHA bins.
# Reduced chi-squared =          1.245 for     56 degrees of freedom
# Null hypothesis probability =   1.032184e-01

Photon flux (15-150 keV)    in 1 sec: 0.596198 ( -0.254827  0.256544 ) ph/cm2/s
Energy fluence (15-150 keV)             : 3.13445e-08 ( -1.96338e-08  1.96101e-08 ) ergs/cm2
Band function
Time interval is from   19.056 sec. to   20.056 sec.

Spectral model in the Band function:
------------------------------------------------------------
Parameters  : value       lower 90%   higher 90%
alpha       : 4.93886   ( -6.92883   -4.93886 )
beta        : -2.80335    ( 2.80335   1.12971 )
Epeak [keV] : 22.3551      ( -22.3551 9.62031 )
Norm@50keV   : 1534.69    ( -635.916   1.75537e+07 )
------------------------------------------------------------
#Fit statistic : Chi-Squared =          69.02 using 59 PHA bins.
# Reduced chi-squared =          1.255 for     55 degrees of freedom
# Null hypothesis probability =   9.686172e-02

Photon flux (15-150 keV)    in 1 sec: 0.599269 0.594559 (    ) ph/cm2/s
Energy fluence (15-150 keV)             : 0 ( 0  0 ) ergs/cm2
Single BB

Spectral model blackbody:
------------------------------------------------------------
Parameters  : value    Lower 90%  Upper 90%
kT [keV]    : 6.33064  (-2.35356  4.61436)
R^2/D10^2   : 1.73311  (-1.73297   11.5138)
(R is the radius in km and D10 is the distance to the source in units of 10 kpc)
------------------------------------------------------------
#Fit statistic : Chi-Squared =          70.40 using 59 PHA bins.
# Reduced chi-squared =          1.235 for     57 degrees of freedom
# Null hypothesis probability =   1.094378e-01

Energy  Fluence     90% Error
[keV]   [erg/cm2]   [erg/cm2]
15- 25  9.929e-09   6.300e-09
25- 50  1.110e-08   7.660e-09
50-150  1.261e-09   1.181e-09
15-150  2.229e-08   1.409e-08
Thermal bremsstrahlung (OTTB)
Spectral model: thermal bremsstrahlung
------------------------------------------------------------
Parameters  : value         Lower 90%    Upper 90%
kT [keV]    : 37.8253       (-37.8452      -37.8452)
Norm        : 4.05489       (-2.37944     9.11459)
------------------------------------------------------------
#Fit statistic : Chi-Squared =          69.80 using 59 PHA bins.
# Reduced chi-squared =          1.225 for     57 degrees of freedom
# Null hypothesis probability =   1.188064e-01

Energy  Fluence     90% Error
[keV]   [erg/cm2]   [erg/cm2]
15- 25  9.130e-09   5.855e-09
25- 50  1.172e-08   7.670e-09
50-150  8.518e-09   7.350e-09
15-150  2.937e-08   1.981e-08
Double BB
Spectral model: bbodyrad<1> + bbodyrad<2>
------------------------------------------------------------
Parameters  : value         Lower 90%    Upper 90%
kT1 [keV]   : 5.26521        (-5.21285      3.65759)
R1^2/D10^2  : 3.26224        (-2.07426      -3.33023)
kT2 [keV]   : 24.2187        (-23.3002      -23.3002)
R2^2/D10^2  : 5.35342E-03    (-0.0058433   5.79732)
------------------------------------------------------------
#Fit statistic : Chi-Squared =          68.74 using 59 PHA bins.
# Reduced chi-squared =          1.250 for     55 degrees of freedom
# Null hypothesis probability =   1.008694e-01

Energy  Fluence     90% Error
[keV]   [erg/cm2]   [erg/cm2]
15- 25  1.027e-08   6.395e-09
25- 50  1.029e-08   5.830e-09
50-150  1.389e-08   1.026e-08
15-150  3.444e-08   1.859e-08
Pre-slew spectrum (Pre-slew PHA with pre-slew DRM)
Power-law model

Spectral model in power-law:
------------------------------------------------------------
Parameters  : value       lower 90%   higher 90%
Photon index: 3.05279     ( -0.479483   0.60053 )
Norm@50keV  : 4.80416E-04    ( -0.000209089   0.000232423 )
------------------------------------------------------------
#Fit statistic : Chi-Squared =          54.59 using 59 PHA bins.
# Reduced chi-squared =         0.9576 for     57 degrees of freedom
# Null hypothesis probability =   5.661790e-01

Photon flux (15-150 keV)    in 97.03 sec: 0.137323 ( -0.0263465  0.0264226 ) ph/cm2/s
Energy fluence (15-150 keV)             : 5.7413e-07 ( -1.40786e-07  1.54951e-07 ) ergs/cm2
Cutoff power-law model

Spectral model in the cutoff power-law:
------------------------------------------------------------
Parameters  : value       lower 90%   higher 90%
Photon index: 1.93993     (     )
Epeak [keV] : 1.56366      (   )
Norm@50keV  : 2.95034E-03    (     )
------------------------------------------------------------
#Fit statistic : Chi-Squared =          54.22 using 59 PHA bins.
# Reduced chi-squared =         0.9683 for     56 degrees of freedom
# Null hypothesis probability =   5.423380e-01

Photon flux (15-150 keV)    in 97.03 sec: 0.135849 ( -0.026123  0.025663 ) ph/cm2/s
Energy fluence (15-150 keV)             : 5.40594e-07 ( -1.40078e-07  1.74777e-07 ) ergs/cm2
Band function
Spectral model in the Band function:
------------------------------------------------------------
Parameters  : value       lower 90%   higher 90%
alpha       : -1.96023   ( -4.68664   1.96241 )
beta        : -9.37167    ( 9.37167   19.3716 )
Epeak [keV] : 1.06550      ( -0.902336 21.6603 )
Norm@50keV   : 2.82779E-03    ( -0.00121505   0.0022592 )
------------------------------------------------------------
#Fit statistic : Chi-Squared =          54.22 using 59 PHA bins.
# Reduced chi-squared =         0.9858 for     55 degrees of freedom
# Null hypothesis probability =   5.045175e-01

Photon flux (15-150 keV)    in 97.03 sec:  (    ) ph/cm2/s
Energy fluence (15-150 keV)             : 0 ( 0  0 ) ergs/cm2
S(25-50 keV) vs. S(50-100 keV) plot
S(25-50 keV)  = 2.98e-07
S(50-100 keV) = 1.93e-07
T90 vs. Hardness ratio plot
T90                                   = 151.851999938488 sec.
Hardness ratio (energy fluence ratio) = 0.647651
Color vs. Color plot
Count Ratio  (25-50 keV) / (15-25 keV) = 0.561746
Count Ratio (50-100 keV) / (15-25 keV) = 0.392896
Mask shadow pattern

IMX = -7.415839185258359E-01, IMY = 4.638660711682224E-01
TIME vs. PHA plot around the trigger time

TIME vs. DetID plot around the trigger time

100 us light curve (15-350 keV)

Spacecraft aspect plot
Bright source in the pre-burst/pre-slew/post-slew images
Pre-burst image of 15-350 keV band
Time interval of the image:
Pre-slew background subtracted image of 15-350 keV band
Time interval of the image:
-75.299410 21.728000

# RAcent  DECcent POSerr Theta    Phi  PeakCts   SNR AngSep     Name
#  [deg]    [deg]    ['] [deg]  [deg]                   [']
  0.1490 -12.2984    2.3  33.6  105.7   1.2799   5.0 ------	UNKNOWN
 24.5974  41.4913    1.4  41.2 -148.0   1.4605   8.0 ------	UNKNOWN
Post-slew image of 15-350 keV band
Time interval of the image:
147.300600 963.134100
1225.000000 1425.172400

# RAcent  DECcent POSerr Theta    Phi  PeakCts   SNR AngSep     Name
#  [deg]    [deg]    ['] [deg]  [deg]                   [']
348.8138   6.8736    2.6  46.9   46.7  10.5199   4.4 ------	UNKNOWN
 13.5966  31.0044    2.8  13.7   37.6   2.5578   4.1 ------	UNKNOWN
 54.2219  58.2103    2.8  25.1 -147.8   2.3880   4.1 ------	UNKNOWN
 60.3834  40.6244    2.9  26.9 -106.1   2.9614   4.0 ------	UNKNOWN
 36.7594 -12.8338    3.5  55.5  -20.4   7.3078   3.3 ------	UNKNOWN
131.6018  66.3973    4.3  58.7 -159.3  14.0384   2.7 ------	UNKNOWN
 42.2260 -14.9408    3.0  58.7  -26.0  14.6813   3.9 ------	UNKNOWN
 53.4370  -1.8794    7.2  50.7  -44.5   5.8768   1.6 ------	UNKNOWN
101.1388  52.0976    3.8  51.0 -135.6  10.8557   3.1 ------	UNKNOWN
 74.8109  31.0607    5.1  41.3  -97.9   9.1616   2.3 ------	UNKNOWN
Plot creation:
Sat May 30 16:30:14 EDT 2015