Special notes of this burst
Image
Pre-slew 15.0-350.0 keV image (Event data)
#   RAcent    DECcent   POSerr    Theta     Phi              Peak Cts       SNR   Name
  259.7729    16.7248   0.0164    34.4953    40.9573         0.5544059     11.774 TRIG_00557976

Foreground time interval of the image:
 -0.832   3.168 (delta_t =   4.000 [sec])
Background time interval of the image:
-179.832  -0.832 (delta_t = 179.000 [sec])
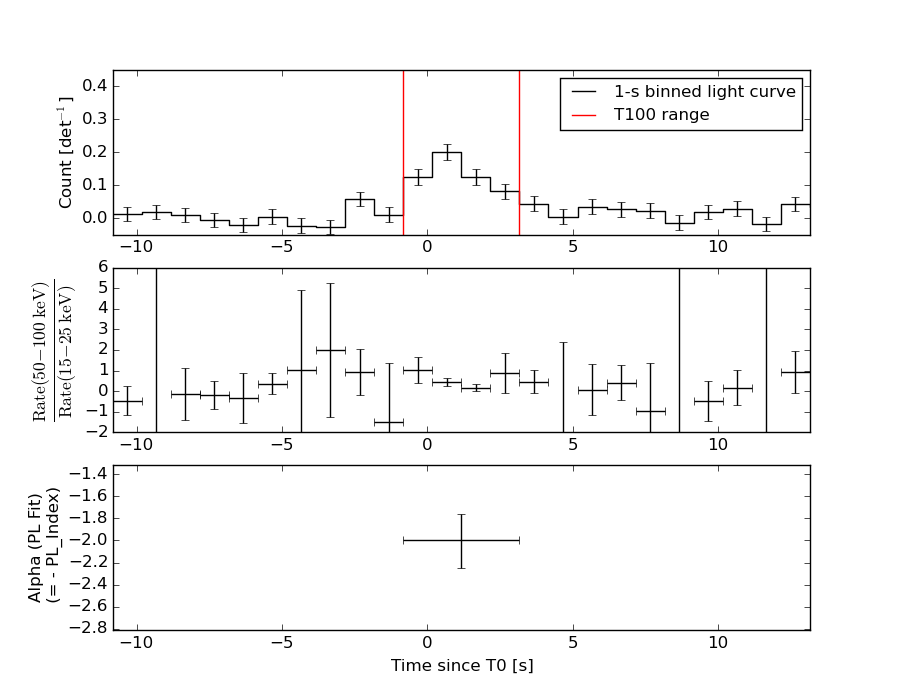
Lightcurves
Notes:
- 1) The mask-weighted light curves are using the flight position.
- 2) Multiple plots of different time binning/intervals are shown to cover all scenarios of short/long GRBs, rate/image triggers, and real/false positives.
- 3) For all the mask-weighted lightcurves, the y-axis units are counts/sec/det where a det is 0.4 x 0.4 = 0.16 sq cm.
- 4) The verticle lines correspond to following: green dotted lines are T50 interval, black dotted lines are T90 interval, blue solid line(s) is a spacecraft slew start time, and orange solid line(s) is a spacecraft slew end time.
- 5) Time of each bin is in the middle of the bin.
1 s binning
From T0-310 s to T0+310 s

From T100_start - 20 s to T100_end + 30 s
Full time interval
64 ms binning
Full time interval

From T100_start to T100_end

From T0-5 sec to T0+5 sec

16 ms binning
From T100_start-5 s to T100_start+5 s

8 ms binning
From T100_start-3 s to T100_start+3 s

2 ms binning
From T100_start-1 s to T100_start+1 s

SN=5 or 10 sec. binning (whichever binning is satisfied first)
SN=5 or 10 sec. binning (T < 200 sec)

Quad-rate summed light curves (from T0-300s to T0+1000s)
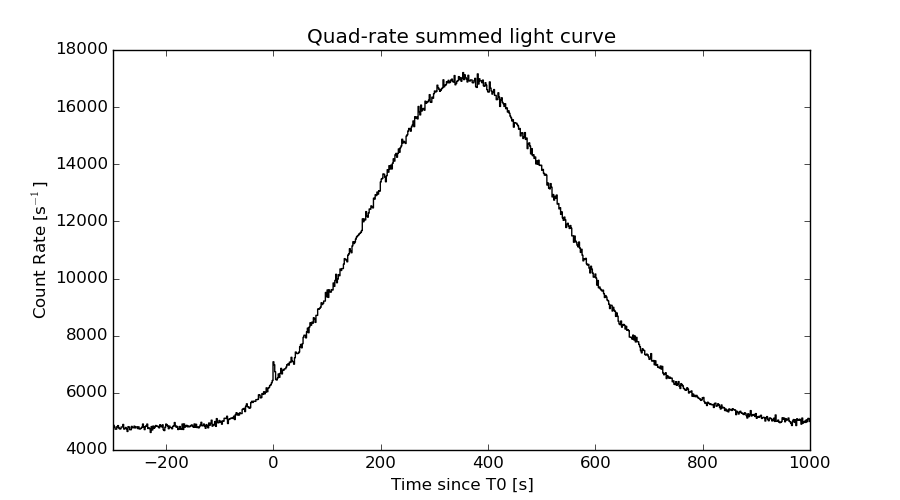
The mask-weighted light curves based on cleaned DPHs

Spectral Evolution
Spectra
Notes:
- 1) The fitting includes the systematic errors.
- 2) When the burst includes telescope slew time periods, the fitting uses an average response file made from multiple 5-s response files through out the slew time plus single time preiod for the non-slew times, and weighted by the total counts in the corresponding time period using addrmf. An average response file is needed becuase a spectral fit using the pre-slew DRM will introduce some errors in both a spectral shape and a normalization if the PHA file contains a lot of the slew/post-slew time interval.
- 3) For fits to more complicated models (e.g. a power-law over a cutoff power-law), the BAT team has decided to require a chi-square improvement of more than 6 for each extra dof.
Time averaged spectrum fit using the average DRM
Power-law model

Time interval is from   -0.832 sec. to    3.168 sec.

Spectral model in power-law:
------------------------------------------------------------
Parameters  : value       lower 90%   higher 90%
Photon index: 1.99473     ( -0.236965   0.253273 )
Norm@50keV  : 7.61559E-03    ( -0.00140924   0.00138772 )
------------------------------------------------------------
#Fit statistic : Chi-Squared =          71.92 using 59 PHA bins.
# Reduced chi-squared =          1.262 for     57 degrees of freedom
# Null hypothesis probability =   8.805556e-02

Photon flux (15-150 keV)    in 4 sec: 1.13957 ( -0.164662  0.164666 ) ph/cm2/s
Energy fluence (15-150 keV)             : 2.80783e-07 ( -4.86044e-08  5.029e-08 ) ergs/cm2
Cutoff power-law model

Time interval is from   -0.832 sec. to    3.168 sec.
Spectral model in the cutoff power-law:
------------------------------------------------------------
Parameters  : value       lower 90%   higher 90%
Photon index: -0.836898     ( -2.17519   1.54275 )
Epeak [keV] : 37.2611      ( -5.1782 6.86581 )
Norm@50keV  : 0.419942    ( -0.46568   10.3805 )
------------------------------------------------------------
#Fit statistic : Chi-Squared =          59.32 using 59 PHA bins.
# Reduced chi-squared =          1.059 for     56 degrees of freedom
# Null hypothesis probability =   3.554439e-01

Photon flux (15-150 keV)    in 4 sec: 1.08502 ( -0.160174  0.16155 ) ph/cm2/s
Energy fluence (15-150 keV)             : 2.29607e-07 ( -3.97488e-08  4.54864e-08 ) ergs/cm2
Band function

Time interval is from   -0.832 sec. to    3.168 sec.

Spectral model in the Band function:
------------------------------------------------------------
Parameters  : value       lower 90%   higher 90%
alpha       : 3.63286   ( -4.49589   -3.86615 )
beta        : -2.94512    ( 2.9298   0.648126 )
Epeak [keV] : 31.1386      ( -5.11484 6.10107 )
Norm@50keV   : 45.3855    ( -45.1381   145.201 )
------------------------------------------------------------
#Fit statistic : Chi-Squared =          59.17 using 59 PHA bins.
# Reduced chi-squared =          1.076 for     55 degrees of freedom
# Null hypothesis probability =   3.257755e-01

Photon flux (15-150 keV)    in 4 sec:  (    ) ph/cm2/s
Energy fluence (15-150 keV)             : 2.3454e-07 ( 0  0 ) ergs/cm2
Single BB

Spectral model blackbody:
------------------------------------------------------------
Parameters  : value    Lower 90%  Upper 90%
kT [keV]    : 9.44921  (-1.20535  1.37772)
R^2/D10^2   : 0.722538  (-0.29745   0.497439)
(R is the radius in km and D10 is the distance to the source in units of 10 kpc)
------------------------------------------------------------
#Fit statistic : Chi-Squared =          59.81 using 59 PHA bins.
# Reduced chi-squared =          1.049 for     57 degrees of freedom
# Null hypothesis probability =   3.740298e-01

Energy  Fluence     90% Error
[keV]   [erg/cm2]   [erg/cm2]
15- 25  5.142e-08   1.165e-08
25- 50  1.177e-07   2.420e-08
50-150  5.203e-08   1.904e-08
15-150  2.212e-07   4.032e-08
Thermal bremsstrahlung (OTTB)

Spectral model: thermal bremsstrahlung
------------------------------------------------------------
Parameters  : value         Lower 90%    Upper 90%
kT [keV]    : 57.2146       (-17.6182      30.9809)
Norm        : 6.27654       (-1.28416     1.56213)
------------------------------------------------------------
#Fit statistic : Chi-Squared =          65.44 using 59 PHA bins.
# Reduced chi-squared =          1.148 for     57 degrees of freedom
# Null hypothesis probability =   2.072253e-01

Energy  Fluence     90% Error
[keV]   [erg/cm2]   [erg/cm2]
15- 25  6.259e-08   1.148e-08
25- 50  9.385e-08   1.540e-08
50-150  1.026e-07   4.086e-08
15-150  2.590e-07   5.870e-08
Double BB

------------------------------------------------------------
Parameters  : value         Lower 90%    Upper 90%
kT1 [keV]   : 7.46793        (-6.99067      -6.99067)
R1^2/D10^2  : 1.07094        (-1.08785      -1.08785)
kT2 [keV]   : 13.1766        (-12.2626      -12.2626)
R2^2/D10^2  : 9.53922E-02    (   )
------------------------------------------------------------
#Fit statistic : Chi-Squared =          59.11 using 59 PHA bins.
#Fit statistic : Chi-Squared =          59.08 using 59 PHA bins.
# Reduced chi-squared =          1.075 for     55 degrees of freedom
# Reduced chi-squared =          1.074 for     55 degrees of freedom
# Null hypothesis probability =   3.279390e-01
# Null hypothesis probability =   3.288651e-01

Energy  Fluence     90% Error
[keV]   [erg/cm2]   [erg/cm2]
15- 25  5.488e-08   7.596e-08
25- 50  1.124e-07   2.664e-07
50-150  6.503e-08   4.188e-07
15-150  2.324e-07   7.116e-07
Peak spectrum fit
Power-law model

Time interval is from    0.168 sec. to    1.168 sec.

Spectral model in power-law:
------------------------------------------------------------
Parameters  : value       lower 90%   higher 90%
Photon index: 2.07696     ( -0.322966   0.356096 )
Norm@50keV  : 1.04214E-02    ( -0.00279591   0.00277846 )
------------------------------------------------------------
#Fit statistic : Chi-Squared =          76.91 using 59 PHA bins.
# Reduced chi-squared =          1.349 for     57 degrees of freedom
# Null hypothesis probability =   4.058079e-02

Photon flux (15-150 keV)    in 1 sec: 1.62120 ( -0.337624  0.337681 ) ph/cm2/s
Energy fluence (15-150 keV)             : 9.66809e-08 ( -2.36123e-08  2.47696e-08 ) ergs/cm2
Cutoff power-law model

Time interval is from    0.168 sec. to    1.168 sec.
Spectral model in the cutoff power-law:
------------------------------------------------------------
Parameters  : value       lower 90%   higher 90%
Photon index: -3.99976     ( 2.95066   2.74743 )
Epeak [keV] : 31.6849      ( -4.46784 5.96658 )
Norm@50keV  : 116.298    (     )
------------------------------------------------------------
#Fit statistic : Chi-Squared =          64.21 using 59 PHA bins.
# Reduced chi-squared =          1.147 for     56 degrees of freedom
# Null hypothesis probability =   2.109328e-01

Photon flux (15-150 keV)    in 1 sec: 1.56090 ( -0.31997  0.32348 ) ph/cm2/s
Energy fluence (15-150 keV)             : 7.34135e-08 ( -1.67487e-08  1.94679e-08 ) ergs/cm2
Band function

Time interval is from    0.168 sec. to    1.168 sec.

Spectral model in the Band function:
------------------------------------------------------------
Parameters  : value       lower 90%   higher 90%
alpha       : 5.00000   ( -3.77566   -5 )
beta        : -3.64772    ( 3.64819   1.0217 )
Epeak [keV] : 29.9027      ( -4.45532 4.17929 )
Norm@50keV   : 747.514    ( -140.406   1359.73 )
------------------------------------------------------------
#Fit statistic : Chi-Squared =          62.60 using 59 PHA bins.
# Reduced chi-squared =          1.138 for     55 degrees of freedom
# Null hypothesis probability =   2.245225e-01

Photon flux (15-150 keV)    in 1 sec:  (    ) ph/cm2/s
Energy fluence (15-150 keV)             : 8.383e-08 ( -8.3823e-08  -2.18003e-08 ) ergs/cm2
Single BB

Spectral model blackbody:
------------------------------------------------------------
Parameters  : value    Lower 90%  Upper 90%
kT [keV]    : 8.46696  (-1.33212  1.62548)
R^2/D10^2   : 1.64100  (-0.832305   1.58054)
(R is the radius in km and D10 is the distance to the source in units of 10 kpc)
------------------------------------------------------------
#Fit statistic : Chi-Squared =          65.16 using 59 PHA bins.
# Reduced chi-squared =          1.143 for     57 degrees of freedom
# Null hypothesis probability =   2.141915e-01

Energy  Fluence     90% Error
[keV]   [erg/cm2]   [erg/cm2]
15- 25  2.212e-08   7.715e-09
25- 50  4.262e-08   1.377e-08
50-150  1.344e-08   7.517e-09
15-150  7.817e-08   2.673e-08
Thermal bremsstrahlung (OTTB)

Spectral model: thermal bremsstrahlung
------------------------------------------------------------
Parameters  : value         Lower 90%    Upper 90%
kT [keV]    : 47.1994       (-17.0113      35.297)
Norm        : 9.92301       (-2.79444     3.87458)
------------------------------------------------------------
#Fit statistic : Chi-Squared =          71.97 using 59 PHA bins.
# Reduced chi-squared =          1.263 for     57 degrees of freedom
# Null hypothesis probability =   8.746452e-02

Energy  Fluence     90% Error
[keV]   [erg/cm2]   [erg/cm2]
15- 25  2.393e-08   6.790e-09
25- 50  3.365e-08   1.085e-08
50-150  3.090e-08   1.774e-08
15-150  8.848e-08   3.129e-08
Double BB

------------------------------------------------------------
Parameters  : value         Lower 90%    Upper 90%
kT1 [keV]   : 199.990        (      )
R1^2/D10^2  : 8.61509E-06        (-8.61509e-06      -8.61509e-06)
kT2 [keV]   : 8.42556        (-1.38542      1.65422)
R2^2/D10^2  : 1.66675    (-0.853426   1.54957)
------------------------------------------------------------
#Fit statistic : Chi-Squared =          65.16 using 59 PHA bins.
#Fit statistic : Chi-Squared =          65.14 using 59 PHA bins.
# Reduced chi-squared =          1.185 for     55 degrees of freedom
# Reduced chi-squared =          1.184 for     55 degrees of freedom
# Null hypothesis probability =   1.642591e-01
# Null hypothesis probability =   1.645898e-01

Energy  Fluence     90% Error
[keV]   [erg/cm2]   [erg/cm2]
15- 25  2.212e-08   3.911e-02
25- 50  4.262e-08   3.021e-01
50-150  1.345e-08   7.095e+00
15-150  7.819e-08   8.840e+00
Pre-slew spectrum (Pre-slew PHA with pre-slew DRM)
Power-law model

Spectral model in power-law:
------------------------------------------------------------
Parameters  : value       lower 90%   higher 90%
Photon index: 1.99473     ( -0.236965   0.253273 )
Norm@50keV  : 7.61559E-03    ( -0.00140924   0.00138772 )
------------------------------------------------------------
#Fit statistic : Chi-Squared =          71.92 using 59 PHA bins.
# Reduced chi-squared =          1.262 for     57 degrees of freedom
# Null hypothesis probability =   8.805556e-02

Photon flux (15-150 keV)    in 4 sec: 1.13957 ( -0.164662  0.164666 ) ph/cm2/s
Energy fluence (15-150 keV)             : 2.80783e-07 ( -4.86044e-08  5.029e-08 ) ergs/cm2
Cutoff power-law model

Spectral model in the cutoff power-law:
------------------------------------------------------------
Parameters  : value       lower 90%   higher 90%
Photon index: -0.836898     ( -2.17519   1.54275 )
Epeak [keV] : 37.2611      ( -5.1782 6.86581 )
Norm@50keV  : 0.419942    ( -0.46568   10.3805 )
------------------------------------------------------------
#Fit statistic : Chi-Squared =          59.32 using 59 PHA bins.
# Reduced chi-squared =          1.059 for     56 degrees of freedom
# Null hypothesis probability =   3.554439e-01

Photon flux (15-150 keV)    in 4 sec: 1.08502 ( -0.160174  0.16155 ) ph/cm2/s
Energy fluence (15-150 keV)             : 2.29607e-07 ( -3.97488e-08  4.54864e-08 ) ergs/cm2
Band function

Spectral model in the Band function:
------------------------------------------------------------
Parameters  : value       lower 90%   higher 90%
alpha       : 3.63286   ( -4.49589   -3.86615 )
beta        : -2.94512    ( 2.9298   0.648126 )
Epeak [keV] : 31.1386      ( -5.11484 6.10107 )
Norm@50keV   : 45.3855    ( -45.1381   145.197 )
------------------------------------------------------------
#Fit statistic : Chi-Squared =          59.17 using 59 PHA bins.
# Reduced chi-squared =          1.076 for     55 degrees of freedom
# Null hypothesis probability =   3.257755e-01

Photon flux (15-150 keV)    in 4 sec:  (    ) ph/cm2/s
Energy fluence (15-150 keV)             : 2.3454e-07 ( 0  0 ) ergs/cm2
S(25-50 keV) vs. S(50-100 keV) plot

S(25-50 keV)  = 8.44e-08
S(50-100 keV) = 8.47e-08
T90 vs. Hardness ratio plot

T90                                   = 4 sec.
Hardness ratio (energy fluence ratio) = 1.00355
Color vs. Color plot

Count Ratio  (25-50 keV) / (15-25 keV) = 1.34979
Count Ratio (50-100 keV) / (15-25 keV) = 0.478446
Mask shadow pattern

IMX = 5.189412508516038E-01, IMY = -4.504306793227182E-01
TIME vs. PHA plot around the trigger time
TIME vs. DetID plot around the trigger time
100 us light curve (15-350 keV)

Spacecraft aspect plot

Bright source in the pre-burst/pre-slew/post-slew images
Pre-burst image of 15-350 keV band
Time interval of the image:
-179.832000 -0.832000

# RAcent  DECcent POSerr Theta    Phi  PeakCts   SNR AngSep     Name
#  [deg]    [deg]    ['] [deg]  [deg]                   [']
254.4720  35.2940    8.5  26.4    6.0  -0.2821  -1.4    3.0	Her X-1
218.3437  -2.1840    3.1  30.9  131.0   1.0638   3.7 ------	UNKNOWN
180.0453  -0.6174    2.7  51.3 -177.2   2.1313   4.3 ------	UNKNOWN
169.3428  36.1579    2.4  46.7 -126.3   4.0612   4.8 ------	UNKNOWN
Pre-slew background subtracted image of 15-350 keV band
Time interval of the image:
-0.832000 3.168000

# RAcent  DECcent POSerr Theta    Phi  PeakCts   SNR AngSep     Name
#  [deg]    [deg]    ['] [deg]  [deg]                   [']
254.5480  35.4024    3.0  26.5    5.8   0.1172   3.9    5.7	Her X-1
259.7729  16.7247    1.0  34.5   41.0   0.5548  11.7 ------	UNKNOWN
248.3897  23.2731    2.2  22.1   36.6   0.1603   5.3 ------	UNKNOWN
288.2433  35.3646    2.0  53.8    4.3   0.6206   5.8 ------	UNKNOWN
Post-slew image of 15-350 keV band
Time interval of the image:
73.468590 662.268000
840.168000 902.318400

# RAcent  DECcent POSerr Theta    Phi  PeakCts   SNR AngSep     Name
#  [deg]    [deg]    ['] [deg]  [deg]                   [']
244.9039 -15.6125    3.7  35.5  116.5   0.7780   3.2    4.7	Sco X-1
254.3262  35.4844   23.1  19.4 -102.3   0.0548   0.5   10.7	Her X-1
268.4811  -1.5134    4.3  20.1   65.3   0.3182   2.7    7.7	SW J1753.5-0127
273.9976 -14.0914    5.4  33.8   66.0   0.4781   2.1    3.3	GX 17+2
288.7487  10.9449    4.6  28.7    9.1   0.2800   2.5    2.9	GRS 1915+105
299.6669  35.3128    4.4  40.0  -34.3   0.4073   2.6    7.7	Cyg X-1
308.2251  40.7416    0.0  48.0  -39.0  -0.4817  -1.7   13.7	Cyg X-3
316.2997  10.2797    2.3  55.1    0.3   2.1394   5.1 ------	UNKNOWN
248.6613  19.6394    2.3  11.0 -161.6   0.4501   5.0 ------	UNKNOWN
197.0547  25.0508    3.9  58.7 -159.2   1.8643   3.0 ------	UNKNOWN
271.1049  47.8037    3.0  32.4  -74.5   0.6352   3.8 ------	UNKNOWN
306.9921  47.5149    2.1  49.3  -47.9   2.7193   5.5 ------	UNKNOWN
Plot creation:
Wed Jun 10 16:54:48 EDT 2015