Special notes of this burst
Image
Pre-slew 15.0-350.0 keV image (Event data)
#   RAcent    DECcent   POSerr    Theta     Phi              Peak Cts       SNR   Name
  274.9660   -68.1617   0.0294    39.4425   -12.8425         1.1509258      6.534 TRIG_00558271

Foreground time interval of the image:
 25.572  73.301 (delta_t =  47.729 [sec])
Background time interval of the image:
-13.299  25.572 (delta_t =  38.871 [sec])
Lightcurves
Notes:
- 1) The mask-weighted light curves are using the flight position.
- 2) Multiple plots of different time binning/intervals are shown to cover all scenarios of short/long GRBs, rate/image triggers, and real/false positives.
- 3) For all the mask-weighted lightcurves, the y-axis units are counts/sec/det where a det is 0.4 x 0.4 = 0.16 sq cm.
- 4) The verticle lines correspond to following: green dotted lines are T50 interval, black dotted lines are T90 interval, blue solid line(s) is a spacecraft slew start time, and orange solid line(s) is a spacecraft slew end time.
- 5) Time of each bin is in the middle of the bin.
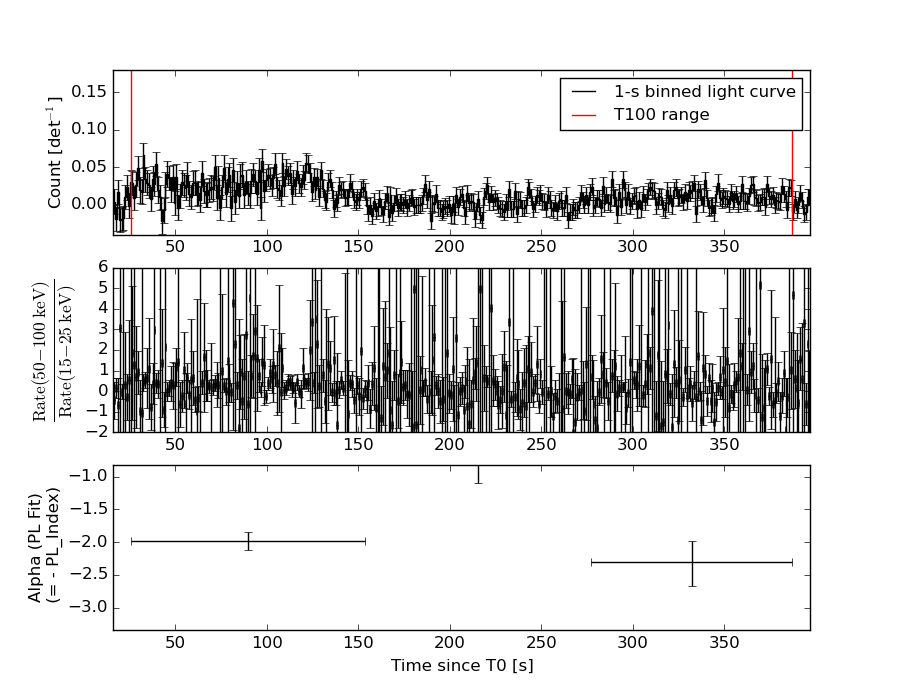
1 s binning
From T0-310 s to T0+310 s

From T100_start - 20 s to T100_end + 30 s

Full time interval

64 ms binning
Full time interval
From T100_start to T100_end

From T0-5 sec to T0+5 sec

16 ms binning
From T100_start-5 s to T100_start+5 s
8 ms binning
From T100_start-3 s to T100_start+3 s

2 ms binning
From T100_start-1 s to T100_start+1 s
SN=5 or 10 sec. binning (whichever binning is satisfied first)
SN=5 or 10 sec. binning (T < 200 sec)

Quad-rate summed light curves (from T0-300s to T0+1000s)
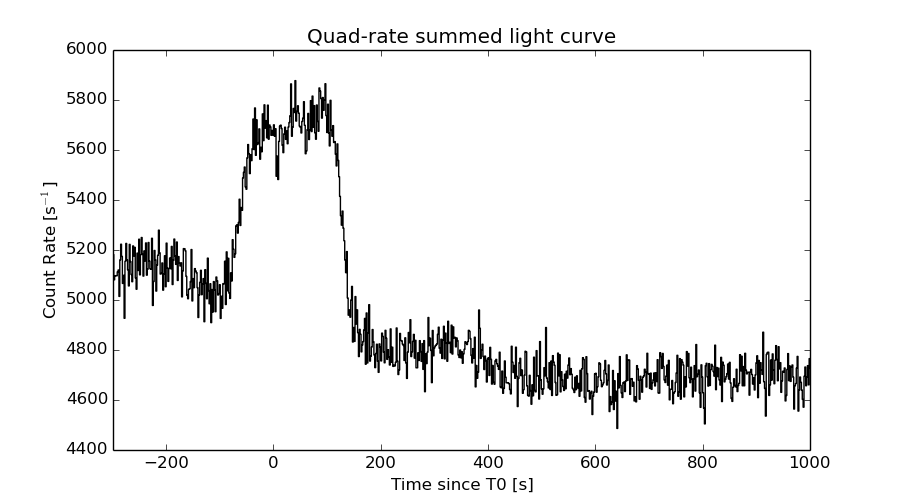
The mask-weighted light curves based on cleaned DPHs

Spectral Evolution
Spectra
Notes:
- 1) The fitting includes the systematic errors.
- 2) When the burst includes telescope slew time periods, the fitting uses an average response file made from multiple 5-s response files through out the slew time plus single time preiod for the non-slew times, and weighted by the total counts in the corresponding time period using addrmf. An average response file is needed becuase a spectral fit using the pre-slew DRM will introduce some errors in both a spectral shape and a normalization if the PHA file contains a lot of the slew/post-slew time interval.
- 3) For fits to more complicated models (e.g. a power-law over a cutoff power-law), the BAT team has decided to require a chi-square improvement of more than 6 for each extra dof.
Time averaged spectrum fit using the average DRM
Power-law model

Time interval is from   25.572 sec. to  386.864 sec.

Spectral model in power-law:
------------------------------------------------------------
Parameters  : value       lower 90%   higher 90%
Photon index: 2.09102     ( -0.153755   0.160297 )
Norm@50keV  : 6.83922E-04    ( -7.53294e-05   7.43192e-05 )
------------------------------------------------------------
#Fit statistic : Chi-Squared =          70.31 using 59 PHA bins.
# Reduced chi-squared =          1.233 for     57 degrees of freedom
# Null hypothesis probability =   1.108433e-01

Photon flux (15-150 keV)    in 361.3 sec: 0.107124 ( -0.00917545  0.00917858 ) ph/cm2/s
Energy fluence (15-150 keV)             : 2.29386e-06 ( -2.29431e-07  2.3341e-07 ) ergs/cm2
Cutoff power-law model

Time interval is from   25.572 sec. to  386.864 sec.
Spectral model in the cutoff power-law:
------------------------------------------------------------
Parameters  : value       lower 90%   higher 90%
Photon index: 0.717651     ( -1.03428   0.823106 )
Epeak [keV] : 35.4842      ( -7.27756 6.60606 )
Norm@50keV  : 4.69544E-03    ( -0.00469716   0.0161482 )
------------------------------------------------------------
#Fit statistic : Chi-Squared =          61.08 using 59 PHA bins.
# Reduced chi-squared =          1.091 for     56 degrees of freedom
# Null hypothesis probability =   2.985053e-01

Photon flux (15-150 keV)    in 361.3 sec: 0.102422 ( -0.0094437  0.009485 ) ph/cm2/s
Energy fluence (15-150 keV)             : 1.99753e-06 ( -2.42783e-07  2.68789e-07 ) ergs/cm2
Band function

Time interval is from   25.572 sec. to  386.864 sec.

Spectral model in the Band function:
------------------------------------------------------------
Parameters  : value       lower 90%   higher 90%
alpha       : 4.15254   ( -4.74275   -4.15254 )
beta        : -2.49898    ( -0.40906   0.281256 )
Epeak [keV] : 26.2822      ( -3.21114 1.83899 )
Norm@50keV   : 22.4702    ( -22.4702   15.1903 )
------------------------------------------------------------
#Fit statistic : Chi-Squared =          56.85 using 59 PHA bins.
# Reduced chi-squared =          1.034 for     55 degrees of freedom
# Null hypothesis probability =   4.061066e-01

Photon flux (15-150 keV)    in 361.3 sec:  (    ) ph/cm2/s
Energy fluence (15-150 keV)             : 2.12066e-06 ( -2.11814e-06  -2.45467e-07 ) ergs/cm2
Single BB

Spectral model blackbody:
------------------------------------------------------------
Parameters  : value    Lower 90%  Upper 90%
kT [keV]    : 8.91179  (-0.789889  0.879495)
R^2/D10^2   : 7.86158E-02  (-0.0246014   0.0352897)
(R is the radius in km and D10 is the distance to the source in units of 10 kpc)
------------------------------------------------------------
#Fit statistic : Chi-Squared =          72.08 using 59 PHA bins.
# Reduced chi-squared =          1.265 for     57 degrees of freedom
# Null hypothesis probability =   8.605787e-02

Energy  Fluence     90% Error
[keV]   [erg/cm2]   [erg/cm2]
15- 25  4.369e-07   5.891e-08
25- 50  9.145e-07   8.364e-08
50-150  3.385e-07   8.174e-08
15-150  1.690e-06   1.765e-07
Thermal bremsstrahlung (OTTB)

Spectral model: thermal bremsstrahlung
------------------------------------------------------------
Parameters  : value         Lower 90%    Upper 90%
kT [keV]    : 52.5394       (-10.8345      15.7283)
Norm        : 0.596840       (-0.0815227     0.100994)
------------------------------------------------------------
#Fit statistic : Chi-Squared =          62.34 using 59 PHA bins.
# Reduced chi-squared =          1.094 for     57 degrees of freedom
# Null hypothesis probability =   2.919489e-01

Energy  Fluence     90% Error
[keV]   [erg/cm2]   [erg/cm2]
15- 25  5.330e-07   6.178e-08
25- 50  7.789e-07   7.931e-08
50-150  7.918e-07   1.835e-07
15-150  2.104e-06   2.316e-07
Double BB

------------------------------------------------------------
Parameters  : value         Lower 90%    Upper 90%
kT1 [keV]   : 6.80082        (-1.48003      1.39918)
R1^2/D10^2  : 0.178343        (-0.0814363      0.198469)
kT2 [keV]   : 20.4086        (-7.09489      31.4901)
R2^2/D10^2  : 1.50425E-03    (-0.00152069   0.00957056)
------------------------------------------------------------
#Fit statistic : Chi-Squared =          58.53 using 59 PHA bins.
#Fit statistic : Chi-Squared =          57.34 using 59 PHA bins.
# Reduced chi-squared =          1.064 for     55 degrees of freedom
# Reduced chi-squared =          1.042 for     55 degrees of freedom
# Null hypothesis probability =   3.470530e-01
# Null hypothesis probability =   3.885751e-01

Energy  Fluence     90% Error
[keV]   [erg/cm2]   [erg/cm2]
15- 25  5.067e-07   2.690e-07
25- 50  7.885e-07   4.229e-07
50-150  6.399e-07   3.736e-07
15-150  1.935e-06   1.025e-06
Peak spectrum fit
Power-law model

Time interval is from   31.844 sec. to   32.844 sec.

Spectral model in power-law:
------------------------------------------------------------
Parameters  : value       lower 90%   higher 90%
Photon index: 2.04449     ( -0.540216   0.621952 )
Norm@50keV  : 4.80881E-03    ( -0.00194347   0.00186214 )
------------------------------------------------------------
#Fit statistic : Chi-Squared =          52.59 using 59 PHA bins.
# Reduced chi-squared =         0.9226 for     57 degrees of freedom
# Null hypothesis probability =   6.411046e-01

Photon flux (15-150 keV)    in 1 sec: 0.736466 ( -0.241858  0.242309 ) ph/cm2/s
Energy fluence (15-150 keV)             : 4.44726e-08 ( -1.61772e-08  1.69159e-08 ) ergs/cm2
Cutoff power-law model

Time interval is from   31.844 sec. to   32.844 sec.
Spectral model in the cutoff power-law:
------------------------------------------------------------
Parameters  : value       lower 90%   higher 90%
Photon index: -6.99546     (     )
Epeak [keV] : 32.3832      ( -5.12517 223.483 )
Norm@50keV  : 3589.84    (     )
------------------------------------------------------------
#Fit statistic : Chi-Squared =          50.21 using 59 PHA bins.
# Reduced chi-squared =         0.8966 for     56 degrees of freedom
# Null hypothesis probability =   6.927197e-01

Photon flux (15-150 keV)    in 1 sec: 0.642917 ( -0.233876  0.262307 ) ph/cm2/s
Energy fluence (15-150 keV)             : 3.11098e-08 ( -1.14262e-08  2.0695e-08 ) ergs/cm2
Band function

Time interval is from   31.844 sec. to   32.844 sec.

Spectral model in the Band function:
------------------------------------------------------------
Parameters  : value       lower 90%   higher 90%
alpha       : 5.00000   ( -5   -5 )
beta        : -3.28673    ( 3.28673   1.26778 )
Epeak [keV] : 31.5638      ( -9.27212 7.85413 )
Norm@50keV   : 216.868    ( -66.3424   1635.89 )
------------------------------------------------------------
#Fit statistic : Chi-Squared =          49.08 using 59 PHA bins.
# Reduced chi-squared =         0.8923 for     55 degrees of freedom
# Null hypothesis probability =   6.992436e-01

Photon flux (15-150 keV)    in 1 sec:  (    ) ph/cm2/s
Energy fluence (15-150 keV)             : 3.86077e-08 ( 0  0 ) ergs/cm2
Single BB

Spectral model blackbody:
------------------------------------------------------------
Parameters  : value    Lower 90%  Upper 90%
kT [keV]    : 8.83005  (-2.21387  3.21236)
R^2/D10^2   : 0.598669  (-0.598669   1.28006)
(R is the radius in km and D10 is the distance to the source in units of 10 kpc)
------------------------------------------------------------
#Fit statistic : Chi-Squared =          50.43 using 59 PHA bins.
# Reduced chi-squared =         0.8847 for     57 degrees of freedom
# Null hypothesis probability =   7.182331e-01

Energy  Fluence     90% Error
[keV]   [erg/cm2]   [erg/cm2]
15- 25  8.996e-09   5.570e-09
25- 50  1.855e-08   1.174e-08
50-150  6.675e-09   5.125e-09
15-150  3.422e-08   2.122e-08
Thermal bremsstrahlung (OTTB)

Spectral model: thermal bremsstrahlung
------------------------------------------------------------
Parameters  : value         Lower 90%    Upper 90%
kT [keV]    : 54.0739       (-29.0529      134.117)
Norm        : 4.11325       (-1.79177     3.23596)
------------------------------------------------------------
#Fit statistic : Chi-Squared =          51.70 using 59 PHA bins.
# Reduced chi-squared =         0.9071 for     57 degrees of freedom
# Null hypothesis probability =   6.734060e-01

Energy  Fluence     90% Error
[keV]   [erg/cm2]   [erg/cm2]
15- 25  1.023e-08   6.515e-09
25- 50  1.509e-08   1.077e-08
50-150  1.574e-08   2.085e-08
15-150  4.106e-08   3.708e-08
Double BB

------------------------------------------------------------
Parameters  : value         Lower 90%    Upper 90%
kT1 [keV]   : 200.000        (-200      -200)
R1^2/D10^2  : 4.09228E-05        (-4.09239e-05      -4.09239e-05)
kT2 [keV]   : 8.31578        (-1.65794      2.99612)
R2^2/D10^2  : 0.726646    (-0.485255   0.666725)
------------------------------------------------------------
#Fit statistic : Chi-Squared =          50.43 using 59 PHA bins.
#Fit statistic : Chi-Squared =          49.21 using 59 PHA bins.
# Reduced chi-squared =         0.9169 for     55 degrees of freedom
# Reduced chi-squared =         0.8946 for     55 degrees of freedom
# Null hypothesis probability =   6.496540e-01
# Null hypothesis probability =   6.946089e-01

Energy  Fluence     90% Error
[keV]   [erg/cm2]   [erg/cm2]
15- 25  8.999e-09   5.480e-04
25- 50  1.855e-08   4.823e-03
50-150  6.715e-09   1.177e-01
15-150  3.426e-08   1.270e-01
Pre-slew spectrum (Pre-slew PHA with pre-slew DRM)
Power-law model

Spectral model in power-law:
------------------------------------------------------------
Parameters  : value       lower 90%   higher 90%
Photon index: 2.04480     ( -0.256572   0.271845 )
Norm@50keV  : 1.42457E-03    ( -0.000269115   0.000264837 )
------------------------------------------------------------
#Fit statistic : Chi-Squared =          70.09 using 59 PHA bins.
# Reduced chi-squared =          1.230 for     57 degrees of freedom
# Null hypothesis probability =   1.141500e-01

Photon flux (15-150 keV)    in 47.73 sec: 0.218220 ( -0.0348427  0.0349054 ) ph/cm2/s
Energy fluence (15-150 keV)             : 6.28661e-07 ( -1.1046e-07  1.1295e-07 ) ergs/cm2
Cutoff power-law model

Spectral model in the cutoff power-law:
------------------------------------------------------------
Parameters  : value       lower 90%   higher 90%
Photon index: -0.387002     ( -2.10518   1.44987 )
Epeak [keV] : 38.8442      ( -6.828 8.76193 )
Norm@50keV  : 3.90705E-02    ( -0.0395996   0.773392 )
------------------------------------------------------------
#Fit statistic : Chi-Squared =          60.21 using 59 PHA bins.
# Reduced chi-squared =          1.075 for     56 degrees of freedom
# Null hypothesis probability =   3.261202e-01

Photon flux (15-150 keV)    in 47.73 sec: 0.205529 ( -0.034482  0.034939 ) ph/cm2/s
Energy fluence (15-150 keV)             : 5.35717e-07 ( -1.00597e-07  1.11507e-07 ) ergs/cm2
Band function

Spectral model in the Band function:
------------------------------------------------------------
Parameters  : value       lower 90%   higher 90%
alpha       : 4.97318   ( -1.79743   -4.97318 )
beta        : -2.75491    ( -0.885526   0.486302 )
Epeak [keV] : 29.4278      ( -4.35039 4.25305 )
Norm@50keV   : 90.7652    ( -13.5996   177.582 )
------------------------------------------------------------
#Fit statistic : Chi-Squared =          57.87 using 59 PHA bins.
# Reduced chi-squared =          1.052 for     55 degrees of freedom
# Null hypothesis probability =   3.699675e-01

Photon flux (15-150 keV)    in 47.73 sec:  (    ) ph/cm2/s
Energy fluence (15-150 keV)             : 0 ( 0  0 ) ergs/cm2
S(25-50 keV) vs. S(50-100 keV) plot

S(25-50 keV)  = 7.08e-07
S(50-100 keV) = 6.65e-07
T90 vs. Hardness ratio plot

T90                                   = 332.555999934673 sec.
Hardness ratio (energy fluence ratio) = 0.939266
Color vs. Color plot
Count Ratio  (25-50 keV) / (15-25 keV) = 1.13343
Count Ratio (50-100 keV) / (15-25 keV) = 0.465238
Mask shadow pattern

IMX = 8.020726844248932E-01, IMY = 1.828526217484349E-01
TIME vs. PHA plot around the trigger time

TIME vs. DetID plot around the trigger time

100 us light curve (15-350 keV)
Spacecraft aspect plot

Bright source in the pre-burst/pre-slew/post-slew images
Pre-burst image of 15-350 keV band
Time interval of the image:
-13.299400 25.572000

# RAcent  DECcent POSerr Theta    Phi  PeakCts   SNR AngSep     Name
#  [deg]    [deg]    ['] [deg]  [deg]                   [']
244.9607 -15.6249    0.7  23.9  111.6   1.7850  15.8    1.4	Sco X-1
255.9639 -37.7864   12.2  12.4   34.4   0.0787   0.9    3.6	4U 1700-377
256.2729 -36.3297   13.2  11.2   39.1   0.0690   0.9    9.6	GX 349+2
262.8463 -24.7217    4.0   5.4  134.7   0.2171   2.9    9.0	GX 1+4
264.9000 -44.6002    5.9  15.6   -3.8   0.1456   1.9   11.2	4U 1735-44
268.5203  -1.3199    0.0  27.8  176.6   0.1014   1.1   12.1	SW J1753.5-0127
270.4272 -25.1916    3.1   5.2 -144.3  -0.2757  -3.8   10.3	GX 5-1
270.4536 -25.8816    5.6   4.8 -138.5  -0.1545  -2.1   11.6	GRS 1758-258
274.1654 -13.9019    0.0  16.7 -160.9   0.1515   2.0   12.3	GX 17+2
276.0998 -30.3557    4.0   8.5  -86.6  -0.2201  -2.9    9.1	H1820-303
284.8677 -24.7760    0.0  17.0 -108.1   0.3438   4.1   12.6	HT1900.1-2455
288.8439  10.8451    3.8  45.4 -156.1   0.4476   3.1    6.6	GRS 1915+105
262.8401 -33.8574    3.3   5.7   23.8   0.2610   3.5    7.6	GX 354-0
335.5453 -82.5474    2.2  58.5  -16.0   2.2027   5.2 ------	UNKNOWN
294.0474 -18.9155    2.4  27.1 -113.6   0.4693   4.8 ------	UNKNOWN
294.4732  13.5811    2.1  50.5 -151.6   1.0912   5.5 ------	UNKNOWN
317.0212 -44.4732    2.3  42.6  -62.4   1.5108   5.0 ------	UNKNOWN
Pre-slew background subtracted image of 15-350 keV band
Time interval of the image:
25.572000 73.300590

# RAcent  DECcent POSerr Theta    Phi  PeakCts   SNR AngSep     Name
#  [deg]    [deg]    ['] [deg]  [deg]                   [']
244.8508 -15.5413    7.5  24.0  111.7  -0.2792  -1.5    9.5	Sco X-1
256.1501 -37.9411    5.3  12.3   33.4   0.2713   2.2    9.7	4U 1700-377
256.6550 -36.3130    0.0  11.0   38.1   0.2616   2.1   12.5	GX 349+2
262.8979 -24.6534    3.6   5.4  135.6  -0.3759  -3.2    8.2	GX 1+4
264.8690 -44.5599    6.8  15.6   -3.7  -0.1990  -1.7    8.5	4U 1735-44
268.5203  -1.3200    0.0  27.8  176.6  -0.0795  -0.6   12.1	SW J1753.5-0127
270.4447 -25.1273    2.7   5.3 -144.6   0.4959   4.4    9.2	GX 5-1
270.1778 -25.5801    7.5   4.8 -143.2   0.1843   1.6   11.9	GRS 1758-258
273.8459 -14.1708    0.0  16.4 -161.6   0.2978   2.5   12.3	GX 17+2
276.1052 -30.2706    5.1   8.5  -87.2   0.2745   2.3   11.0	H1820-303
284.8677 -24.7760    0.0  17.0 -108.1  -0.2604  -2.0   12.6	HT1900.1-2455
288.9074  11.0378    2.8  45.6 -156.2   0.9524   4.2    8.5	GRS 1915+105
262.7817 -33.9569    0.0   5.8   23.6  -0.0744  -0.6   12.7	GX 354-0
274.9659 -68.1618    1.8  39.4  -12.8   1.1497   6.5 ------	UNKNOWN
Post-slew image of 15-350 keV band
Time interval of the image:
161.700600 963.088100

# RAcent  DECcent POSerr Theta    Phi  PeakCts   SNR AngSep     Name
#  [deg]    [deg]    ['] [deg]  [deg]                   [']
170.4677 -60.5678  241.2  40.3  -28.3   0.0393   0.0    5.6	Cen X-3
186.7825 -62.5815    6.7  33.9  -20.2  -1.0521  -1.7   11.8	GX 301-2
256.0217 -37.8605    2.4  32.0   75.7   4.9317   4.9    1.9	4U 1700-377
256.3112 -36.4471    6.8  33.3   76.6   1.8683   1.7    6.2	GX 349+2
264.5857 -44.4448   12.0  24.3   86.4   0.7833   1.0    6.7	4U 1735-44
275.8097 -30.4099    8.6  37.7  105.7   2.0392   1.4    6.5	H1820-303
263.0239 -33.9826    5.4  34.8   87.1   2.6856   2.1    9.0	GX 354-0
318.2437 -44.4284    3.0  32.6  170.1   2.7680   3.9 ------	UNKNOWN
224.8527 -59.7648    2.8  22.7   11.2   2.2146   4.2 ------	UNKNOWN
286.3016 -64.4996    2.6   5.9  161.5   2.2620   4.5 ------	UNKNOWN
356.0952 -29.5599    4.4  59.6 -161.6  17.1477   2.6 ------	UNKNOWN
141.4576 -56.5278    4.6  50.7  -44.5   9.3697   2.5 ------	UNKNOWN
 19.1074 -50.9567    3.0  48.5 -130.3  12.6038   3.8 ------	UNKNOWN
Plot creation:
Thu Nov 12 16:25:48 EST 2015