Special notes of this burst
Image
Pre-slew 15.0-350.0 keV image (Event data)
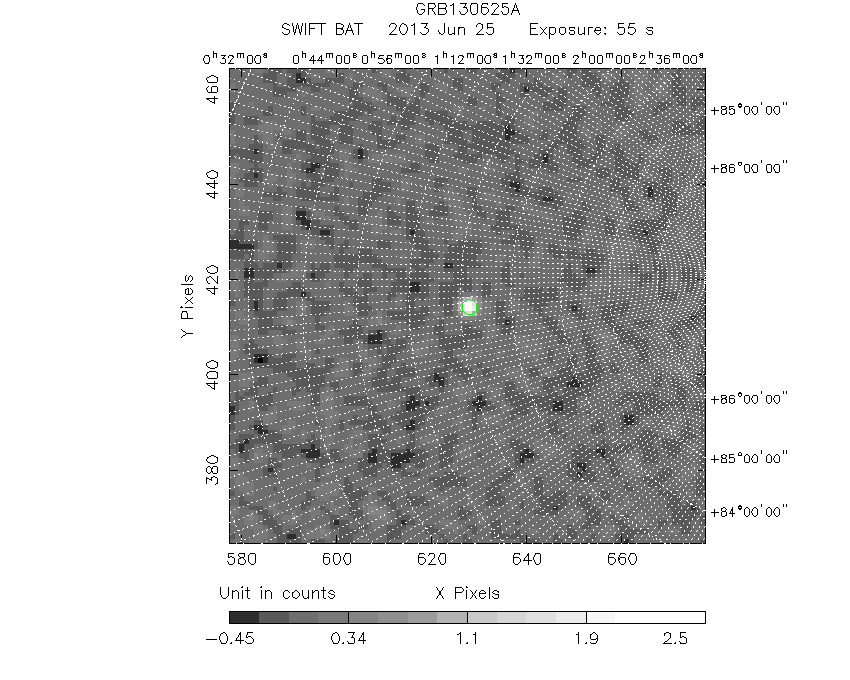
#   RAcent    DECcent   POSerr    Theta     Phi              Peak Cts       SNR   Name
  343.3610    82.1719   0.0081    28.5851    13.9131         2.8991420     23.637 TRIG_00558982

Foreground time interval of the image:
-29.368  26.061 (delta_t =  55.429 [sec])
Background time interval of the image:
-239.240 -29.368 (delta_t = 209.872 [sec])
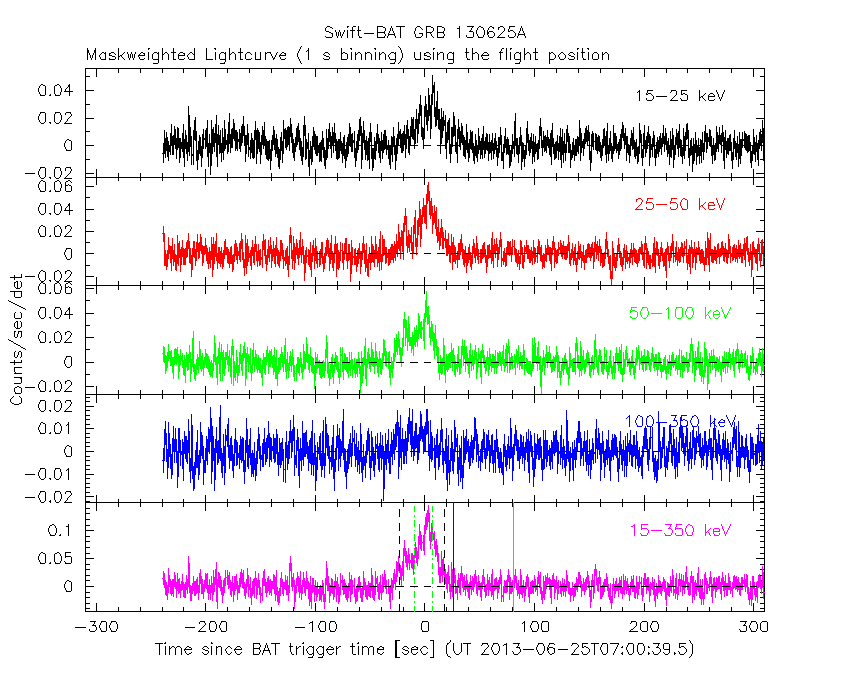
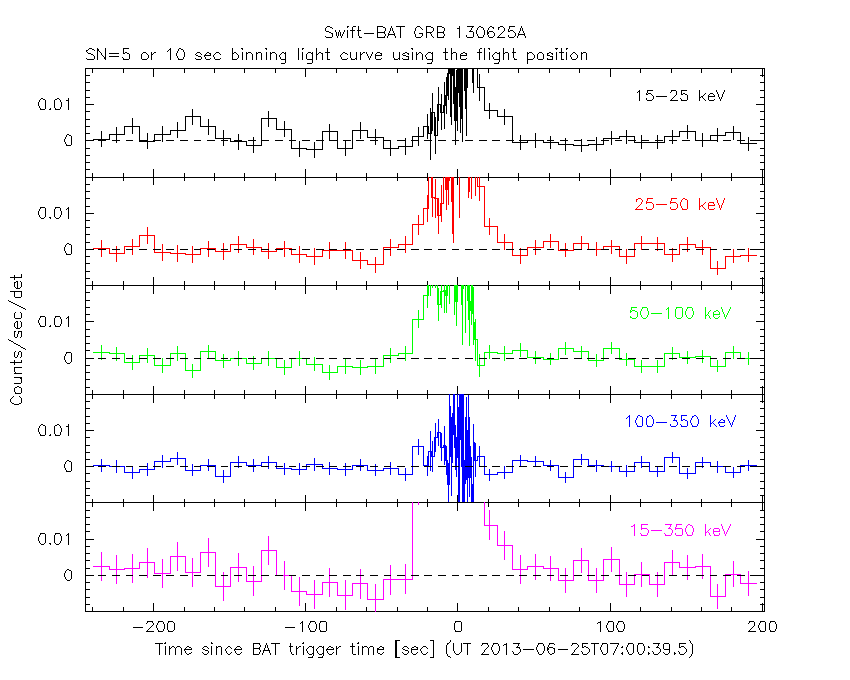
Lightcurves
Notes:
- 1) The mask-weighted light curves are using the flight position.
- 2) Multiple plots of different time binning/intervals are shown to cover all scenarios of short/long GRBs, rate/image triggers, and real/false positives.
- 3) For all the mask-weighted lightcurves, the y-axis units are counts/sec/det where a det is 0.4 x 0.4 = 0.16 sq cm.
- 4) The verticle lines correspond to following: green dotted lines are T50 interval, black dotted lines are T90 interval, blue solid line(s) is a spacecraft slew start time, and orange solid line(s) is a spacecraft slew end time.
- 5) Time of each bin is in the middle of the bin.
1 s binning
From T0-310 s to T0+310 s
From T100_start - 20 s to T100_end + 30 s
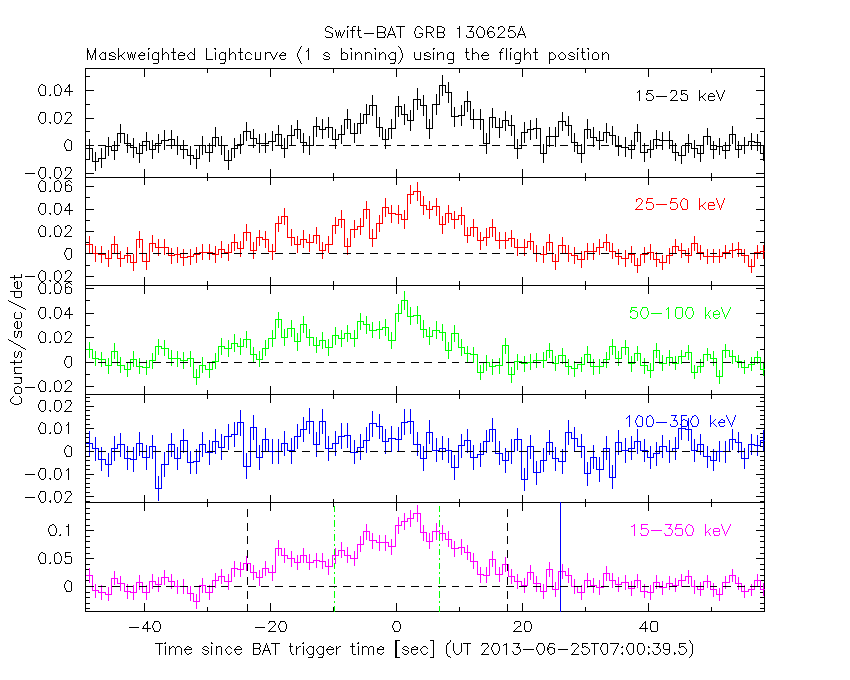
Full time interval
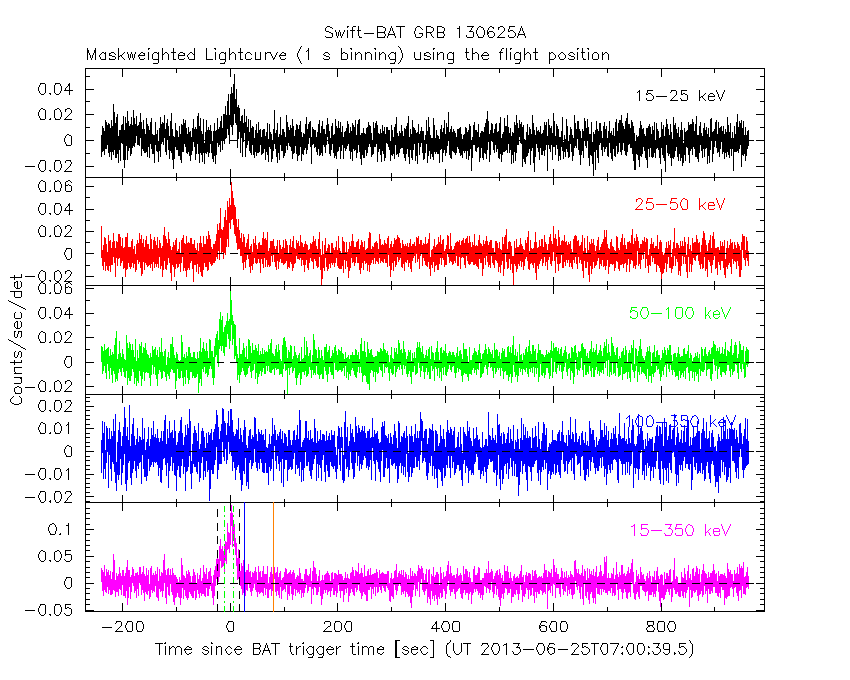
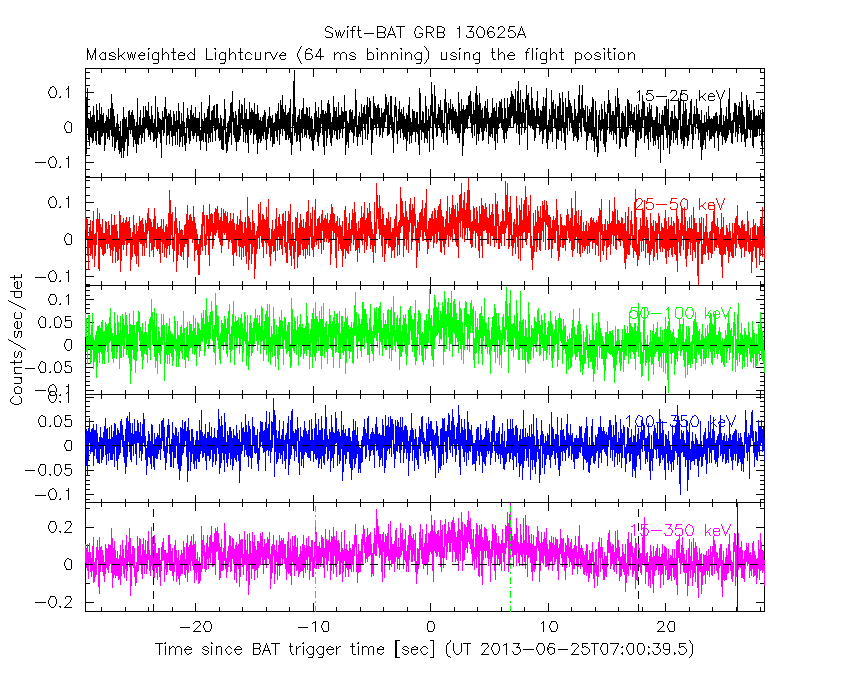
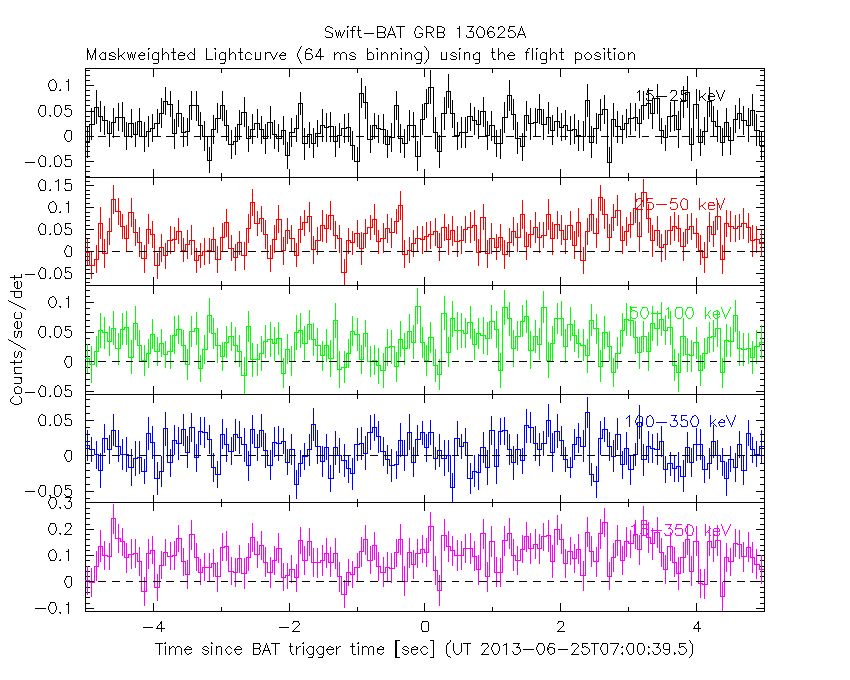
64 ms binning
Full time interval

From T100_start to T100_end
From T0-5 sec to T0+5 sec
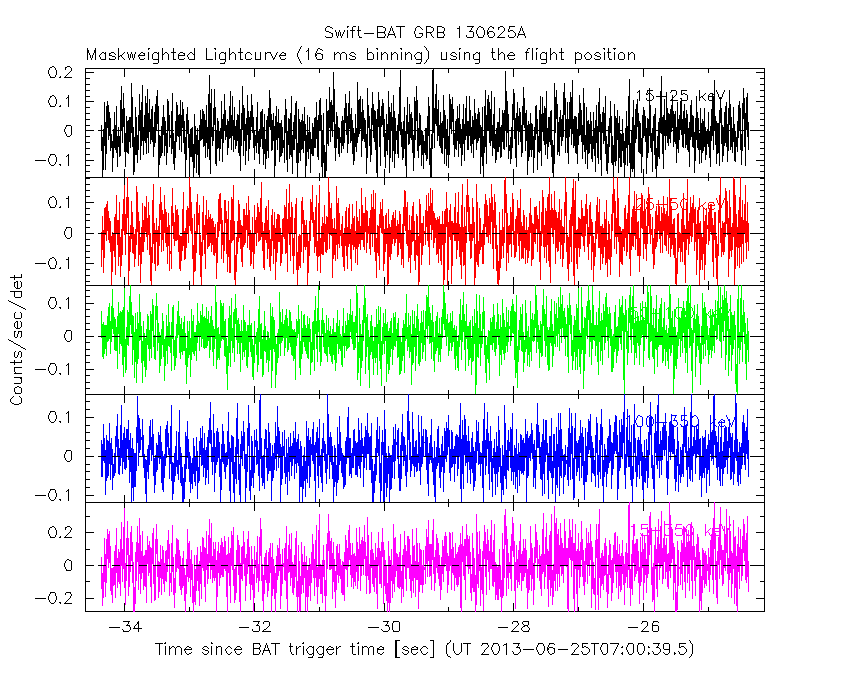
16 ms binning
From T100_start-5 s to T100_start+5 s
Blue+Cyan dotted lines: Time interval of the scaled map
From 0.000000 to 2.048000
8 ms binning
From T100_start-3 s to T100_start+3 s

Blue+Cyan dotted lines: Time interval of the scaled map
From 0.000000 to 2.048000
2 ms binning
From T100_start-1 s to T100_start+1 s

Blue+Cyan dotted lines: Time interval of the scaled map
From 0.000000 to 2.048000
SN=5 or 10 sec. binning (whichever binning is satisfied first)
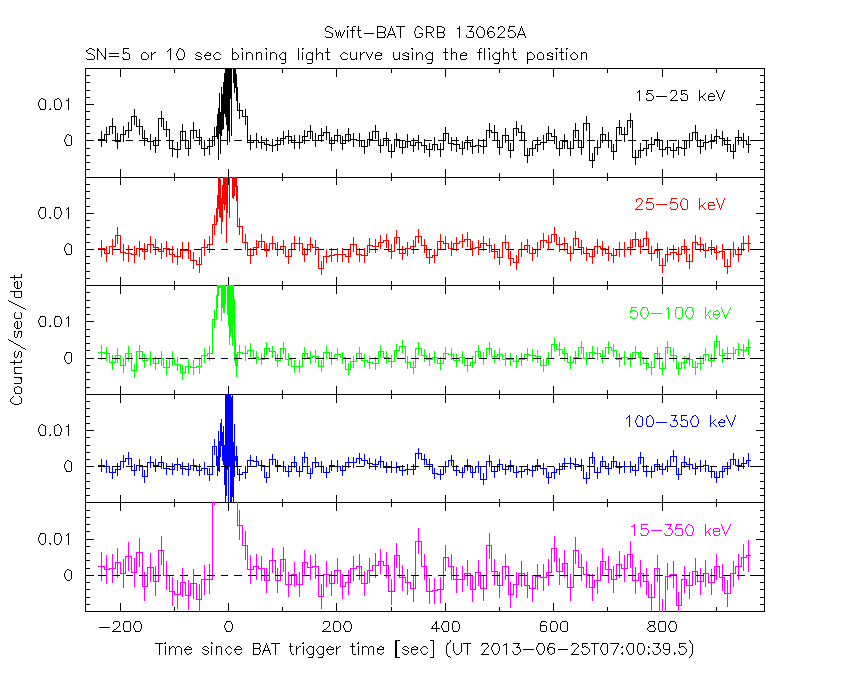
SN=5 or 10 sec. binning (T < 200 sec)
Quad-rate summed light curves (from T0-300s to T0+1000s)

The mask-weighted light curves based on cleaned DPHs

Spectral Evolution

Spectra
Notes:
- 1) The fitting includes the systematic errors.
- 2) When the burst includes telescope slew time periods, the fitting uses an average response file made from multiple 5-s response files through out the slew time plus single time preiod for the non-slew times, and weighted by the total counts in the corresponding time period using addrmf. An average response file is needed becuase a spectral fit using the pre-slew DRM will introduce some errors in both a spectral shape and a normalization if the PHA file contains a lot of the slew/post-slew time interval.
- 3) For fits to more complicated models (e.g. a power-law over a cutoff power-law), the BAT team has decided to require a chi-square improvement of more than 6 for each extra dof.
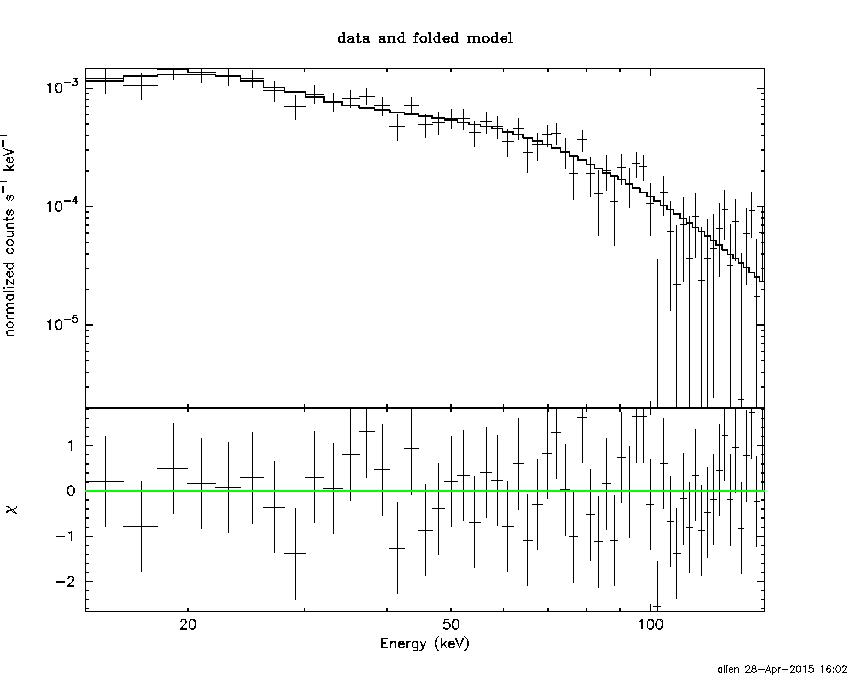
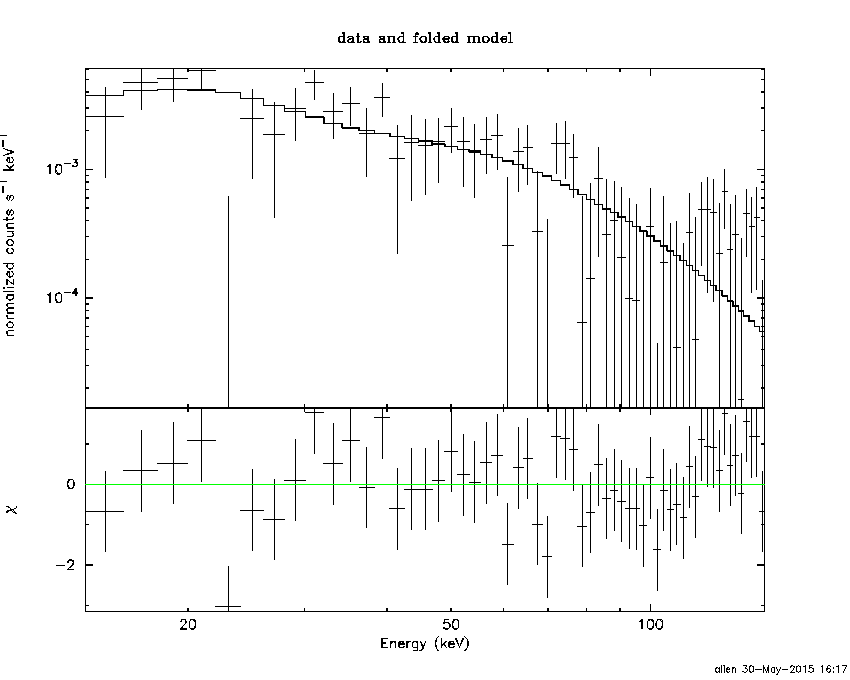
Time averaged spectrum fit using the average DRM
Power-law model

Time interval is from  -29.368 sec. to   28.388 sec.

Spectral model in power-law:
------------------------------------------------------------
Parameters  : value       lower 90%   higher 90%
Photon index: 1.42589     ( -0.10056   0.100565 )
Norm@50keV  : 3.35114E-03    ( -0.000190854   0.00019057 )
------------------------------------------------------------
#Fit statistic : Chi-Squared =          47.74 using 59 PHA bins.
# Reduced chi-squared =         0.8375 for     57 degrees of freedom
# Null hypothesis probability =   8.040505e-01

Photon flux (15-150 keV)    in 57.76 sec: 0.410569 ( -0.0241731  0.0242163 ) ph/cm2/s
Energy fluence (15-150 keV)             : 1.8607e-06 ( -1.15749e-07  1.16252e-07 ) ergs/cm2
Cutoff power-law model
Time interval is from  -29.368 sec. to   28.388 sec.
Spectral model in the cutoff power-law:
------------------------------------------------------------
Parameters  : value       lower 90%   higher 90%
Photon index: 1.12637     ( -0.429541   0.342404 )
Epeak [keV] : 151.899      ( -60.8381 -151.899 )
Norm@50keV  : 4.69133E-03    ( -0.00144537   0.00280369 )
------------------------------------------------------------
#Fit statistic : Chi-Squared =          46.06 using 59 PHA bins.
# Reduced chi-squared =         0.8225 for     56 degrees of freedom
# Null hypothesis probability =   8.256750e-01

Photon flux (15-150 keV)    in 57.76 sec: 0.404421 ( -0.025479  0.025454 ) ph/cm2/s
Energy fluence (15-150 keV)             : 1.82306e-06 ( -1.27736e-07  1.26933e-07 ) ergs/cm2
Band function

Time interval is from  -29.368 sec. to   28.388 sec.

Spectral model in the Band function:
------------------------------------------------------------
Parameters  : value       lower 90%   higher 90%
alpha       : -1.03658   ( 0.94176   0.94176 )
beta        : -1.68421    ( 1.60745   0.231624 )
Epeak [keV] : 122.452      ( -102.674 -102.674 )
Norm@50keV   : 5.25884E-03    ( -0.00183882   0 )
------------------------------------------------------------
#Fit statistic : Chi-Squared =          45.84 using 59 PHA bins.
# Reduced chi-squared =         0.8335 for     55 degrees of freedom
# Null hypothesis probability =   8.057729e-01

Photon flux (15-150 keV)    in 57.76 sec:  (    ) ph/cm2/s
Energy fluence (15-150 keV)             : 0 ( 0  0 ) ergs/cm2
Single BB

Spectral model blackbody:
------------------------------------------------------------
Parameters  : value    Lower 90%  Upper 90%
kT [keV]    : 16.3051  (-1.17496  1.28769)
R^2/D10^2   : 3.51180E-02  (-0.00816158   0.0104906)
(R is the radius in km and D10 is the distance to the source in units of 10 kpc)
------------------------------------------------------------
#Fit statistic : Chi-Squared =         106.73 using 59 PHA bins.
# Reduced chi-squared =         1.8725 for     57 degrees of freedom
# Null hypothesis probability =   7.311567e-05

Energy  Fluence     90% Error
[keV]   [erg/cm2]   [erg/cm2]
15- 25  1.110e-07   1.300e-08
25- 50  4.747e-07   3.457e-08
50-150  8.883e-07   9.646e-08
15-150  1.474e-06   1.034e-07
Thermal bremsstrahlung (OTTB)

Spectral model: thermal bremsstrahlung
------------------------------------------------------------
Parameters  : value         Lower 90%    Upper 90%
kT [keV]    : 200.000       (      )
Norm        : 1.69809       (-0.0960755     0.0960678)
------------------------------------------------------------
#Fit statistic : Chi-Squared =          51.08 using 59 PHA bins.
# Reduced chi-squared =         0.8962 for     57 degrees of freedom
# Null hypothesis probability =   6.955345e-01

Energy  Fluence     90% Error
[keV]   [erg/cm2]   [erg/cm2]
15- 25  2.443e-07   1.614e-08
25- 50  4.699e-07   3.590e-08
50-150  1.031e-06   1.863e-07
15-150  1.745e-06   2.359e-07
Double BB

Spectral model: bbodyrad<1> + bbodyrad<2>
------------------------------------------------------------
Parameters  : value         Lower 90%    Upper 90%
kT1 [keV]   : 7.24284        (-1.64367      1.96478)
R1^2/D10^2  : 0.339962        (-0.175762      0.47829)
kT2 [keV]   : 26.4871        (-4.60004      9.14579)
R2^2/D10^2  : 5.31719E-03    (-0.00343965   0.00553239)
------------------------------------------------------------
#Fit statistic : Chi-Squared =          48.70 using 59 PHA bins.
# Reduced chi-squared =         0.8855 for     55 degrees of freedom
# Null hypothesis probability =   7.126151e-01

Energy  Fluence     90% Error
[keV]   [erg/cm2]   [erg/cm2]
15- 25  2.075e-07   4.950e-08
25- 50  4.620e-07   1.001e-07
50-150  1.137e-06   3.090e-07
15-150  1.806e-06   4.104e-07
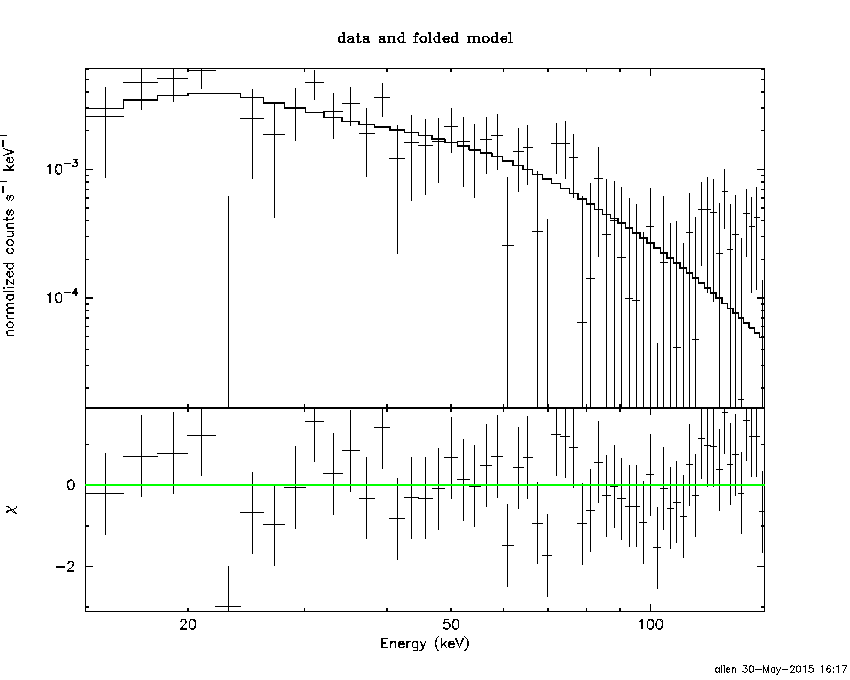
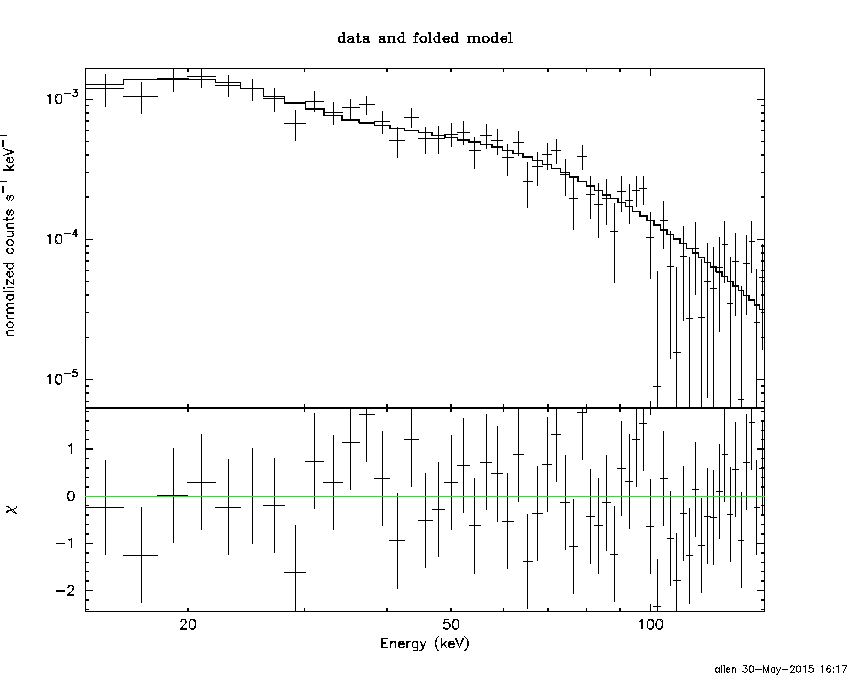
Peak spectrum fit
Power-law model

Time interval is from    2.544 sec. to    3.544 sec.

Spectral model in power-law:
------------------------------------------------------------
Parameters  : value       lower 90%   higher 90%
Photon index: 1.53342     ( -0.255078   0.25904 )
Norm@50keV  : 9.45906E-03    ( -0.00151253   0.00149507 )
------------------------------------------------------------
#Fit statistic : Chi-Squared =          53.24 using 59 PHA bins.
# Reduced chi-squared =         0.9340 for     57 degrees of freedom
# Null hypothesis probability =   6.169765e-01

Photon flux (15-150 keV)    in 1 sec: 1.19179 ( -0.183304  0.183481 ) ph/cm2/s
Energy fluence (15-150 keV)             : 8.92655e-08 ( -1.53805e-08  1.56087e-08 ) ergs/cm2
Cutoff power-law model

Time interval is from    2.544 sec. to    3.544 sec.
Spectral model in the cutoff power-law:
------------------------------------------------------------
Parameters  : value       lower 90%   higher 90%
Photon index: 0.877895     ( -1.863   0.863508 )
Epeak [keV] : 78.5844      ( -30.6636 -79.122 )
Norm@50keV  : 2.15378E-02    ( -0.0130755   0.200903 )
------------------------------------------------------------
#Fit statistic : Chi-Squared =          52.59 using 59 PHA bins.
# Reduced chi-squared =         0.9392 for     56 degrees of freedom
# Null hypothesis probability =   6.045823e-01

Photon flux (15-150 keV)    in 1 sec: 1.16778 ( -0.195177  0.19106 ) ph/cm2/s
Energy fluence (15-150 keV)             : 8.41398e-08 ( -1.89193e-08  1.87952e-08 ) ergs/cm2
Band function
Time interval is from    2.544 sec. to    3.544 sec.

Spectral model in the Band function:
------------------------------------------------------------
Parameters  : value       lower 90%   higher 90%
alpha       : -4.94426E-02   ( 0.178845   0.178845 )
beta        : -2.01657    ( 2.01191   0.618943 )
Epeak [keV] : 53.6011      ( -52.9554 190.652 )
Norm@50keV   : 6.75156E-02    ( -0.0726578   873.561 )
------------------------------------------------------------
#Fit statistic : Chi-Squared =          51.33 using 59 PHA bins.
# Reduced chi-squared =         0.9333 for     55 degrees of freedom
# Null hypothesis probability =   6.156198e-01

Photon flux (15-150 keV)    in 1 sec:  (    ) ph/cm2/s
Energy fluence (15-150 keV)             : 0 ( 0  0 ) ergs/cm2
Single BB
Spectral model blackbody:
------------------------------------------------------------
Parameters  : value    Lower 90%  Upper 90%
kT [keV]    : 13.0941  (-1.95248  2.42987)
R^2/D10^2   : 0.225756  (-0.104868   0.179337)
(R is the radius in km and D10 is the distance to the source in units of 10 kpc)
------------------------------------------------------------
#Fit statistic : Chi-Squared =          56.64 using 59 PHA bins.
# Reduced chi-squared =         0.9936 for     57 degrees of freedom
# Null hypothesis probability =   4.887043e-01

Energy  Fluence     90% Error
[keV]   [erg/cm2]   [erg/cm2]
15- 25  8.208e-09   2.380e-09
25- 50  2.849e-08   6.575e-09
50-150  3.101e-08   1.061e-08
15-150  6.771e-08   1.579e-08
Thermal bremsstrahlung (OTTB)
Spectral model: thermal bremsstrahlung
------------------------------------------------------------
Parameters  : value         Lower 90%    Upper 90%
kT [keV]    : 198.317       (-103.099      -198.317)
Norm        : 4.88717       (-0.741156     0.880045)
------------------------------------------------------------
#Fit statistic : Chi-Squared =          52.73 using 59 PHA bins.
# Reduced chi-squared =         0.9251 for     57 degrees of freedom
# Null hypothesis probability =   6.358380e-01

Energy  Fluence     90% Error
[keV]   [erg/cm2]   [erg/cm2]
15- 25  1.218e-08   6.995e-09
25- 50  2.341e-08   1.304e-08
50-150  5.126e-08   2.850e-08
15-150  8.685e-08   4.824e-08
Double BB

------------------------------------------------------------
#Fit statistic : Chi-Squared =          54.17 using 59 PHA bins.
#Fit statistic : Chi-Squared =          49.40 using 59 PHA bins.
#Fit statistic : Chi-Squared =          48.73 using 59 PHA bins.
#Fit statistic : Chi-Squared =          48.44 using 59 PHA bins.
# Reduced chi-squared =         0.9850 for     55 degrees of freedom
# Reduced chi-squared =         0.8982 for     55 degrees of freedom
# Reduced chi-squared =         0.8860 for     55 degrees of freedom
# Reduced chi-squared =         0.8807 for     55 degrees of freedom
# Null hypothesis probability =   5.061723e-01
# Null hypothesis probability =   6.875445e-01
# Null hypothesis probability =   7.115698e-01
# Null hypothesis probability =   7.217193e-01

Energy  Fluence     90% Error
[keV]   [erg/cm2]   [erg/cm2]
15- 25  1.069e-08   5.150e-09
25- 50  2.582e-08   1.134e-08
50-150  3.505e-08   1.661e-08
15-150  7.156e-08   2.632e-08
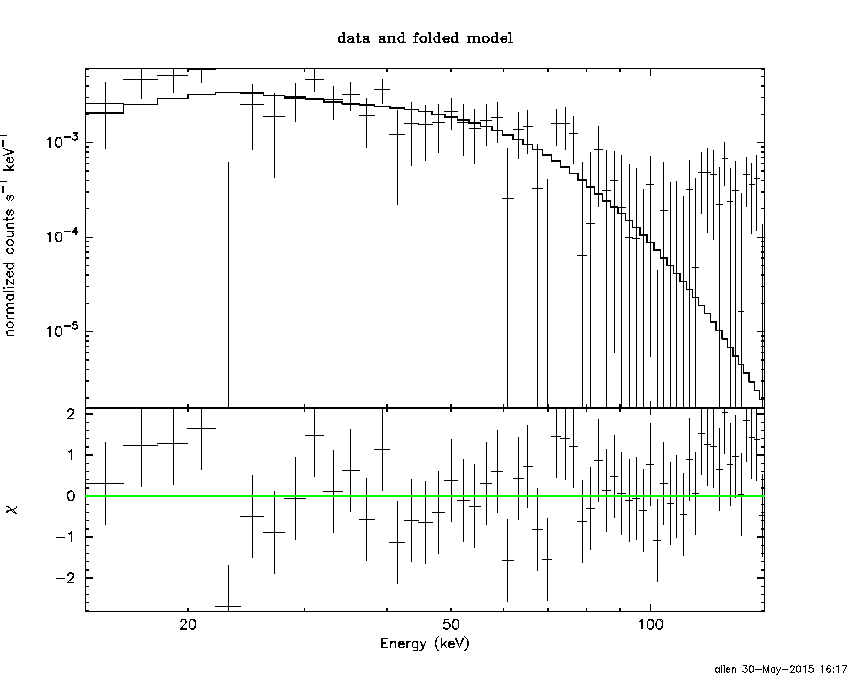
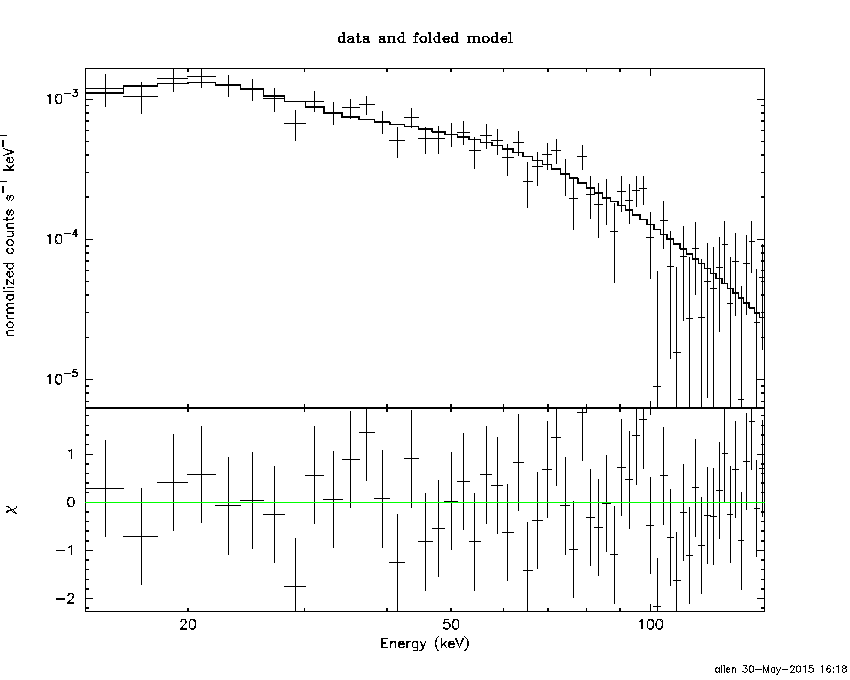
Pre-slew spectrum (Pre-slew PHA with pre-slew DRM)
Power-law model
Spectral model in power-law:
------------------------------------------------------------
Parameters  : value       lower 90%   higher 90%
Photon index: 1.40540     ( -0.0992019   0.0990971 )
Norm@50keV  : 3.46023E-03    ( -0.000194831   0.00019463 )
------------------------------------------------------------
#Fit statistic : Chi-Squared =          48.62 using 59 PHA bins.
# Reduced chi-squared =         0.8530 for     57 degrees of freedom
# Null hypothesis probability =   7.774826e-01

Photon flux (15-150 keV)    in 55.43 sec: 0.421910 ( -0.024645  0.0246893 ) ph/cm2/s
Energy fluence (15-150 keV)             : 1.85127e-06 ( -1.13837e-07  1.14295e-07 ) ergs/cm2
Cutoff power-law model

Spectral model in the cutoff power-law:
------------------------------------------------------------
Parameters  : value       lower 90%   higher 90%
Photon index: 1.07773     ( -0.425954   0.364914 )
Epeak [keV] : 147.163      ( -55.5916 -147.165 )
Norm@50keV  : 4.99353E-03    ( -0.00161914   0.0029393 )
------------------------------------------------------------
#Fit statistic : Chi-Squared =          46.57 using 59 PHA bins.
# Reduced chi-squared =         0.8316 for     56 degrees of freedom
# Null hypothesis probability =   8.113357e-01

Photon flux (15-150 keV)    in 55.43 sec: 0.415121 ( -0.025884  0.025915 ) ph/cm2/s
Energy fluence (15-150 keV)             : 1.81102e-06 ( -1.25416e-07  1.24584e-07 ) ergs/cm2
Band function
Spectral model in the Band function:
------------------------------------------------------------
Parameters  : value       lower 90%   higher 90%
alpha       : -0.839351   ( 0.840402   0.840402 )
beta        : -1.57778    ( 1.57838   0.218542 )
Epeak [keV] : 90.7673      ( -91.1029 -91.1029 )
Norm@50keV   : 6.97273E-03    ( -0.00320052   0 )
------------------------------------------------------------
#Fit statistic : Chi-Squared =          46.30 using 59 PHA bins.
# Reduced chi-squared =         0.8419 for     55 degrees of freedom
# Null hypothesis probability =   7.919096e-01

Photon flux (15-150 keV)    in 55.43 sec:  (    ) ph/cm2/s
Energy fluence (15-150 keV)             : 0 ( 0  0 ) ergs/cm2
S(25-50 keV) vs. S(50-100 keV) plot

S(25-50 keV)  = 4.43e-07
S(50-100 keV) = 6.60e-07
T90 vs. Hardness ratio plot
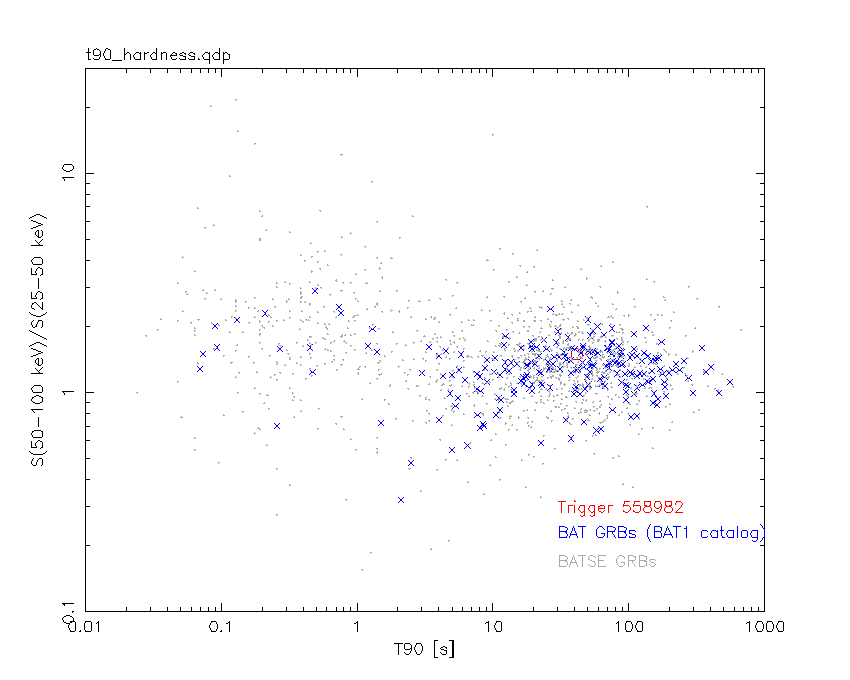
T90                                   = 41.2719999551773 sec.
Hardness ratio (energy fluence ratio) = 1.48984
Color vs. Color plot
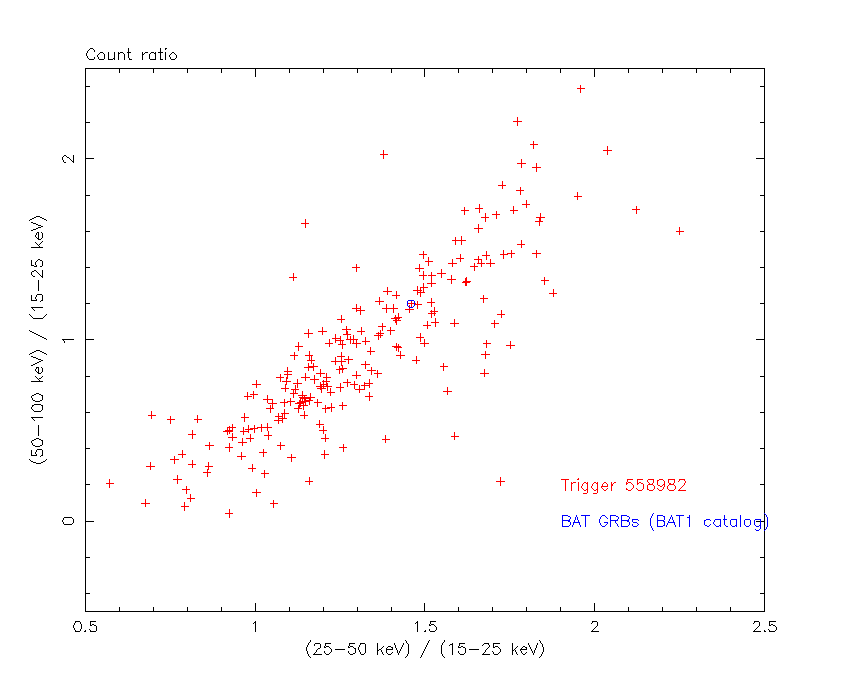
Count Ratio  (25-50 keV) / (15-25 keV) = 1.45899
Count Ratio (50-100 keV) / (15-25 keV) = 1.20007
Mask shadow pattern
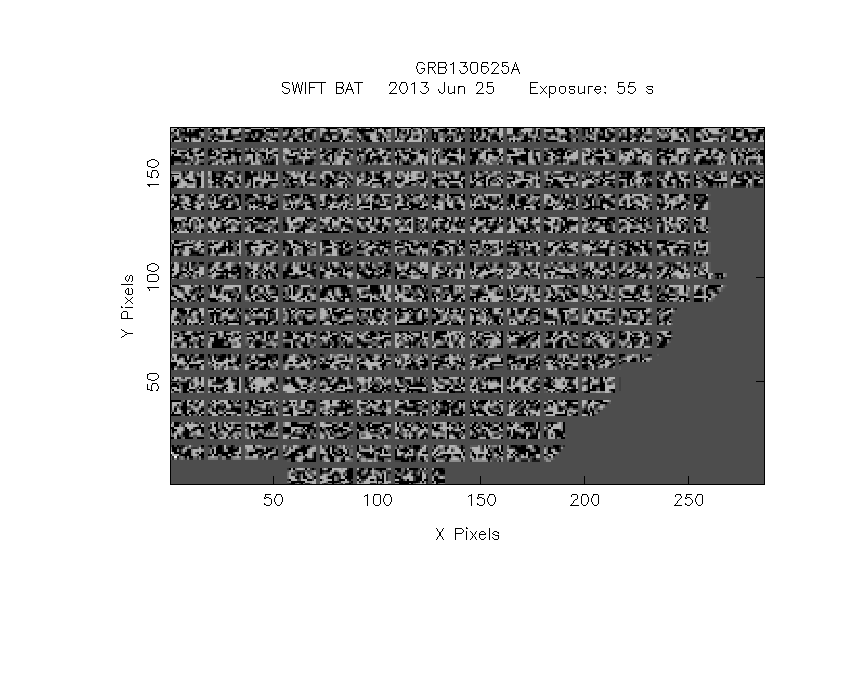
IMX = 5.288944595982462E-01, IMY = -1.310165041504657E-01
TIME vs. PHA plot around the trigger time
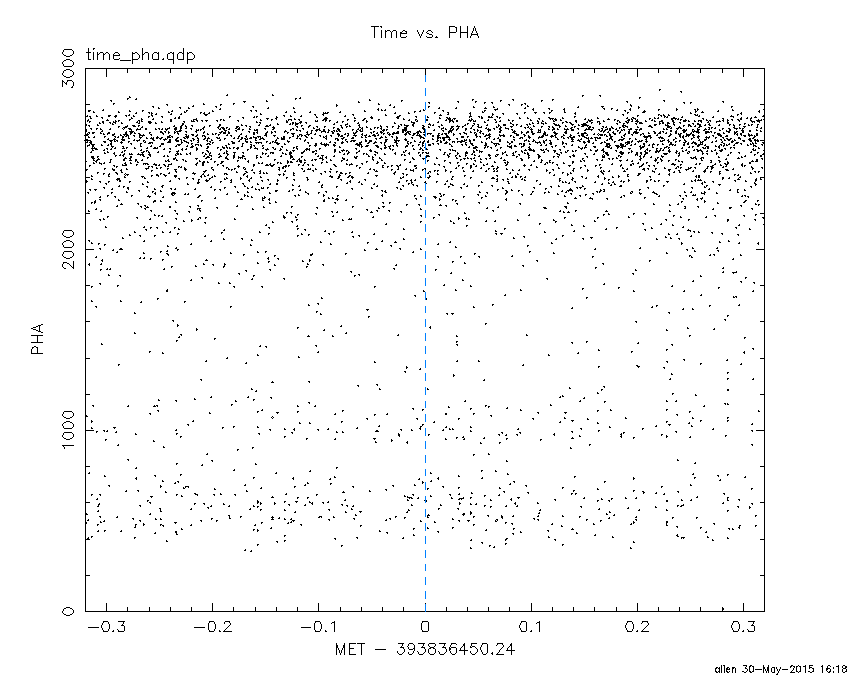
Blue+Cyan dotted lines: Time interval of the scaled map
From 0.000000 to 2.048000
TIME vs. DetID plot around the trigger time
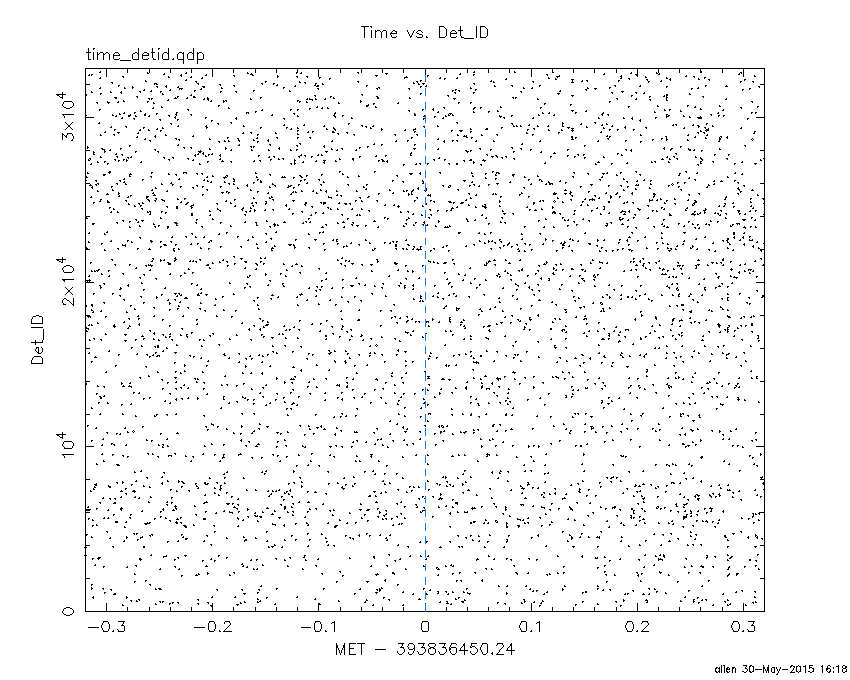
Blue+Cyan dotted lines: Time interval of the scaled map
From 0.000000 to 2.048000
100 us light curve (15-350 keV)
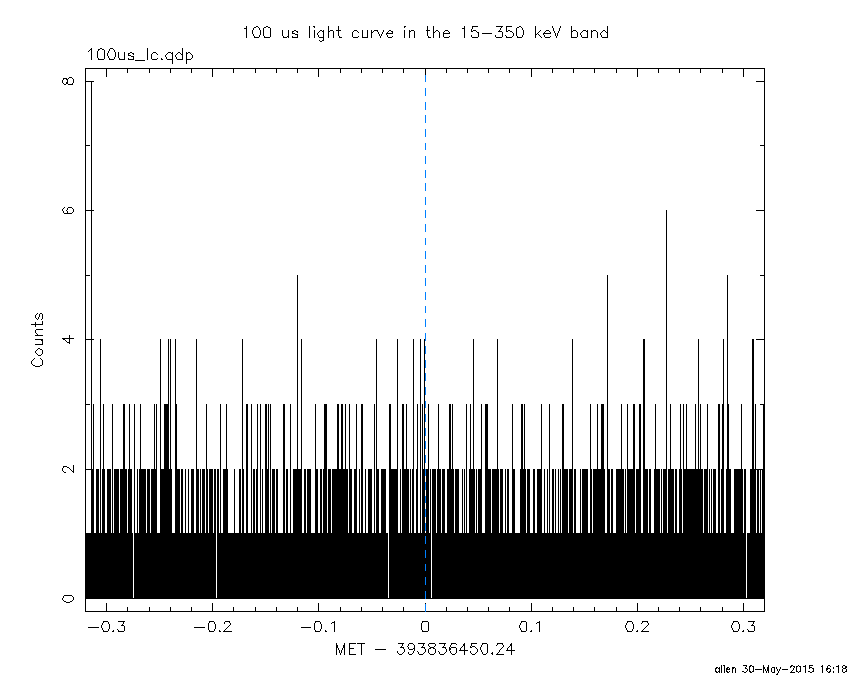
Blue+Cyan dotted lines: Time interval of the scaled map
From 0.000000 to 2.048000
Spacecraft aspect plot

Bright source in the pre-burst/pre-slew/post-slew images
Pre-burst image of 15-350 keV band
Time interval of the image:
-239.240000 -29.368000

# RAcent  DECcent POSerr Theta    Phi  PeakCts   SNR AngSep     Name
#  [deg]    [deg]    ['] [deg]  [deg]                   [']
 43.8391  54.0900    2.7  45.5  -34.5   1.6763   4.3 ------	UNKNOWN
 50.4408  46.1530    3.3  50.6  -44.5   3.6807   3.4 ------	UNKNOWN
Pre-slew background subtracted image of 15-350 keV band
Time interval of the image:
-29.368000 26.060590

# RAcent  DECcent POSerr Theta    Phi  PeakCts   SNR AngSep     Name
#  [deg]    [deg]    ['] [deg]  [deg]                   [']
190.1073  83.8323    2.6  16.7   31.9   0.4351   4.4 ------	UNKNOWN
343.3602  82.1719    0.5  28.6   13.9   2.9036  23.7 ------	UNKNOWN
Post-slew image of 15-350 keV band
Time interval of the image:
80.660600 962.832100

# RAcent  DECcent POSerr Theta    Phi  PeakCts   SNR AngSep     Name
#  [deg]    [deg]    ['] [deg]  [deg]                   [']
326.1141  38.1904    6.0  44.4   43.4   3.3511   1.9    8.3	Cyg X-2
332.4821  37.3046    3.0  45.0   36.2   6.2032   3.8 ------	UNKNOWN
335.4767  41.4141    3.0  40.8   33.0   4.5489   3.9 ------	UNKNOWN
356.2407  42.7089    3.3  39.7    9.1   3.1586   3.5 ------	UNKNOWN
353.0786  59.6582    3.6  22.7   11.2   1.7956   3.2 ------	UNKNOWN
187.2648  45.9384    2.4  51.3 -177.2   8.2067   4.9 ------	UNKNOWN
166.8424  39.0542    4.9  58.8 -159.2  10.7539   2.3 ------	UNKNOWN
163.6483  38.4241    3.2  59.4 -156.3  18.6498   3.6 ------	UNKNOWN
Plot creation:
Sat May 30 16:18:49 EDT 2015