Click here for the BAT GCN circular template
Image
Pre-slew 15.0-350.0 keV image (Event data)
#   RAcent    DECcent   POSerr    Theta     Phi              Peak Cts       SNR   Name
  184.4189   -37.0712   0.0204    48.3667  -144.0243         1.3000272      9.434 TRIG_00559132

Foreground time interval of the image:
-10.280  10.040 (delta_t =  20.320 [sec])
Background time interval of the image:
-239.176 -10.280 (delta_t = 228.896 [sec])
Lightcurves
Notes:
- 1) The mask-weighted light curves are using the flight position.
- 2) Multiple plots of different time binning/intervals are shown to cover all scenarios of short/long GRBs, rate/image triggers, and real/false positives.
- 3) For all the mask-weighted lightcurves, the y-axis units are counts/sec/det where a det is 0.4 x 0.4 = 0.16 sq cm.
- 4) The verticle lines correspond to following: green dotted lines are T50 interval, black dotted lines are T90 interval, blue solid line(s) is a spacecraft slew start time, and orange solid line(s) is a spacecraft slew end time.
- 5) Time of each bin is in the middle of the bin.
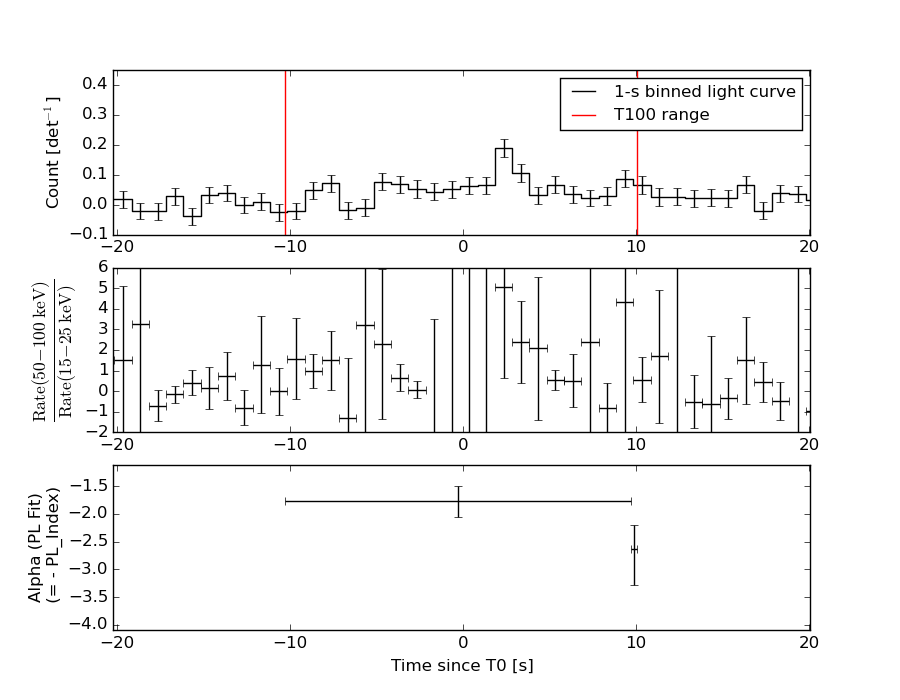
1 s binning
From T0-310 s to T0+310 s

From T100_start - 20 s to T100_end + 30 s
Full time interval
64 ms binning
Full time interval
From T100_start to T100_end

From T0-5 sec to T0+5 sec
16 ms binning
From T100_start-5 s to T100_start+5 s
Blue+Cyan dotted lines: Time interval of the scaled map
From 0.000000 to 4.096000
8 ms binning
From T100_start-3 s to T100_start+3 s
Blue+Cyan dotted lines: Time interval of the scaled map
From 0.000000 to 4.096000
2 ms binning
From T100_start-1 s to T100_start+1 s
Blue+Cyan dotted lines: Time interval of the scaled map
From 0.000000 to 4.096000
SN=5 or 10 sec. binning (whichever binning is satisfied first)
SN=5 or 10 sec. binning (T < 200 sec)

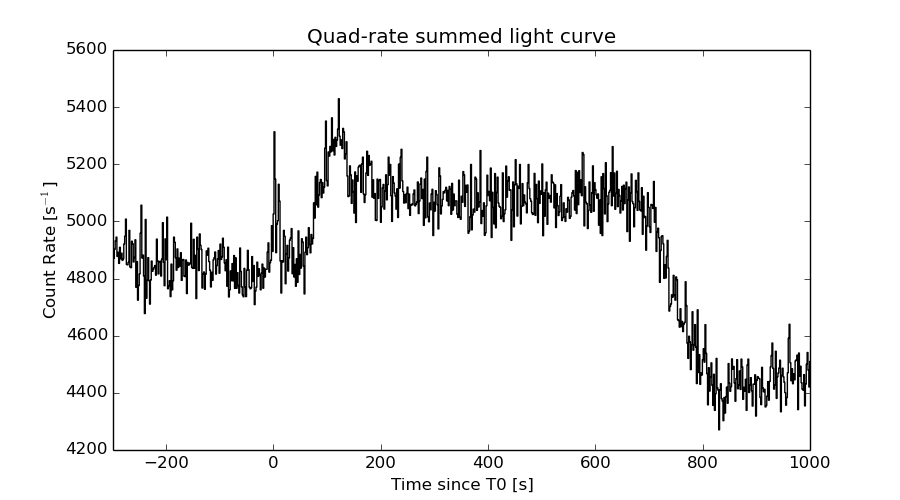
Quad-rate summed light curves (from T0-300s to T0+1000s)
Spectral Evolution
Spectra
Notes:
- 1) The fitting includes the systematic errors.
- 2) When the burst includes telescope slew time periods, the fitting uses an average response file made from multiple 5-s response files through out the slew time plus single time preiod for the non-slew times, and weighted by the total counts in the corresponding time period using addrmf. An average response file is needed becuase a spectral fit using the pre-slew DRM will introduce some errors in both a spectral shape and a normalization if the PHA file contains a lot of the slew/post-slew time interval.
- 3) For fits to more complicated models (e.g. a power-law over a cutoff power-law), the BAT team has decided to require a chi-square improvement of more than 6 for each extra dof.
Time averaged spectrum fit using the average DRM
Power-law model
Time interval is from  -10.280 sec. to   10.040 sec.

Spectral model in power-law:
------------------------------------------------------------
Parameters  : value       lower 90%   higher 90%
Photon index: 1.75039     ( -0.255014   0.262697 )
Norm@50keV  : 4.08684E-03    ( -0.000757801   0.000752675 )
------------------------------------------------------------
#Fit statistic : Chi-Squared =          98.46 using 59 PHA bins.
# Reduced chi-squared =          1.727 for     57 degrees of freedom
# Null hypothesis probability =   5.385711e-04

Photon flux (15-150 keV)    in 20.32 sec: 0.552868 ( -0.0997188  0.100277 ) ph/cm2/s
Energy fluence (15-150 keV)             : 7.6581e-07 ( -1.44076e-07  1.46051e-07 ) ergs/cm2
Cutoff power-law model

Time interval is from  -10.280 sec. to   10.040 sec.
Spectral model in the cutoff power-law:
------------------------------------------------------------
Parameters  : value       lower 90%   higher 90%
Photon index: -1.05158     ( -1.7333   1.32986 )
Epeak [keV] : 52.0136      ( -8.00801 10.6001 )
Norm@50keV  : 0.115584    ( -0.116907   0.777877 )
------------------------------------------------------------
#Fit statistic : Chi-Squared =          81.82 using 59 PHA bins.
# Reduced chi-squared =          1.461 for     56 degrees of freedom
# Null hypothesis probability =   1.380233e-02

Photon flux (15-150 keV)    in 20.32 sec: 0.514605 ( -0.09618  0.098078 ) ph/cm2/s
Energy fluence (15-150 keV)             : 6.92902e-07 ( -1.30753e-07  7.50661e-08 ) ergs/cm2
Band function
Time interval is from  -10.280 sec. to   10.040 sec.

Spectral model in the Band function:
------------------------------------------------------------
Parameters  : value       lower 90%   higher 90%
alpha       : 1.08532   ( -0.85299   2.60788 )
beta        : -10.0000    ( 10   3.55271e-15 )
Epeak [keV] : 51.8851      ( -7.91726 10.6932 )
Norm@50keV   : 0.120650    ( -0.120641   0.394632 )
------------------------------------------------------------
#Fit statistic : Chi-Squared =          81.83 using 59 PHA bins.
# Reduced chi-squared =          1.488 for     55 degrees of freedom
# Null hypothesis probability =   1.094801e-02

Photon flux (15-150 keV)    in 20.32 sec:  (    ) ph/cm2/s
Energy fluence (15-150 keV)             : 7.00613e-07 ( -7.00471e-07  -1.36886e-07 ) ergs/cm2
Single BB

Spectral model blackbody:
------------------------------------------------------------
Parameters  : value    Lower 90%  Upper 90%
kT [keV]    : 13.3182  (-1.9686  2.25345)
R^2/D10^2   : 0.103428  (-0.0462304   0.0837072)
(R is the radius in km and D10 is the distance to the source in units of 10 kpc)
------------------------------------------------------------
#Fit statistic : Chi-Squared =          82.17 using 59 PHA bins.
# Reduced chi-squared =          1.442 for     57 degrees of freedom
# Null hypothesis probability =   1.619430e-02

Energy  Fluence     90% Error
[keV]   [erg/cm2]   [erg/cm2]
15- 25  7.901e-08   2.752e-08
25- 50  2.792e-07   6.766e-08
50-150  3.175e-07   1.199e-07
15-150  6.757e-07   1.575e-07
Thermal bremsstrahlung (OTTB)
Spectral model: thermal bremsstrahlung
------------------------------------------------------------
Parameters  : value         Lower 90%    Upper 90%
kT [keV]    : 96.2800       (-34.814      82.0386)
Norm        : 2.58021       (-0.541612     0.66139)
------------------------------------------------------------
#Fit statistic : Chi-Squared =          91.96 using 59 PHA bins.
# Reduced chi-squared =          1.613 for     57 degrees of freedom
# Null hypothesis probability =   2.298952e-03

Energy  Fluence     90% Error
[keV]   [erg/cm2]   [erg/cm2]
15- 25  1.370e-07   3.330e-08
25- 50  2.351e-07   6.133e-08
50-150  3.727e-07   2.264e-07
15-150  7.448e-07   2.400e-07
Double BB
Spectral model: bbodyrad<1> + bbodyrad<2>
------------------------------------------------------------
Parameters  : value         Lower 90%    Upper 90%
kT1 [keV]   : 7.10787        (-7.28997      16.4895)
R1^2/D10^2  : 0.246552        (-0.244741      -0.244741)
kT2 [keV]   : 14.9803        (-15.018      184.949)
R2^2/D10^2  : 5.67559E-02    (-0.0564959   0.115457)
------------------------------------------------------------
#Fit statistic : Chi-Squared =          81.46 using 59 PHA bins.
# Reduced chi-squared =          1.481 for     55 degrees of freedom
# Null hypothesis probability =   1.174402e-02

Energy  Fluence     90% Error
[keV]   [erg/cm2]   [erg/cm2]
15- 25  9.550e-08   5.856e-08
25- 50  2.733e-07   1.512e-07
50-150  3.385e-07   2.084e-07
15-150  7.073e-07   3.879e-07
Peak spectrum fit
Power-law model
Time interval is from    1.596 sec. to    2.596 sec.

Spectral model in power-law:
------------------------------------------------------------
Parameters  : value       lower 90%   higher 90%
Photon index: 1.49095     ( -0.37959   0.387964 )
Norm@50keV  : 1.39527E-02    ( -0.00352466   0.00351967 )
------------------------------------------------------------
#Fit statistic : Chi-Squared =          57.03 using 59 PHA bins.
# Reduced chi-squared =          1.000 for     57 degrees of freedom
# Null hypothesis probability =   4.740418e-01

Photon flux (15-150 keV)    in 1 sec: 1.73775 ( -0.45468  0.459316 ) ph/cm2/s
Energy fluence (15-150 keV)             : 1.32551e-07 ( -3.49077e-08  3.52743e-08 ) ergs/cm2
Cutoff power-law model
Time interval is from    1.596 sec. to    2.596 sec.
Spectral model in the cutoff power-law:
------------------------------------------------------------
Parameters  : value       lower 90%   higher 90%
Photon index: -0.632554     ( -3.09969   1.8281 )
Epeak [keV] : 65.8542      ( -16.7231 77.9372 )
Norm@50keV  : 0.142560    ( -0.142559   3.88657 )
------------------------------------------------------------
#Fit statistic : Chi-Squared =          52.86 using 59 PHA bins.
# Reduced chi-squared =         0.9439 for     56 degrees of freedom
# Null hypothesis probability =   5.944558e-01

Photon flux (15-150 keV)    in 1 sec: 1.61911 ( -0.45152  0.46589 ) ph/cm2/s
Energy fluence (15-150 keV)             : 1.23685e-07 ( -3.56891e-08  3.7006e-08 ) ergs/cm2
Band function
Time interval is from    1.596 sec. to    2.596 sec.

Spectral model in the Band function:
------------------------------------------------------------
Parameters  : value       lower 90%   higher 90%
alpha       : 0.633659   ( -1.42455   -0.181444 )
beta        : -10.0000    ( 10   1.06581e-14 )
Epeak [keV] : 65.8356      ( -16.2957 77.9584 )
Norm@50keV   : 0.142761    ( -0.142761   3.91392 )
------------------------------------------------------------
#Fit statistic : Chi-Squared =          52.86 using 59 PHA bins.
# Reduced chi-squared =         0.9611 for     55 degrees of freedom
# Null hypothesis probability =   5.567972e-01

Photon flux (15-150 keV)    in 1 sec:  (    ) ph/cm2/s
Energy fluence (15-150 keV)             : 1.23674e-07 ( 0  0 ) ergs/cm2
Single BB
Spectral model blackbody:
------------------------------------------------------------
Parameters  : value    Lower 90%  Upper 90%
kT [keV]    : 15.9936  (-3.52874  4.70668)
R^2/D10^2   : 0.174223  (-0.105861   0.245163)
(R is the radius in km and D10 is the distance to the source in units of 10 kpc)
------------------------------------------------------------
#Fit statistic : Chi-Squared =          53.24 using 59 PHA bins.
# Reduced chi-squared =         0.9340 for     57 degrees of freedom
# Null hypothesis probability =   6.169698e-01

Energy  Fluence     90% Error
[keV]   [erg/cm2]   [erg/cm2]
15- 25  9.215e-09   4.986e-09
25- 50  3.876e-08   1.545e-08
50-150  6.930e-08   3.365e-08
15-150  1.173e-07   5.097e-08
Thermal bremsstrahlung (OTTB)
Spectral model: thermal bremsstrahlung
------------------------------------------------------------
Parameters  : value         Lower 90%    Upper 90%
kT [keV]    : 199.352       (-117.773      -199.362)
Norm        : 7.29672       (-1.80949     2.14328)
------------------------------------------------------------
#Fit statistic : Chi-Squared =          55.81 using 59 PHA bins.
# Reduced chi-squared =         0.9792 for     57 degrees of freedom
# Null hypothesis probability =   5.196344e-01

Energy  Fluence     90% Error
[keV]   [erg/cm2]   [erg/cm2]
15- 25  1.817e-08   1.104e-08
25- 50  3.495e-08   2.058e-08
50-150  7.665e-08   4.548e-08
15-150  1.298e-07   7.855e-08
Double BB
Spectral model: bbodyrad<1> + bbodyrad<2>
------------------------------------------------------------
Parameters  : value         Lower 90%    Upper 90%
kT1 [keV]   : 9.39913        (-9.46496      -9.46496)
R1^2/D10^2  : 0.392949        (-0.37786      -0.37786)
kT2 [keV]   : 19.8065        (-20.0529      -20.0529)
R2^2/D10^2  : 6.17747E-02    (-0.0560323   0.331013)
------------------------------------------------------------
#Fit statistic : Chi-Squared =          52.77 using 59 PHA bins.
# Reduced chi-squared =         0.9594 for     55 degrees of freedom
# Null hypothesis probability =   5.604663e-01

Energy  Fluence     90% Error
[keV]   [erg/cm2]   [erg/cm2]
15- 25  1.159e-08   9.530e-09
25- 50  3.889e-08   3.448e-08
50-150  7.422e-08   5.730e-08
15-150  1.247e-07   1.107e-07
Pre-slew spectrum (Pre-slew PHA with pre-slew DRM)
Power-law model
Spectral model in power-law:
------------------------------------------------------------
Parameters  : value       lower 90%   higher 90%
Photon index: 1.75039     ( -0.255014   0.262697 )
Norm@50keV  : 4.08684E-03    ( -0.000757801   0.000752675 )
------------------------------------------------------------
#Fit statistic : Chi-Squared =          98.46 using 59 PHA bins.
# Reduced chi-squared =          1.727 for     57 degrees of freedom
# Null hypothesis probability =   5.385711e-04

Photon flux (15-150 keV)    in 20.32 sec: 0.552868 ( -0.0997188  0.100277 ) ph/cm2/s
Energy fluence (15-150 keV)             : 7.6581e-07 ( -1.44076e-07  1.46051e-07 ) ergs/cm2
Cutoff power-law model

Spectral model in the cutoff power-law:
------------------------------------------------------------
Parameters  : value       lower 90%   higher 90%
Photon index: -1.05158     ( -1.7333   1.32986 )
Epeak [keV] : 52.0136      ( -8.00801 10.6001 )
Norm@50keV  : 0.115584    ( -0.116907   0.777877 )
------------------------------------------------------------
#Fit statistic : Chi-Squared =          81.82 using 59 PHA bins.
# Reduced chi-squared =          1.461 for     56 degrees of freedom
# Null hypothesis probability =   1.380233e-02

Photon flux (15-150 keV)    in 20.32 sec: 0.514605 ( -0.09618  0.098078 ) ph/cm2/s
Energy fluence (15-150 keV)             : 6.92902e-07 ( -1.30753e-07  7.50661e-08 ) ergs/cm2
Band function

Spectral model in the Band function:
------------------------------------------------------------
Parameters  : value       lower 90%   higher 90%
alpha       : 1.08532   ( -0.85299   2.60788 )
beta        : -10.0000    ( 10   3.55271e-15 )
Epeak [keV] : 51.8851      ( -7.91726 10.6932 )
Norm@50keV   : 0.120650    ( -0.120641   0.394632 )
------------------------------------------------------------
#Fit statistic : Chi-Squared =          81.83 using 59 PHA bins.
# Reduced chi-squared =          1.488 for     55 degrees of freedom
# Null hypothesis probability =   1.094801e-02

Photon flux (15-150 keV)    in 20.32 sec:  (    ) ph/cm2/s
Energy fluence (15-150 keV)             : 7.00613e-07 ( -7.00471e-07  -1.36886e-07 ) ergs/cm2
S(25-50 keV) vs. S(50-100 keV) plot
S(25-50 keV)  = 2.12e-07
S(50-100 keV) = 2.51e-07
T90 vs. Hardness ratio plot
T90                                   = 18.0480000376701 sec.
Hardness ratio (energy fluence ratio) = 1.18396
Color vs. Color plot
Count Ratio  (25-50 keV) / (15-25 keV) = 3.21952
Count Ratio (50-100 keV) / (15-25 keV) = 2.10714
Mask shadow pattern

IMX = -9.104329731323985E-01, IMY = 6.608788957985384E-01
TIME vs. PHA plot around the trigger time
Blue+Cyan dotted lines: Time interval of the scaled map
From 0.000000 to 4.096000
TIME vs. DetID plot around the trigger time
Blue+Cyan dotted lines: Time interval of the scaled map
From 0.000000 to 4.096000
100 us light curve (15-350 keV)
Blue+Cyan dotted lines: Time interval of the scaled map
From 0.000000 to 4.096000
Spacecraft aspect plot
Bright source in the pre-burst/pre-slew/post-slew images
Pre-burst image of 15-350 keV band
Time interval of the image:
-239.176000 -10.280000

# RAcent  DECcent POSerr Theta    Phi  PeakCts   SNR AngSep     Name
#  [deg]    [deg]    ['] [deg]  [deg]                   [']
244.9831 -15.6454    0.3  17.7  101.9  11.3510  42.1    0.4	Sco X-1
254.3750  35.2889    6.0  50.8   16.1   1.8119   1.9    5.2	Her X-1
255.8822 -37.8712    8.0  38.1  131.9   0.8678   1.4    5.2	4U 1700-377
256.2576 -36.4579    4.0  37.4  129.8   1.7294   2.9    8.8	GX 349+2
262.9128 -24.7268    4.3  36.6  108.1   1.7730   2.7    5.4	GX 1+4
263.0826 -33.7688    5.6  40.5  121.2  -1.8798  -2.1    6.1	GX 354-0
226.2139   7.2677    3.0  16.5  -18.4   0.8877   3.8 ------	UNKNOWN
209.0932 -26.5055    3.4  25.1 -148.0   0.9356   3.4 ------	UNKNOWN
190.1610 -38.4027    3.2  44.9 -148.5   1.6690   3.6 ------	UNKNOWN
179.8869 -54.8989    3.8  59.5 -161.7   6.4148   3.1 ------	UNKNOWN
Pre-slew background subtracted image of 15-350 keV band
Time interval of the image:
-10.280000 10.040000

# RAcent  DECcent POSerr Theta    Phi  PeakCts   SNR AngSep     Name
#  [deg]    [deg]    ['] [deg]  [deg]                   [']
244.9368 -15.6251    4.3  17.6  101.8  -0.1686  -2.7    2.6	Sco X-1
254.5279  35.2993  316.6  50.9   16.3   0.0080   0.0    4.3	Her X-1
256.1160 -37.8709    6.2  38.2  131.7  -0.2496  -1.9    6.3	4U 1700-377
256.4626 -36.2872   16.4  37.4  129.4   0.0902   0.7    8.3	GX 349+2
262.9384 -24.8347    4.7  36.6  108.3  -0.3564  -2.5    6.6	GX 1+4
263.0002 -33.7067    6.9  40.4  121.2   0.3302   1.7    7.7	GX 354-0
267.6754   0.2295    2.0  40.4   67.2   1.1895   5.7 ------	UNKNOWN
184.4194 -37.0728    1.2  48.4 -144.0   1.2908   9.4 ------	UNKNOWN
Post-slew image of 15-350 keV band
Time interval of the image:
150.924590 707.724600

# RAcent  DECcent POSerr Theta    Phi  PeakCts   SNR AngSep     Name
#  [deg]    [deg]    ['] [deg]  [deg]                   [']
244.9697 -15.6373    0.3  34.0  155.5  29.5518  35.2    0.6	Sco X-1
256.0690 -37.8508    6.8  36.9  113.2   2.5300   1.7    3.9	4U 1700-377
256.4112 -36.3488    4.5  35.5  114.5   3.3708   2.5    4.6	GX 349+2
263.0512 -24.9060    2.7  23.2  121.2   2.6471   4.3    9.9	GX 1+4
264.7079 -44.5980    7.7  39.3   98.5  -2.8196  -1.5    9.0	4U 1735-44
268.2345  -1.5834    5.3  11.8 -159.3   1.1389   2.2   11.2	SW J1753.5-0127
270.2413 -25.0958    3.5  19.6  106.1   2.0580   3.3    2.5	GX 5-1
270.3764 -25.6034    7.8  20.0  105.1   0.9471   1.5    9.3	GRS 1758-258
273.9956 -14.0102    2.1   8.2  116.4   2.8207   5.5    1.7	GX 17+2
275.9528 -30.4084   10.0  23.3   88.7   0.8751   1.2    2.9	H1820-303
285.2128 -24.7833    0.0  18.7   64.0   1.1286   2.0   12.7	HT1900.1-2455
288.7947  10.9000    1.7  20.7  -68.0   5.0157   6.9    2.7	GRS 1915+105
262.9964 -33.8347   16.9  30.3  109.2   0.7297   0.7    0.4	GX 354-0
244.1571 -35.7327    2.8  42.5  125.7   9.5113   4.1 ------	UNKNOWN
319.5209   5.9803    3.5  42.8  -24.1   3.0330   3.3 ------	UNKNOWN
225.4690  19.4029    4.8  58.7 -159.3   9.6560   2.4 ------	UNKNOWN
320.4225  22.7505    4.2  50.6  -44.6  11.1802   2.8 ------	UNKNOWN
258.2225  33.7426    2.7  45.3 -121.3  12.0177   4.4 ------	UNKNOWN
272.7144  34.1488    3.0  41.7 -104.6  11.8712   3.8 ------	UNKNOWN
244.0700  31.7304    2.8  51.1 -135.6  13.6699   4.1 ------	UNKNOWN
Plot creation:
Sat May 30 16:15:09 EDT 2015