Click here for the BAT GCN circular template
Image
Pre-slew 15-350 keV image (Event data; bkg subtracted)

#   RAcent  DECcent POSerr  Theta    Phi     Peak Cts     SNR  Name
  268.6824 -26.3286 0.0299    4.9  134.5       0.8330     6.4  TRIG_00559221
------------------------------------------

Foreground time interval of the image:
-19.899  72.501 (delta_t =  92.400 [sec])
Background time interval of the image:
Lightcurves
Notes:
- 1) All plots contain as much data as has been downloaded to date.
- 2) The mask-weighted light curves are using the flight position.
- 3) Multiple plots of different time binning/intervals are shown to cover all scenarios of short/long GRBs, rate/image triggers, and real/false positives.
- 4) For all the mask-weighted lightcurves, the y-axis units are counts/sec/det where a det is 0.4 x 0.4 = 0.16 sq cm.
- 5) The verticle lines correspond to following: green dotted lines are T50 interval, black dotted lines are T90 interval, blue solid line(s) is a spacecraft slew start time, and orange solid line(s) is a spacecraft slew end time.
- 6) Time of each bin is in the middle of the bin.
1 s binning
From T0-310 s to T0+310 s

From T100_start - 20 s to T100_end + 30 s

Full time interval

64 ms binning
Full time interval

From T100_start to T100_end

From T0-5 sec to T0+5 sec

16 ms binning
From T100_start-5 s to T100_start+5 s

Blue+Cyan dotted lines: Time interval of the scaled map
From 0.000000 to 64.000000
8 ms binning
From T100_start-3 s to T100_start+3 s
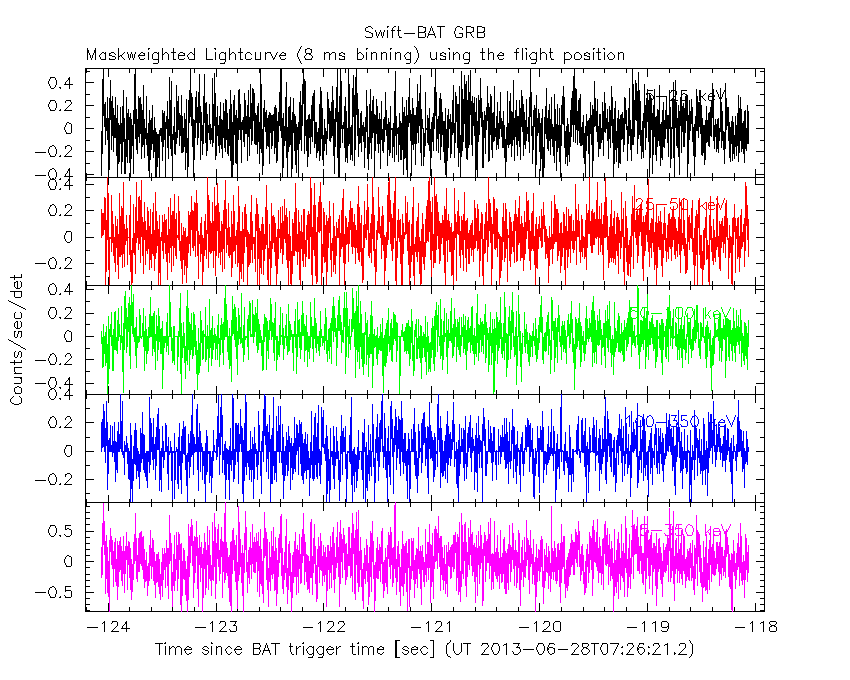
Blue+Cyan dotted lines: Time interval of the scaled map
From 0.000000 to 64.000000
2 ms binning
From T100_start-1 s to T100_start+1 s
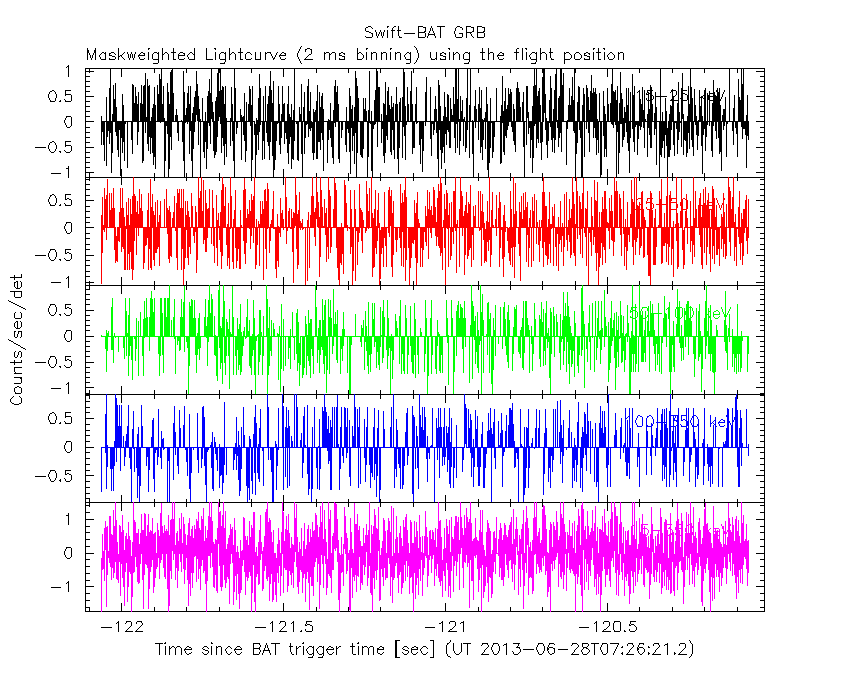
Blue+Cyan dotted lines: Time interval of the scaled map
From 0.000000 to 64.000000
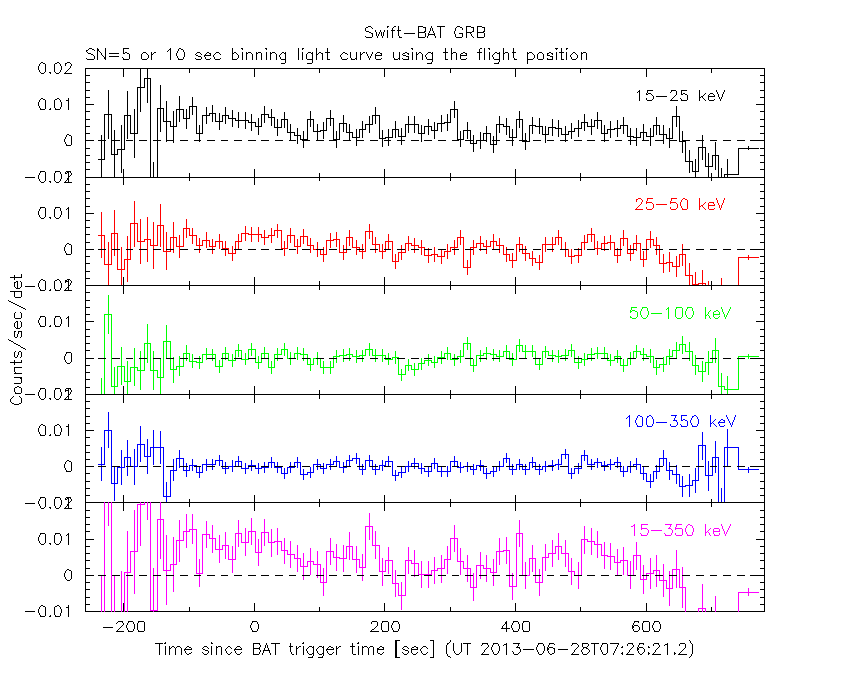
SN=5 or 10 sec. binning (whichever binning is satisfied first)
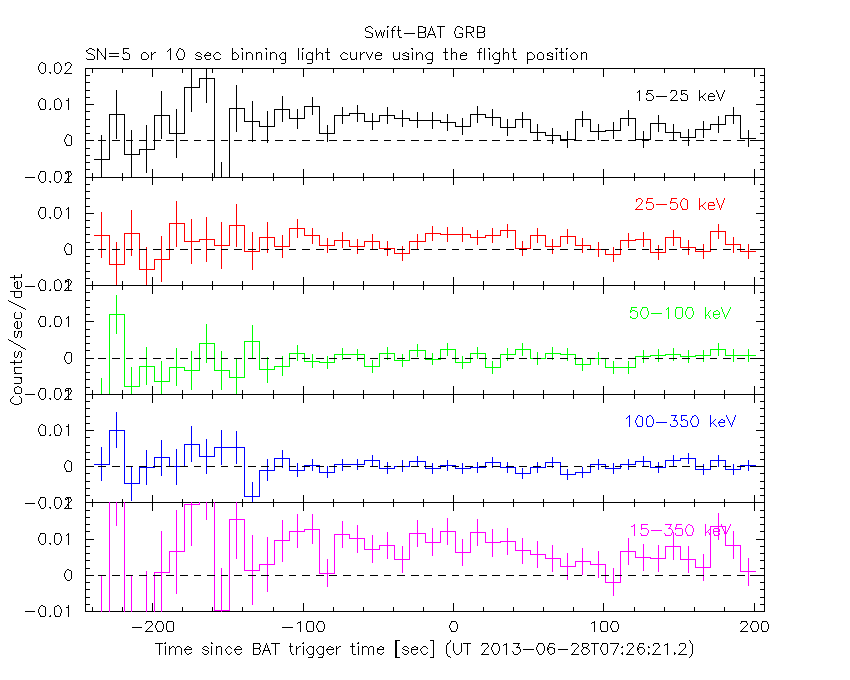
SN=5 or 10 sec. binning (T < 200 sec)
Spectra
Notes:
- 1) The fitting includes the systematic errors.
- 2) For long bursts, a spectral fit of the pre-slew DRM will introduce some errors in both a spectral shape and a normalization if the PHA file contains a lot of the slew/post-slew time interval.
- 3) For fits to more complicated models (e.g. a power-law over a cutoff power-law), the BAT team has decided to require a chi-square improvement of more than 6 for each extra dof.
- 4) For short bursts (T90<1sec), the specrtum is also fit with Blackbody, OTTB, and Double Blackbody.
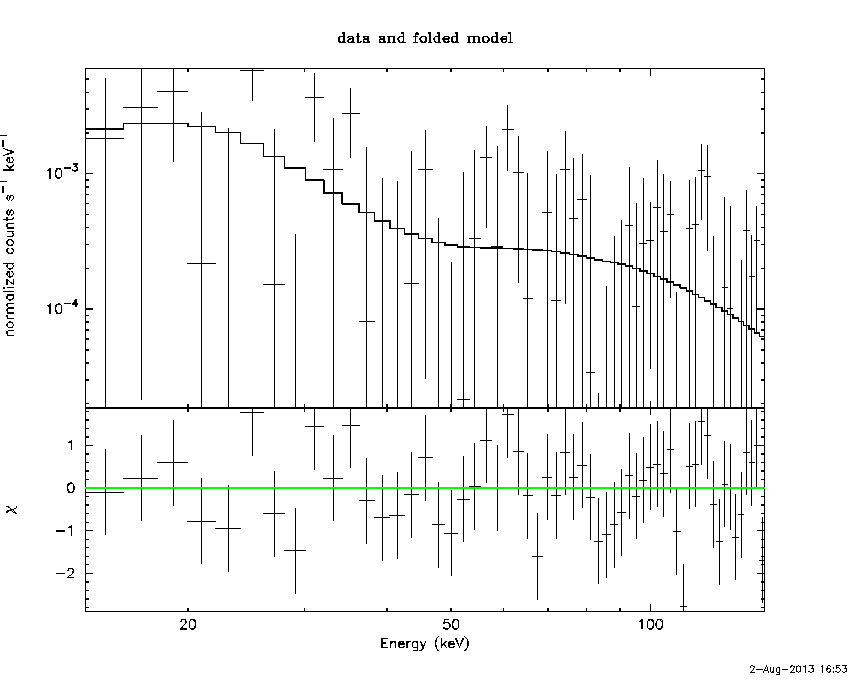
Time averaged spectrum fit using the pre-slew DRM
Power-law model
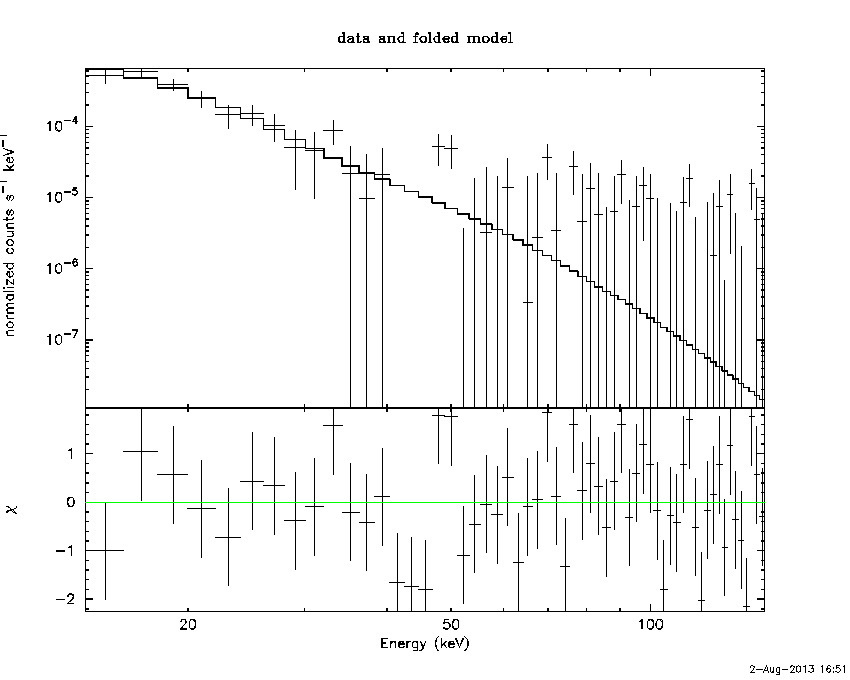
Time interval is from -121.064 sec. to  666.148 sec.

Spectral model in power-law:
------------------------------------------------------------
Parameters  : value       lower 90%   higher 90%
Photon index: 4.32718     ( -0.569753   0.649333 )
Norm@50keV  : 4.83583E-05    ( -2.34907e-05   3.38406e-05 )
------------------------------------------------------------
#Fit statistic : Chi-Squared =          62.02 using 59 PHA bins.
# Reduced chi-squared =          1.088 for     57 degrees of freedom
# Null hypothesis probability =   3.018596e-01

Photon flux (15-150 keV)    in 787.2 sec: 3.98906E-02 ( -0.0059763  0.00598477 ) ph/cm2/s
Energy fluence (15-150 keV)             : 1.07426e-06 ( -1.85236e-07  1.96125e-07 ) ergs/cm2
Cutoff power-law model
Time interval is from -121.064 sec. to  666.148 sec.
Spectral model in the cutoff power-law:
------------------------------------------------------------
Parameters  : value       lower 90%   higher 90%
Photon index: 1.00000     (     )
Epeak [keV] : 50.0000      (   )
Norm@50keV  : 5.31627E-04    (     )
------------------------------------------------------------
#Fit statistic : Chi-Squared =         132.20 using 59 PHA bins.
# Reduced chi-squared =         2.3608 for     56 degrees of freedom
# Null hypothesis probability =   4.190883e-08

Photon flux (15-150 keV)    in 787.2 sec: 3.93471E-02 ( -0.0058424  0.0057942 ) ph/cm2/s
Energy fluence (15-150 keV)             : 1.0036e-06 ( -1.6469e-07  2.37404e-07 ) ergs/cm2
Band function

Time interval is from -121.064 sec. to  666.148 sec.

Spectral model in the Band function:
------------------------------------------------------------
Parameters  : value       lower 90%   higher 90%
alpha       : -8.22113   ( 8.22113   8.22113 )
beta        : -4.32719    ( -0.649224   0.569486 )
Epeak [keV] : 3.02898      ( -3.02898 -3.02898 )
Norm@50keV   : 6.57252E-03    ( -0.00319265   0.00459947 )
------------------------------------------------------------
#Fit statistic : Chi-Squared =          62.02 using 59 PHA bins.
# Reduced chi-squared =          1.128 for     55 degrees of freedom
# Null hypothesis probability =   2.401705e-01

Photon flux (15-150 keV)    in 787.2 sec:  (    ) ph/cm2/s
Energy fluence (15-150 keV)             : 0 ( 0  0 ) ergs/cm2
Single BB

Spectral model blackbody:
------------------------------------------------------------
Parameters  : value    Lower 90%  Upper 90%
kT [keV]    : 3.30828  (-0.479651  0.574578)
R^2/D10^2   : 3.02732  (-1.84395   5.04278)
(R is the radius in km and D10 is the distance to the source in units of 10 kpc)
------------------------------------------------------------
#Fit statistic : Chi-Squared =          62.57 using 59 PHA bins.
# Reduced chi-squared =          1.098 for     57 degrees of freedom
# Null hypothesis probability =   2.851976e-01

Energy  Fluence     90% Error
[keV]   [erg/cm2]   [erg/cm2]
15- 25  7.977e-07   3.367e-07
25- 50  1.616e-07   8.499e-08
50-150  5.541e-10   5.411e-10
15-150  9.600e-07   3.372e-07
Thermal bremsstrahlung (OTTB)

Spectral model: thermal bremsstrahlung
------------------------------------------------------------
Parameters  : value         Lower 90%    Upper 90%
kT [keV]    : 7.34413       (-1.66892      2.36922)
Norm        : 2.79141       (-1.36447     3.01632)
------------------------------------------------------------
#Fit statistic : Chi-Squared =          61.35 using 59 PHA bins.
# Reduced chi-squared =          1.076 for     57 degrees of freedom
# Null hypothesis probability =   3.228403e-01

Energy  Fluence     90% Error
[keV]   [erg/cm2]   [erg/cm2]
15- 25  7.809e-07   2.870e-07
25- 50  2.107e-07   9.542e-08
50-150  5.549e-09   4.978e-09
15-150  9.971e-07   3.397e-07
Double BB

Spectral model: bbodyrad<1> + bbodyrad<2>
------------------------------------------------------------
Parameters  : value         Lower 90%    Upper 90%
kT1 [keV]   : 3.21927        (-3.21653      0.579631)
R1^2/D10^2  : 3.50504        (-2.1923      346.453)
kT2 [keV]   : 28.7016        (-28.3226      -28.3226)
R2^2/D10^2  : 6.12843E-05    (-6.32899e-05   0.00376758)
------------------------------------------------------------
#Fit statistic : Chi-Squared =          60.90 using 59 PHA bins.
# Reduced chi-squared =          1.107 for     55 degrees of freedom
# Null hypothesis probability =   2.720682e-01

Energy  Fluence     90% Error
[keV]   [erg/cm2]   [erg/cm2]
15- 25  7.955e-07   3.313e-07
25- 50  1.848e-07   8.289e-08
50-150  2.290e-07   1.675e-07
15-150  1.209e-06   6.216e-07
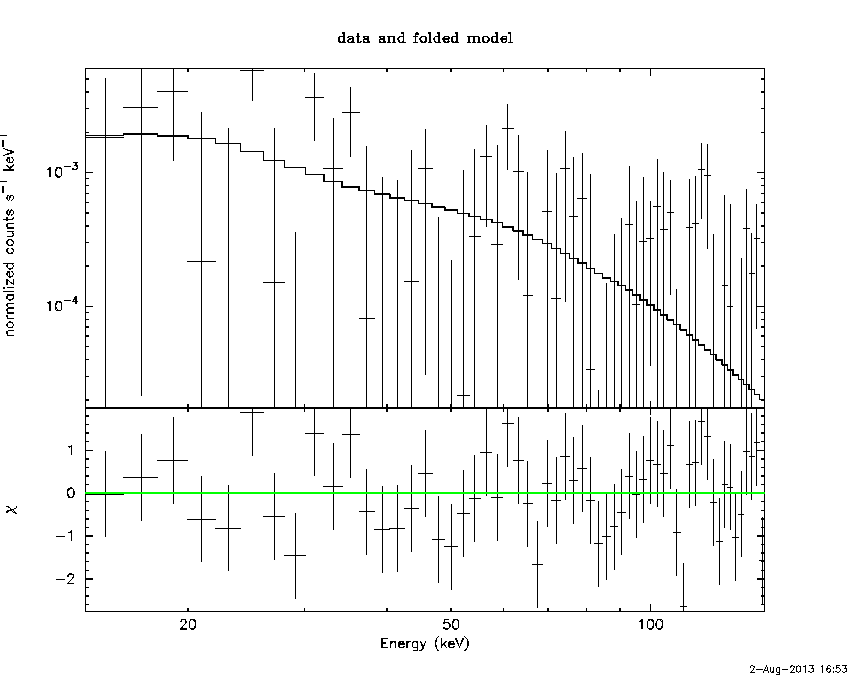
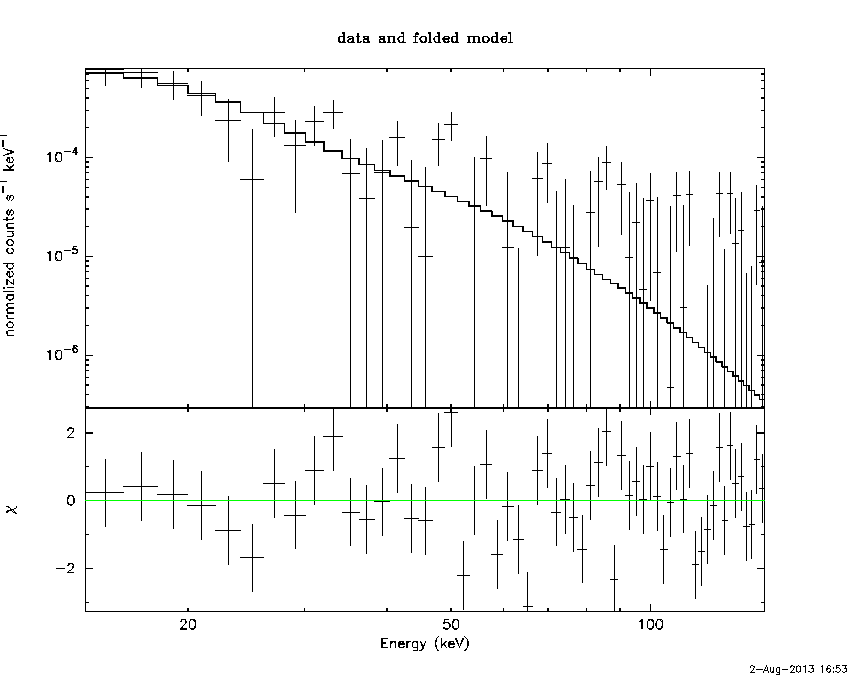
Peak spectrum fit
Power-law model

Time interval is from -119.708 sec. to -118.708 sec.

Spectral model in power-law:
------------------------------------------------------------
Parameters  : value       lower 90%   higher 90%
Photon index: 1.67735     ( -1.6396   1.80201 )
Norm@50keV  : 3.26973E-03    ( -0.00326824   0.00201618 )
------------------------------------------------------------
#Fit statistic : Chi-Squared =          52.28 using 59 PHA bins.
# Reduced chi-squared =         0.9172 for     57 degrees of freedom
# Null hypothesis probability =   6.524663e-01

Photon flux (15-150 keV)    in 1 sec: 0.430970 ( -0.43097  0.252466 ) ph/cm2/s
Energy fluence (15-150 keV)             : 3.03102e-08 ( -2.00602e-08  2.18392e-08 ) ergs/cm2
Cutoff power-law model

Time interval is from -119.708 sec. to -118.708 sec.
Spectral model in the cutoff power-law:
------------------------------------------------------------
Parameters  : value       lower 90%   higher 90%
Photon index: 2.10407     ( -4.43511   1.77068 )
Epeak [keV] : 40.5763      (   )
Norm@50keV  : 1.88403E-03    (     )
------------------------------------------------------------
#Fit statistic : Chi-Squared =          51.99 using 59 PHA bins.
# Reduced chi-squared =         0.9284 for     56 degrees of freedom
# Null hypothesis probability =   6.272853e-01

Photon flux (15-150 keV)    in 1 sec: 0.434361 ( -0.434361  0.249686 ) ph/cm2/s
Energy fluence (15-150 keV)             : 2.99636e-08 ( -1.97573e-08  2.12655e-08 ) ergs/cm2
Band function
Time interval is from -119.708 sec. to -118.708 sec.

Spectral model in the Band function:
------------------------------------------------------------
Parameters  : value       lower 90%   higher 90%
alpha       : -1.34068   ( 1.34098   1.34098 )
beta        : -1.67701    ( 1.67914   1.63963 )
Epeak [keV] : 21.9280      ( -21.9719 -21.9719 )
Norm@50keV   : 7.57448E-03    ( -0.00758323   5681.59 )
------------------------------------------------------------
#Fit statistic : Chi-Squared =          52.28 using 59 PHA bins.
# Reduced chi-squared =         0.9505 for     55 degrees of freedom
# Null hypothesis probability =   5.792140e-01

Photon flux (15-150 keV)    in 1 sec:  (    ) ph/cm2/s
Energy fluence (15-150 keV)             : 0 ( 0  0 ) ergs/cm2
Single BB
Spectral model blackbody:
------------------------------------------------------------
Parameters  : value    Lower 90%  Upper 90%
kT [keV]    : 7.72642  (-7.80204  -7.80204)
R^2/D10^2   : 0.485489  (-0.454636   59.5113)
(R is the radius in km and D10 is the distance to the source in units of 10 kpc)
------------------------------------------------------------
#Fit statistic : Chi-Squared =          54.56 using 59 PHA bins.
# Reduced chi-squared =         0.9572 for     57 degrees of freedom
# Null hypothesis probability =   5.671526e-01

Energy  Fluence     90% Error
[keV]   [erg/cm2]   [erg/cm2]
15- 25  5.101e-09   3.632e-09
25- 50  8.397e-09   6.720e-09
50-150  1.964e-09   2.142e-09
15-150  1.546e-08   1.162e-08
Thermal bremsstrahlung (OTTB)

Spectral model: thermal bremsstrahlung
------------------------------------------------------------
Parameters  : value         Lower 90%    Upper 90%
kT [keV]    : 199.332       (-199.348      -199.348)
Norm        : 1.69453       (-0.986484     6.60096)
------------------------------------------------------------
#Fit statistic : Chi-Squared =          52.58 using 59 PHA bins.
# Reduced chi-squared =         0.9225 for     57 degrees of freedom
# Null hypothesis probability =   6.414229e-01

Energy  Fluence     90% Error
[keV]   [erg/cm2]   [erg/cm2]
15- 25  4.220e-09   2.913e-09
25- 50  8.117e-09   5.485e-09
50-150  1.780e-08   1.281e-08
15-150  3.014e-08   2.135e-08
Double BB
Spectral model: bbodyrad<1> + bbodyrad<2>
------------------------------------------------------------
Parameters  : value         Lower 90%    Upper 90%
kT1 [keV]   : 5.45699        (-4.14698      11.0397)
R1^2/D10^2  : 1.79260        (-1.77287      756.206)
kT2 [keV]   : 75.0605        (-75.0597      -75.0598)
R2^2/D10^2  : 4.10650E-04    (-0.000400474   0.175584)
------------------------------------------------------------
#Fit statistic : Chi-Squared =          51.33 using 59 PHA bins.
# Reduced chi-squared =         0.9333 for     55 degrees of freedom
# Null hypothesis probability =   6.156534e-01

Energy  Fluence     90% Error
[keV]   [erg/cm2]   [erg/cm2]
15- 25  6.290e-09   3.751e-09
25- 50  6.329e-09   3.574e-09
50-150  2.402e-08   1.758e-08
15-150  3.664e-08   1.953e-08
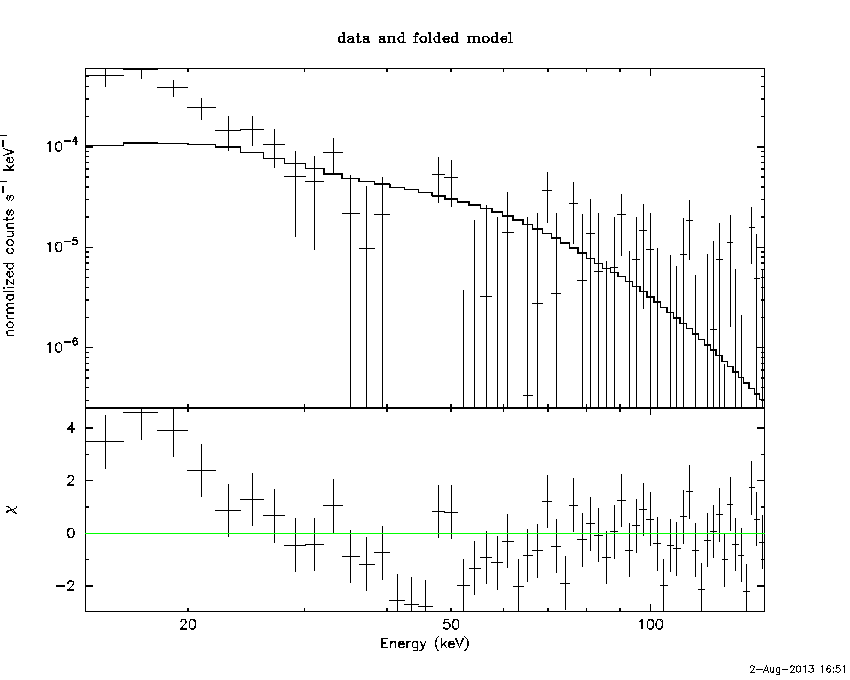
Pre-slew spectrum (Pre-slew PHA with pre-slew DRM)
Power-law model
Spectral model in power-law:
------------------------------------------------------------
Parameters  : value       lower 90%   higher 90%
Photon index: 3.00601     ( -0.550985   0.716941 )
Norm@50keV  : 2.66247E-04    ( -0.000129414   0.000142009 )
------------------------------------------------------------
#Fit statistic : Chi-Squared =          80.78 using 59 PHA bins.
# Reduced chi-squared =          1.417 for     57 degrees of freedom
# Null hypothesis probability =   2.084069e-02

Photon flux (15-150 keV)    in 92.4 sec: 7.35386E-02 ( -0.0152371  0.0152658 ) ph/cm2/s
Energy fluence (15-150 keV)             : 2.96399e-07 ( -7.96526e-08  8.85052e-08 ) ergs/cm2
Cutoff power-law model

Spectral model in the cutoff power-law:
------------------------------------------------------------
Parameters  : value       lower 90%   higher 90%
Photon index: 1.00000     (     )
Epeak [keV] : 50.0000      (   )
Norm@50keV  : 1.36544E-03    (     )
------------------------------------------------------------
#Fit statistic : Chi-Squared =          96.41 using 59 PHA bins.
# Reduced chi-squared =          1.722 for     56 degrees of freedom
# Null hypothesis probability =   6.410211e-04

Photon flux (15-150 keV)    in 92.4 sec: 7.34027E-02 ( -0.0151934  0.0076826 ) ph/cm2/s
Energy fluence (15-150 keV)             : 0 ( 0  0 ) ergs/cm2
Band function

Spectral model in the Band function:
------------------------------------------------------------
Parameters  : value       lower 90%   higher 90%
alpha       : -9.51259   ( 9.51259   9.51259 )
beta        : -3.00600    ( -0.716318   0.550574 )
Epeak [keV] : 2.50132      ( -2.50132 -2.50132 )
Norm@50keV   : 3.61870E-02    ( -0.0175895   0.0193008 )
------------------------------------------------------------
#Fit statistic : Chi-Squared =          80.78 using 59 PHA bins.
# Reduced chi-squared =          1.469 for     55 degrees of freedom
# Null hypothesis probability =   1.337928e-02

Photon flux (15-150 keV)    in 92.4 sec:  (    ) ph/cm2/s
Energy fluence (15-150 keV)             : 0 ( 0  0 ) ergs/cm2
S(25-50 keV) vs. S(50-100 keV) plot

S(25-50 keV)  = 2.63243e-07
S(50-100 keV) = 5.24585e-08
T90 vs. Hardness ratio plot
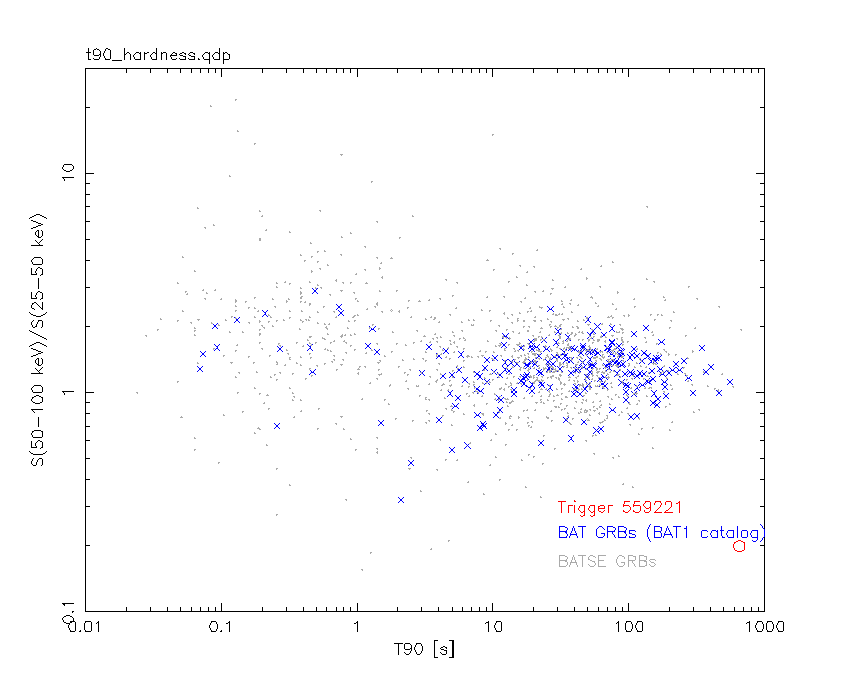
T90                                   = 652.515999913216 sec.
Hardness ratio (energy fluence ratio) = 0.199278
Color vs. Color plot

Count Ratio  (25-50 keV) / (15-25 keV) = 0.211298
Count Ratio (50-100 keV) / (15-25 keV) = 0.0683003
Mask shadow pattern
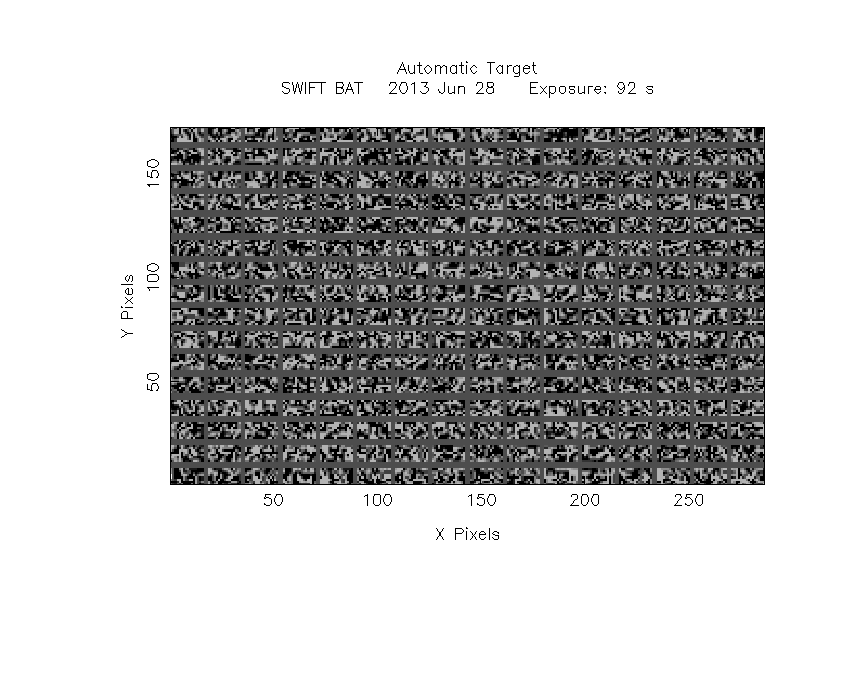
IMX = -5.957298810940925E-02, IMY = -6.071927000023764E-02
TIME vs. PHA plot around the trigger time

Blue+Cyan dotted lines: Time interval of the scaled map
From 0.000000 to 64.000000
TIME vs. DetID plot around the trigger time

Blue+Cyan dotted lines: Time interval of the scaled map
From 0.000000 to 64.000000
100 us light curve (15-350 keV)

Blue+Cyan dotted lines: Time interval of the scaled map
From 0.000000 to 64.000000
Spacecraft aspect plot

Bright source in the pre-burst/pre-slew/post-slew images
Pre-burst image of 15-350 keV band
Time interval of the image:
Pre-slew background subtracted image of 15-350 keV band
Time interval of the image:
-19.899380 72.500610

# RAcent  DECcent POSerr Theta    Phi  PeakCts   SNR AngSep     Name
#  [deg]    [deg]    ['] [deg]  [deg]                   [']
244.9609 -15.6544    0.6  20.1  -17.2   2.3491  19.7    1.4	Sco X-1
255.8887 -37.7178    7.3  12.9 -108.8   0.2054   1.6    8.9	4U 1700-377
256.3669 -36.5882  187.9  11.7 -107.6   0.0078   0.1   10.4	GX 349+2
262.7755 -24.7419    0.0   1.7   29.5  -0.2490  -2.1   12.7	GX 1+4
264.5605 -44.5231  105.6  18.1 -138.8  -0.0138  -0.1    9.0	4U 1735-44
268.2946  -1.5001    7.2  25.4   56.0   0.2676   1.6    5.2	SW J1753.5-0127
270.1554 -24.9854   14.7   6.4  122.8  -0.1077  -0.8    9.0	GX 5-1
270.3119 -25.7172    8.3   6.4  129.5   0.1934   1.4    1.6	GRS 1758-258
274.0129 -13.9277    5.6  16.0   85.2   0.2904   2.1    6.5	GX 17+2
275.8190 -30.4022    6.0  11.7  157.0   0.2408   1.9    5.9	H1820-303
284.8769 -24.9927   12.9  19.5  134.8   0.1191   0.9    9.7	HT1900.1-2455
263.2247 -33.8539    9.4   7.4 -135.6   0.1480   1.2   11.8	GX 354-0
268.6825 -26.3286    1.8   4.9  134.5   0.8331   6.4 ------	UNKNOWN
255.2498 -41.6253    1.8  16.6 -114.4   0.8422   6.2 ------	UNKNOWN
221.4520 -53.7672    2.7  41.1  -99.0   2.6551   4.2 ------	UNKNOWN
Post-slew image of 15-350 keV band
Time interval of the image:
117.300620 783.190000

# RAcent  DECcent POSerr Theta    Phi  PeakCts   SNR AngSep     Name
#  [deg]    [deg]    ['] [deg]  [deg]                   [']
244.9503 -15.6652    1.9  24.5  -49.7  15.0656   6.2    2.3	Sco X-1
255.7754 -37.7857   95.9  15.9 -120.3   0.2580   0.1   10.6	4U 1700-377
256.2587 -36.3041   12.0  14.6 -117.0   2.1733   1.0   11.1	GX 349+2
263.2073 -24.8231    3.3   5.2  -55.6   6.7635   3.5   11.8	GX 1+4
264.6193 -44.6116    6.5  18.6 -151.4   3.5128   1.8   11.0	4U 1735-44
268.5530  -1.5496    0.0  24.7   19.0  -2.9173  -1.4   12.5	SW J1753.5-0127
270.1231 -25.1171    3.3   1.7   67.4   7.2470   3.6    9.0	GX 5-1
270.2869 -25.7316    3.8   1.5   88.9   6.5600   3.3    1.1	GRS 1758-258
274.2060 -14.1220    0.0  13.2   43.4  -2.2201  -1.1   12.7	GX 17+2
275.8614 -30.2279    8.5   7.4  143.2  -2.6741  -1.4    9.0	H1820-303
284.8826 -24.9764    4.6  14.6  107.9   5.3412   2.5    9.0	HT1900.1-2455
288.9495  10.9597    9.8  42.1   49.8   6.2730   1.2    8.9	GRS 1915+105
263.1044 -33.9616   10.0   9.1 -129.7  -2.2970  -1.2    9.5	GX 354-0
272.9684 -13.2314    2.4  13.6   37.2  10.0293   4.8 ------	UNKNOWN
Plot creation:
Fri Aug  2 16:54:43 EDT 2013