Click here for the BAT GCN circular template
Image
Pre-slew 15.0-350.0 keV image (Event data)
#   RAcent    DECcent   POSerr    Theta     Phi              Peak Cts       SNR   Name
  260.6679    -2.9594   0.0098    40.9677    -5.5978         1.8692644     19.820 TRIG_00563213

Foreground time interval of the image:
 -3.964  25.053 (delta_t =  29.017 [sec])
Background time interval of the image:
-239.048  -3.964 (delta_t = 235.084 [sec])
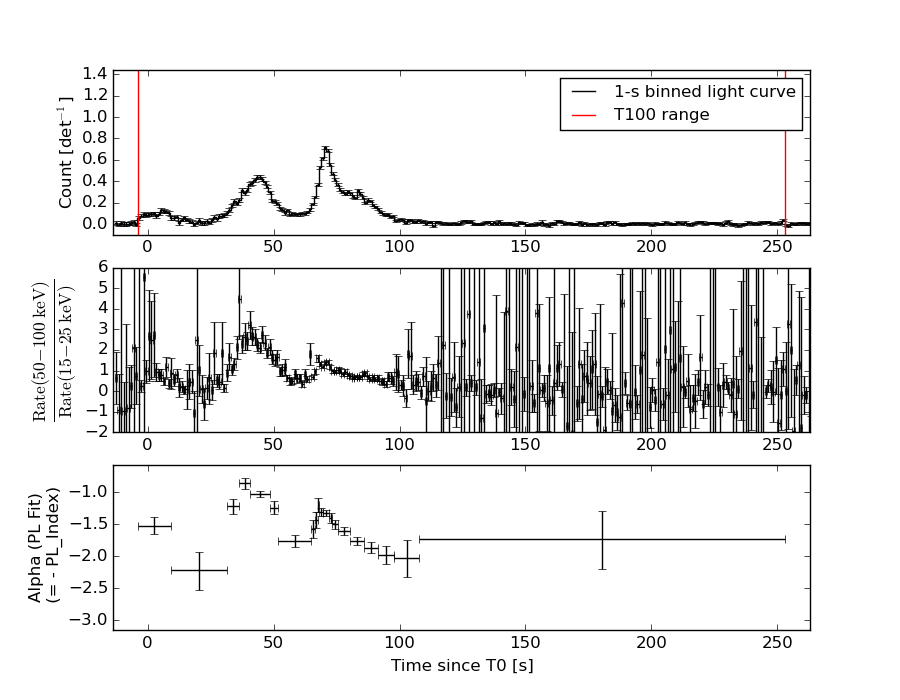
Lightcurves
Notes:
- 1) The mask-weighted light curves are using the flight position.
- 2) Multiple plots of different time binning/intervals are shown to cover all scenarios of short/long GRBs, rate/image triggers, and real/false positives.
- 3) For all the mask-weighted lightcurves, the y-axis units are counts/sec/det where a det is 0.4 x 0.4 = 0.16 sq cm.
- 4) The verticle lines correspond to following: green dotted lines are T50 interval, black dotted lines are T90 interval, blue solid line(s) is a spacecraft slew start time, and orange solid line(s) is a spacecraft slew end time.
- 5) Time of each bin is in the middle of the bin.
1 s binning
From T0-310 s to T0+310 s
From T100_start - 20 s to T100_end + 30 s

Full time interval
64 ms binning
Full time interval

From T100_start to T100_end

From T0-5 sec to T0+5 sec
16 ms binning
From T100_start-5 s to T100_start+5 s
Blue+Cyan dotted lines: Time interval of the scaled map
From 0.000000 to 2.048000
8 ms binning
From T100_start-3 s to T100_start+3 s

Blue+Cyan dotted lines: Time interval of the scaled map
From 0.000000 to 2.048000
2 ms binning
From T100_start-1 s to T100_start+1 s
Blue+Cyan dotted lines: Time interval of the scaled map
From 0.000000 to 2.048000
SN=5 or 10 sec. binning (whichever binning is satisfied first)
SN=5 or 10 sec. binning (T < 200 sec)

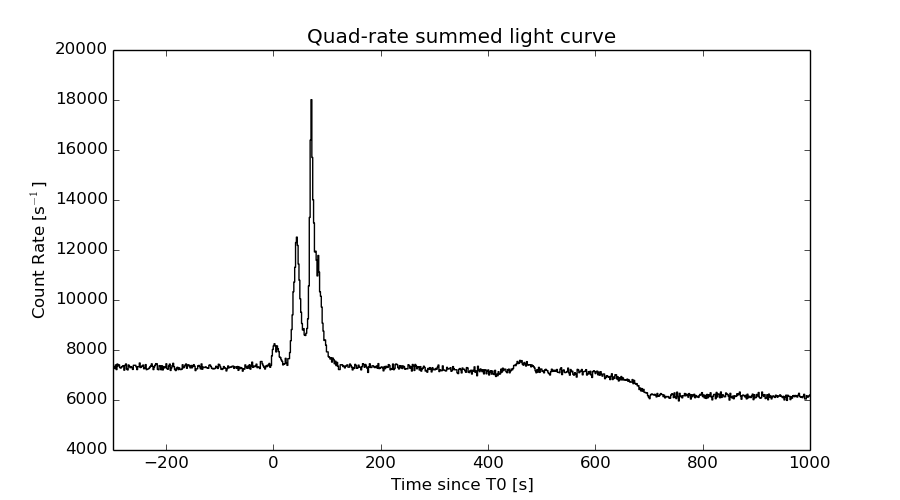
Quad-rate summed light curves (from T0-300s to T0+1000s)
Spectral Evolution
Spectra
Notes:
- 1) The fitting includes the systematic errors.
- 2) When the burst includes telescope slew time periods, the fitting uses an average response file made from multiple 5-s response files through out the slew time plus single time preiod for the non-slew times, and weighted by the total counts in the corresponding time period using addrmf. An average response file is needed becuase a spectral fit using the pre-slew DRM will introduce some errors in both a spectral shape and a normalization if the PHA file contains a lot of the slew/post-slew time interval.
- 3) For fits to more complicated models (e.g. a power-law over a cutoff power-law), the BAT team has decided to require a chi-square improvement of more than 6 for each extra dof.
Time averaged spectrum fit using the average DRM
Power-law model

Time interval is from   -3.964 sec. to  252.992 sec.

Spectral model in power-law:
------------------------------------------------------------
Parameters  : value       lower 90%   higher 90%
Photon index: 1.45494     ( -0.0375241   0.03739 )
Norm@50keV  : 5.29043E-03    ( -0.000101425   0.000101333 )
------------------------------------------------------------
#Fit statistic : Chi-Squared =          37.07 using 59 PHA bins.
# Reduced chi-squared =         0.6504 for     57 degrees of freedom
# Null hypothesis probability =   9.811693e-01

Photon flux (15-150 keV)    in 257 sec: 0.652774 ( -0.0147735  0.0148372 ) ph/cm2/s
Energy fluence (15-150 keV)             : 1.2999e-05 ( -2.49988e-07  2.50121e-07 ) ergs/cm2
Cutoff power-law model
Time interval is from   -3.964 sec. to  252.992 sec.
Spectral model in the cutoff power-law:
------------------------------------------------------------
Parameters  : value       lower 90%   higher 90%
Photon index: 1.41895     ( -0.149039   0.0381052 )
Epeak [keV] : 948.518      ( -9998.72 -9998.72 )
Norm@50keV  : 5.48192E-03    ( -0.000100332   0.000784003 )
------------------------------------------------------------
#Fit statistic : Chi-Squared =          37.24 using 59 PHA bins.
# Reduced chi-squared =         0.6650 for     56 degrees of freedom
# Null hypothesis probability =   9.748086e-01

Photon flux (15-150 keV)    in 257 sec: 0.652536 ( -0.014933  0.014478 ) ph/cm2/s
Energy fluence (15-150 keV)             : 1.30009e-05 ( -2.46848e-07  2.48108e-07 ) ergs/cm2
Band function

Time interval is from   -3.964 sec. to  252.992 sec.

Spectral model in the Band function:
------------------------------------------------------------
Parameters  : value       lower 90%   higher 90%
alpha       : -0.224802   ( 0.726972   5.47606 )
beta        : -1.47077    ( -0.0481199   0.0429623 )
Epeak [keV] : 39.9970      ( -40.0077 138.828 )
Norm@50keV   : 3.79554E-02    ( -0.0380487   448.876 )
------------------------------------------------------------
#Fit statistic : Chi-Squared =          35.26 using 59 PHA bins.
# Reduced chi-squared =         0.6412 for     55 degrees of freedom
# Null hypothesis probability =   9.823316e-01

Photon flux (15-150 keV)    in 257 sec:  (    ) ph/cm2/s
Energy fluence (15-150 keV)             : 0 ( 0  0 ) ergs/cm2
Single BB
Spectral model blackbody:
------------------------------------------------------------
Parameters  : value    Lower 90%  Upper 90%
kT [keV]    : 18.7761  (  )
R^2/D10^2   : 3.26236E-02  (   )
(R is the radius in km and D10 is the distance to the source in units of 10 kpc)
------------------------------------------------------------
#Fit statistic : Chi-Squared =         643.45 using 59 PHA bins.
# Reduced chi-squared =         11.289 for     57 degrees of freedom
# Null hypothesis probability =  3.255153e-100

Energy  Fluence     90% Error
[keV]   [erg/cm2]   [erg/cm2]
15- 25  5.835e-07   2.454e-08
25- 50  2.783e-06   8.481e-08
50-150  7.193e-06   2.249e-07
15-150  1.056e-05   2.236e-07
Thermal bremsstrahlung (OTTB)
Spectral model: thermal bremsstrahlung
------------------------------------------------------------
Parameters  : value         Lower 90%    Upper 90%
kT [keV]    : 200.000       (      )
Norm        : 2.72381       (-0.0516714     0.0516513)
------------------------------------------------------------
#Fit statistic : Chi-Squared =          93.34 using 59 PHA bins.
# Reduced chi-squared =          1.638 for     57 degrees of freedom
# Null hypothesis probability =   1.705287e-03

Energy  Fluence     90% Error
[keV]   [erg/cm2]   [erg/cm2]
15- 25  1.744e-06   3.572e-08
25- 50  3.354e-06   7.967e-08
50-150  7.356e-06   1.645e-07
15-150  1.245e-05   2.853e-07
Double BB
Spectral model: bbodyrad<1> + bbodyrad<2>
------------------------------------------------------------
Parameters  : value         Lower 90%    Upper 90%
kT1 [keV]   : 7.84972        (-0.542664      0.574927)
R1^2/D10^2  : 0.444612        (-0.0969592      0.130526)
kT2 [keV]   : 31.6432        (-2.17621      2.6644)
R2^2/D10^2  : 4.55136E-03    (-0.00108896   0.00127838)
------------------------------------------------------------
#Fit statistic : Chi-Squared =          41.47 using 59 PHA bins.
# Reduced chi-squared =         0.7539 for     55 degrees of freedom
# Null hypothesis probability =   9.114498e-01

Energy  Fluence     90% Error
[keV]   [erg/cm2]   [erg/cm2]
15- 25  1.432e-06   9.136e-08
25- 50  3.241e-06   1.298e-07
50-150  8.244e-06   3.842e-07
15-150  1.292e-05   4.369e-07
Peak spectrum fit
Power-law model

Time interval is from   70.284 sec. to   71.284 sec.

Spectral model in power-law:
------------------------------------------------------------
Parameters  : value       lower 90%   higher 90%
Photon index: 1.27881     ( -0.0651605   0.0650816 )
Norm@50keV  : 4.88687E-02    ( -0.00176993   0.00176991 )
------------------------------------------------------------
#Fit statistic : Chi-Squared =          59.08 using 59 PHA bins.
# Reduced chi-squared =          1.037 for     57 degrees of freedom
# Null hypothesis probability =   3.993596e-01

Photon flux (15-150 keV)    in 1 sec: 5.80802 ( -0.219175  0.219456 ) ph/cm2/s
Energy fluence (15-150 keV)             : 4.85456e-07 ( -1.94096e-08  1.94654e-08 ) ergs/cm2
Cutoff power-law model
Time interval is from   70.284 sec. to   71.284 sec.
Spectral model in the cutoff power-law:
------------------------------------------------------------
Parameters  : value       lower 90%   higher 90%
Photon index: 0.923964     ( -0.27143   0.255676 )
Epeak [keV] : 165.394      ( -48.9833 257.163 )
Norm@50keV  : 7.15007E-02    ( -0.016732   0.0233867 )
------------------------------------------------------------
#Fit statistic : Chi-Squared =          53.34 using 59 PHA bins.
# Reduced chi-squared =         0.9525 for     56 degrees of freedom
# Null hypothesis probability =   5.762663e-01

Photon flux (15-150 keV)    in 1 sec: 5.69927 ( -0.23154  0.23176 ) ph/cm2/s
Energy fluence (15-150 keV)             : 4.74904e-07 ( -2.1187e-08  2.1081e-08 ) ergs/cm2
Band function
Time interval is from   70.284 sec. to   71.284 sec.

Spectral model in the Band function:
------------------------------------------------------------
Parameters  : value       lower 90%   higher 90%
alpha       : 0.787012   ( -1.82526   3.28991 )
beta        : -1.39274    ( -0.109169   0.0973079 )
Epeak [keV] : 44.0624      ( -10.8677 76.4162 )
Norm@50keV   : 1.01117    ( -1.00755   395.077 )
------------------------------------------------------------
#Fit statistic : Chi-Squared =          50.61 using 59 PHA bins.
# Reduced chi-squared =         0.9203 for     55 degrees of freedom
# Null hypothesis probability =   6.427097e-01

Photon flux (15-150 keV)    in 1 sec:  (    ) ph/cm2/s
Energy fluence (15-150 keV)             : 0 ( 0  0 ) ergs/cm2
Single BB
Spectral model blackbody:
------------------------------------------------------------
Parameters  : value    Lower 90%  Upper 90%
kT [keV]    : 18.0695  (  )
R^2/D10^2   : 0.363426  (   )
(R is the radius in km and D10 is the distance to the source in units of 10 kpc)
------------------------------------------------------------
#Fit statistic : Chi-Squared =         182.37 using 59 PHA bins.
# Reduced chi-squared =         3.1995 for     57 degrees of freedom
# Null hypothesis probability =   4.904997e-15

Energy  Fluence     90% Error
[keV]   [erg/cm2]   [erg/cm2]
15- 25  2.373e-08   1.850e-09
25- 50  1.100e-07   5.550e-09
50-150  2.611e-07   1.830e-08
15-150  3.949e-07   1.830e-08
Thermal bremsstrahlung (OTTB)
Spectral model: thermal bremsstrahlung
------------------------------------------------------------
Parameters  : value         Lower 90%    Upper 90%
kT [keV]    : 200.000       (      )
Norm        : 24.1961       (-0.886435     0.88621)
------------------------------------------------------------
#Fit statistic : Chi-Squared =         104.81 using 59 PHA bins.
# Reduced chi-squared =         1.8389 for     57 degrees of freedom
# Null hypothesis probability =   1.177768e-04

Energy  Fluence     90% Error
[keV]   [erg/cm2]   [erg/cm2]
15- 25  6.024e-08   2.470e-09
25- 50  1.159e-07   4.550e-09
50-150  2.541e-07   9.500e-09
15-150  4.303e-07   1.710e-08
Double BB
Spectral model: bbodyrad<1> + bbodyrad<2>
------------------------------------------------------------
Parameters  : value         Lower 90%    Upper 90%
kT1 [keV]   : 8.39706        (-1.15759      1.27854)
R1^2/D10^2  : 2.77138        (-0.939849      1.61159)
kT2 [keV]   : 31.2913        (-4.17127      6.47925)
R2^2/D10^2  : 4.70054E-02    (-0.0219057   0.0308042)
------------------------------------------------------------
#Fit statistic : Chi-Squared =          50.79 using 59 PHA bins.
# Reduced chi-squared =         0.9235 for     55 degrees of freedom
# Null hypothesis probability =   6.359479e-01

Energy  Fluence     90% Error
[keV]   [erg/cm2]   [erg/cm2]
15- 25  4.356e-08   5.775e-09
25- 50  1.135e-07   1.139e-08
50-150  3.203e-07   4.960e-08
15-150  4.774e-07   5.535e-08
Pre-slew spectrum (Pre-slew PHA with pre-slew DRM)
Power-law model

Spectral model in power-law:
------------------------------------------------------------
Parameters  : value       lower 90%   higher 90%
Photon index: 1.78556     ( -0.147942   0.150787 )
Norm@50keV  : 3.85329E-03    ( -0.00034177   0.000338401 )
------------------------------------------------------------
#Fit statistic : Chi-Squared =          53.87 using 59 PHA bins.
# Reduced chi-squared =         0.9451 for     57 degrees of freedom
# Null hypothesis probability =   5.932141e-01

Photon flux (15-150 keV)    in 29.02 sec: 0.528033 ( -0.0453003  0.0454102 ) ph/cm2/s
Energy fluence (15-150 keV)             : 1.03002e-06 ( -9.30265e-08  9.36516e-08 ) ergs/cm2
Cutoff power-law model

Spectral model in the cutoff power-law:
------------------------------------------------------------
Parameters  : value       lower 90%   higher 90%
Photon index: 1.60667     ( -0.607864   0.554948 )
Epeak [keV] : 105.153      ( -73.5078 -105.169 )
Norm@50keV  : 4.78455E-03    ( -0.00185322   0.0050392 )
------------------------------------------------------------
#Fit statistic : Chi-Squared =          53.56 using 59 PHA bins.
# Reduced chi-squared =         0.9565 for     56 degrees of freedom
# Null hypothesis probability =   5.676750e-01

Photon flux (15-150 keV)    in 29.02 sec: 0.523552 ( -0.04725  0.047194 ) ph/cm2/s
Energy fluence (15-150 keV)             : 1.01627e-06 ( -1.03221e-07  1.02165e-07 ) ergs/cm2
Band function

Spectral model in the Band function:
------------------------------------------------------------
Parameters  : value       lower 90%   higher 90%
alpha       : 4.93533   ( -4.93533   -4.93533 )
beta        : -1.86465    ( -0.177629   0.167635 )
Epeak [keV] : 22.9484      ( -7.69106 4.28151 )
Norm@50keV   : 797.441    ( -65.3917   3.01341e+06 )
------------------------------------------------------------
#Fit statistic : Chi-Squared =          51.87 using 59 PHA bins.
# Reduced chi-squared =         0.9431 for     55 degrees of freedom
# Null hypothesis probability =   5.950045e-01

Photon flux (15-150 keV)    in 29.02 sec:  (    ) ph/cm2/s
Energy fluence (15-150 keV)             : 1.01468e-06 ( 0  0 ) ergs/cm2
S(25-50 keV) vs. S(50-100 keV) plot
S(25-50 keV)  = 3.14e-06
S(50-100 keV) = 4.59e-06
T90 vs. Hardness ratio plot

T90                                   = 98.3679999709129 sec.
Hardness ratio (energy fluence ratio) = 1.46178
Color vs. Color plot
Count Ratio  (25-50 keV) / (15-25 keV) = 1.40962
Count Ratio (50-100 keV) / (15-25 keV) = 1.11706
Mask shadow pattern

IMX = 8.641568649219036E-01, IMY = 8.469734488087770E-02
TIME vs. PHA plot around the trigger time
Blue+Cyan dotted lines: Time interval of the scaled map
From 0.000000 to 2.048000
TIME vs. DetID plot around the trigger time
Blue+Cyan dotted lines: Time interval of the scaled map
From 0.000000 to 2.048000
100 us light curve (15-350 keV)

Blue+Cyan dotted lines: Time interval of the scaled map
From 0.000000 to 2.048000
Spacecraft aspect plot
Bright source in the pre-burst/pre-slew/post-slew images
Pre-burst image of 15-350 keV band
Time interval of the image:
-239.048000 -3.964000

# RAcent  DECcent POSerr Theta    Phi  PeakCts   SNR AngSep     Name
#  [deg]    [deg]    ['] [deg]  [deg]                   [']
244.9758 -15.6324    0.5  40.9  -36.3   6.5018  21.2    0.5	Sco X-1
255.9856 -37.8617    0.8  22.1  -67.0   2.9065  14.1    1.1	4U 1700-377
256.3889 -36.4083    2.9  22.0  -63.1   0.8146   4.0    2.4	GX 349+2
263.1302 -24.7848    4.8  22.1  -28.1   0.4104   2.4    7.0	GX 1+4
264.6069 -44.6313   15.9  16.1  -89.4   0.1375   0.7   12.3	4U 1735-44
268.2191  -1.4203    4.5  39.3    6.1   0.7598   2.6    9.1	SW J1753.5-0127
270.1316 -25.1217    5.7  17.4  -15.2  -0.3867  -2.1    8.7	GX 5-1
270.2465 -25.6698    3.7  16.9  -16.2   0.6799   3.5    5.3	GRS 1758-258
274.0083 -14.0332    1.7  25.5    8.4   1.4211   6.8    0.2	GX 17+2
275.8485 -30.2325    6.0  10.2  -12.5   0.3550   1.9    9.0	H1820-303
284.8084 -24.8722    0.0  13.0   34.6   0.1801   1.0   12.7	HT1900.1-2455
262.9167 -33.8498    3.2  17.6  -51.5   0.6577   3.6    3.7	GX 354-0
308.7229 -27.8568    2.8  22.9  103.0   1.1122   4.2 ------	UNKNOWN
277.4495 -23.8265    1.8  15.1    7.8   1.1430   6.2 ------	UNKNOWN
265.5669 -33.2941    2.8  15.7  -47.0   0.7162   4.1 ------	UNKNOWN
 25.8835 -72.4145    2.5  57.6 -168.9   4.0018   4.5 ------	UNKNOWN
244.3900 -42.2195    2.9  30.4  -79.2   1.1382   4.0 ------	UNKNOWN
Pre-slew background subtracted image of 15-350 keV band
Time interval of the image:
-3.964000 25.052590

# RAcent  DECcent POSerr Theta    Phi  PeakCts   SNR AngSep     Name
#  [deg]    [deg]    ['] [deg]  [deg]                   [']
244.8641 -15.8288    0.0  40.9  -36.6  -0.0411  -0.4   13.1	Sco X-1
255.8213 -37.9410    4.8  22.2  -67.3  -0.1550  -2.4    9.7	4U 1700-377
256.3935 -36.2856    8.5  22.1  -62.8   0.0856   1.4    8.5	GX 349+2
262.9164 -24.9394    0.0  22.1  -28.7  -0.0402  -0.7   12.7	GX 1+4
264.7419 -44.4483   83.1  15.9  -88.8   0.0084   0.1    0.1	4U 1735-44
268.2070  -1.3973    6.9  39.3    6.1  -0.1599  -1.7   10.2	SW J1753.5-0127
270.2134 -25.0900   10.5  17.4  -15.0   0.0626   1.1    3.9	GX 5-1
270.0912 -25.6667    0.0  17.0  -16.5   0.0068   0.1   12.3	GRS 1758-258
274.0514 -13.9905   14.9  25.5    8.5   0.0488   0.8    3.8	GX 17+2
275.8483 -30.3144   45.9  10.2  -12.8  -0.0141  -0.3    5.1	H1820-303
284.9858 -25.1220    4.1  12.8   35.4  -0.1509  -2.8   12.4	HT1900.1-2455
262.9334 -33.8298   13.0  17.6  -51.5   0.0523   0.9    2.8	GX 354-0
260.6679  -2.9594    0.6  41.0   -5.6   1.8690  19.8 ------	UNKNOWN
267.3147 -56.3693    2.2  21.6 -122.6   0.3374   5.4 ------	UNKNOWN
Post-slew image of 15-350 keV band
Time interval of the image:
99.052600 426.152590

# RAcent  DECcent POSerr Theta    Phi  PeakCts   SNR AngSep     Name
#  [deg]    [deg]    ['] [deg]  [deg]                   [']
244.9728 -15.6320    0.3  20.0 -156.6   9.6755  33.1    0.6	Sco X-1
254.6288  35.4443    8.2  38.8  -34.2   0.6566   1.4   10.4	Her X-1
255.9973 -37.8580    1.4  35.1  160.1   3.5576   8.2    1.0	4U 1700-377
256.4541 -36.4177    2.9  33.7  159.8   1.6205   4.0    1.0	GX 349+2
262.9867 -24.7463    3.2  21.9  148.1   1.0859   3.6    1.2	GX 1+4
265.0039 -44.3856    7.2  41.6  149.0   1.0346   1.6   11.8	4U 1735-44
268.3218  -1.4366    3.4   7.8   52.4   0.8842   3.4    2.9	SW J1753.5-0127
270.1971 -24.9136    7.3  23.8  131.9  -0.4751  -1.6   11.0	GX 5-1
270.4384 -25.8201    4.0  24.7  132.3   0.8812   2.9    8.7	GRS 1758-258
274.0405 -14.0052    1.4  17.2  104.4   2.4068   8.0    2.8	GX 17+2
275.7919 -30.3889   58.3  30.9  127.7   0.0800   0.2    7.0	H1820-303
284.8410 -25.0018  110.4  32.0  109.3  -0.0620  -0.1   11.7	HT1900.1-2455
288.8160  10.9445    1.1  31.3   36.8   4.4799  10.9    1.0	GRS 1915+105
299.5932  35.3960   14.0  52.9   13.6   1.2335   0.8   11.7	Cyg X-1
262.9090 -33.7511    6.0  30.8  150.1   0.7093   1.9    6.4	GX 354-0
242.3874  46.4172    3.1  52.0  -42.3   7.1556   3.7 ------	UNKNOWN
213.6549  -9.9423    2.7  47.2 -127.1   6.6595   4.2 ------	UNKNOWN
217.3704  -0.4639    3.3  43.4 -113.8   5.2752   3.5 ------	UNKNOWN
Plot creation:
Sat May 30 16:07:39 EDT 2015