Click here for the BAT GCN circular template
Image
Pre-slew 15.0-350.0 keV image (Event data)

#   RAcent    DECcent   POSerr    Theta     Phi              Peak Cts       SNR   Name
   35.9031    67.5377   0.0120    12.3900   -70.1264         0.3797464     16.006 TRIG_00565562

Foreground time interval of the image:
 -4.508   1.756 (delta_t =   6.264 [sec])
Background time interval of the image:
-239.832  -4.508 (delta_t = 235.324 [sec])
Lightcurves
Notes:
- 1) The mask-weighted light curves are using the flight position.
- 2) Multiple plots of different time binning/intervals are shown to cover all scenarios of short/long GRBs, rate/image triggers, and real/false positives.
- 3) For all the mask-weighted lightcurves, the y-axis units are counts/sec/det where a det is 0.4 x 0.4 = 0.16 sq cm.
- 4) The verticle lines correspond to following: green dotted lines are T50 interval, black dotted lines are T90 interval, blue solid line(s) is a spacecraft slew start time, and orange solid line(s) is a spacecraft slew end time.
- 5) Time of each bin is in the middle of the bin.
1 s binning
From T0-310 s to T0+310 s
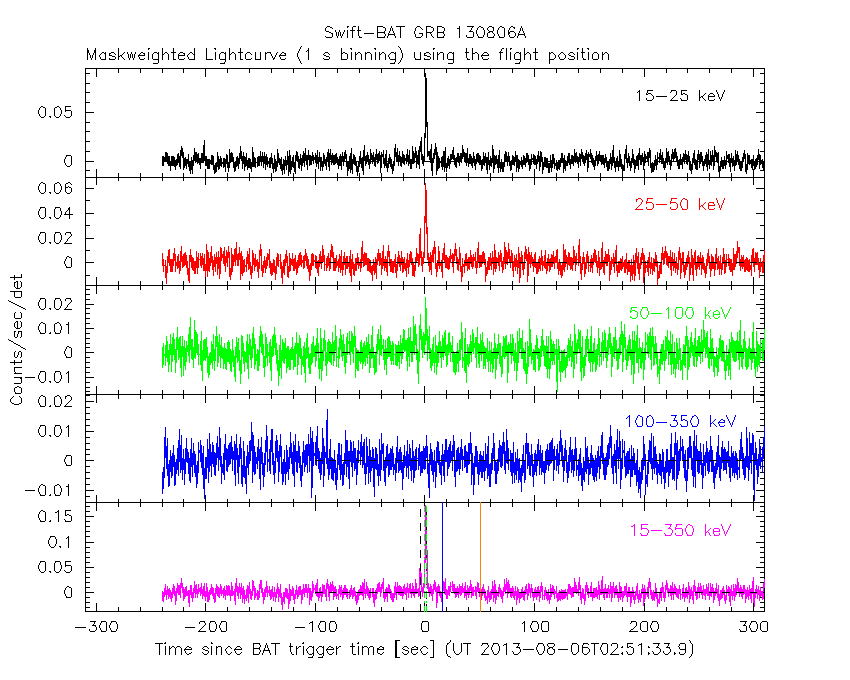
From T100_start - 20 s to T100_end + 30 s

Full time interval

64 ms binning
Full time interval

From T100_start to T100_end
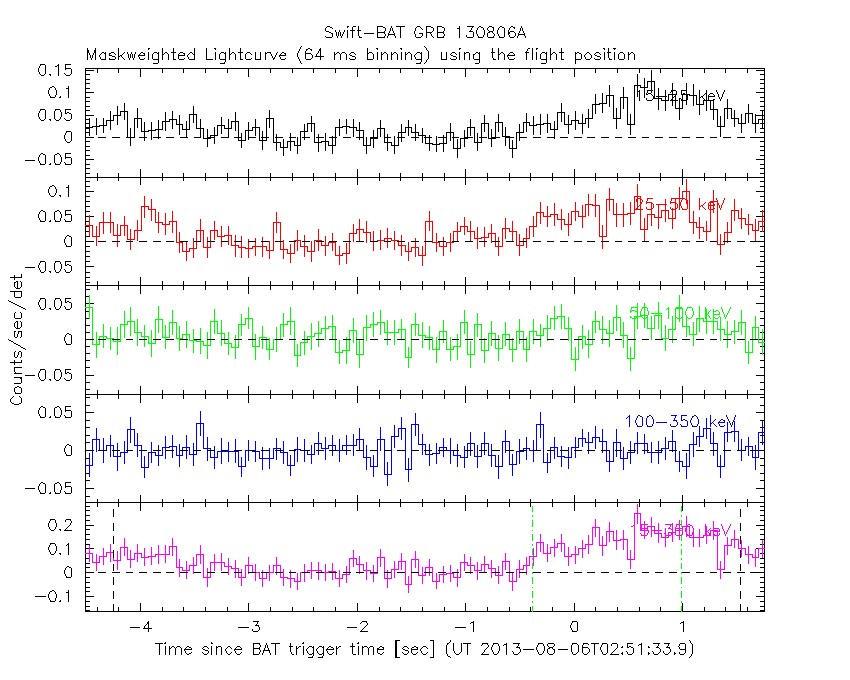
From T0-5 sec to T0+5 sec

16 ms binning
From T100_start-5 s to T100_start+5 s

Blue+Cyan dotted lines: Time interval of the scaled map
From 0.000000 to 1.024000
8 ms binning
From T100_start-3 s to T100_start+3 s

Blue+Cyan dotted lines: Time interval of the scaled map
From 0.000000 to 1.024000
2 ms binning
From T100_start-1 s to T100_start+1 s

Blue+Cyan dotted lines: Time interval of the scaled map
From 0.000000 to 1.024000
SN=5 or 10 sec. binning (whichever binning is satisfied first)

SN=5 or 10 sec. binning (T < 200 sec)

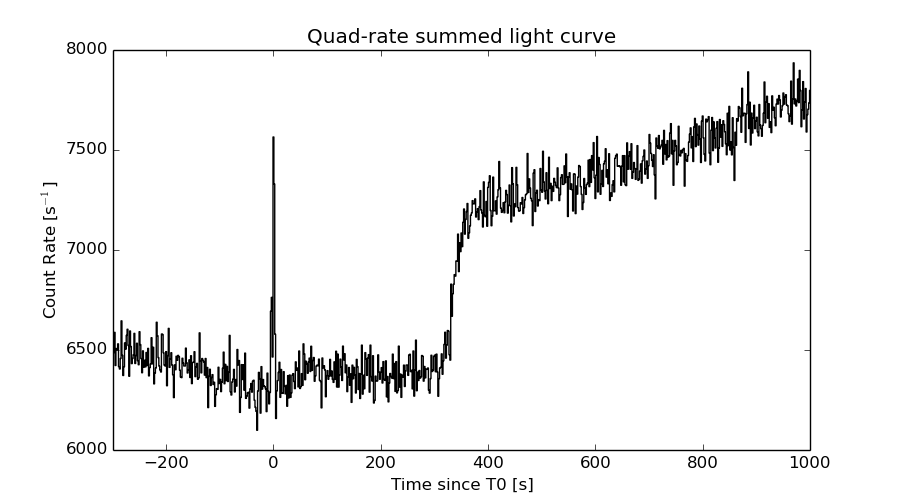
Quad-rate summed light curves (from T0-300s to T0+1000s)
Spectral Evolution
Spectra
Notes:
- 1) The fitting includes the systematic errors.
- 2) When the burst includes telescope slew time periods, the fitting uses an average response file made from multiple 5-s response files through out the slew time plus single time preiod for the non-slew times, and weighted by the total counts in the corresponding time period using addrmf. An average response file is needed becuase a spectral fit using the pre-slew DRM will introduce some errors in both a spectral shape and a normalization if the PHA file contains a lot of the slew/post-slew time interval.
- 3) For fits to more complicated models (e.g. a power-law over a cutoff power-law), the BAT team has decided to require a chi-square improvement of more than 6 for each extra dof.
Time averaged spectrum fit using the average DRM
Power-law model
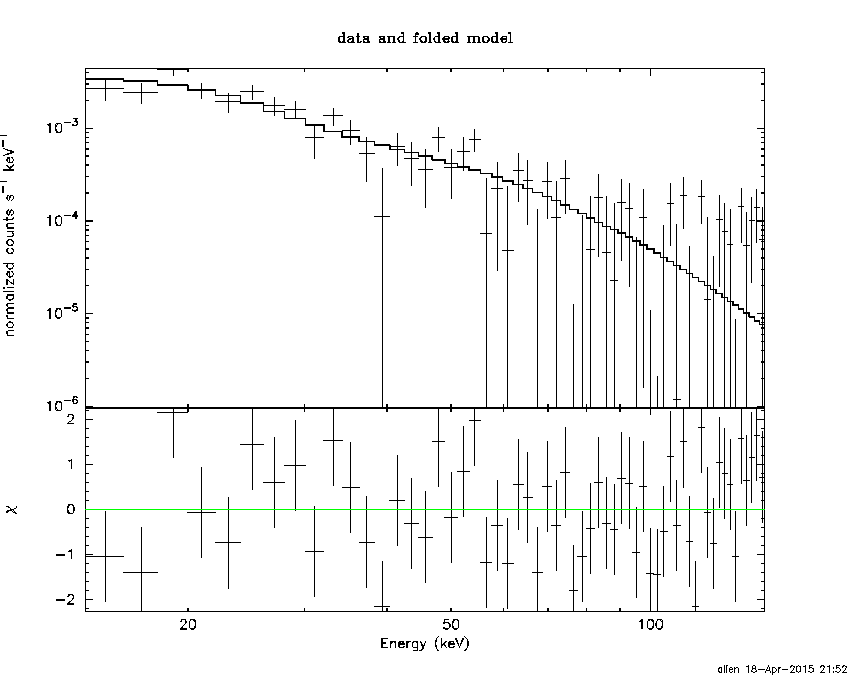
Time interval is from   -4.508 sec. to    1.756 sec.

Spectral model in power-law:
------------------------------------------------------------
Parameters  : value       lower 90%   higher 90%
Photon index: 2.36331     ( -0.207001   0.222302 )
Norm@50keV  : 2.73332E-03    ( -0.000435993   0.000431536 )
------------------------------------------------------------
#Fit statistic : Chi-Squared =          68.71 using 59 PHA bins.
# Reduced chi-squared =          1.206 for     57 degrees of freedom
# Null hypothesis probability =   1.375440e-01

Photon flux (15-150 keV)    in 6.264 sec: 0.495082 ( -0.0490559  0.0490564 ) ph/cm2/s
Energy fluence (15-150 keV)             : 1.65677e-07 ( -2.0636e-08  2.13443e-08 ) ergs/cm2
Cutoff power-law model

Time interval is from   -4.508 sec. to    1.756 sec.
Spectral model in the cutoff power-law:
------------------------------------------------------------
Parameters  : value       lower 90%   higher 90%
Photon index: 1.66097     ( -1.25919   0.622615 )
Epeak [keV] : 16.7447      (   )
Norm@50keV  : 7.75465E-03    (     )
------------------------------------------------------------
#Fit statistic : Chi-Squared =          67.34 using 59 PHA bins.
# Reduced chi-squared =          1.203 for     56 degrees of freedom
# Null hypothesis probability =   1.425901e-01

Photon flux (15-150 keV)    in 6.264 sec: 0.483085 ( -0.051034  0.051617 ) ph/cm2/s
Energy fluence (15-150 keV)             : 1.51579e-07 ( -2.36961e-08  2.89704e-08 ) ergs/cm2
Band function

Time interval is from   -4.508 sec. to    1.756 sec.

Spectral model in the Band function:
------------------------------------------------------------
Parameters  : value       lower 90%   higher 90%
alpha       : 4.91149   ( -6.76311   -4.91149 )
beta        : -2.55745    ( -0.414704   0.267975 )
Epeak [keV] : 20.4060      ( -3.55983 3.22744 )
Norm@50keV   : 2079.97    ( -204.855   14738.1 )
------------------------------------------------------------
#Fit statistic : Chi-Squared =          65.43 using 59 PHA bins.
# Reduced chi-squared =          1.190 for     55 degrees of freedom
# Null hypothesis probability =   1.586060e-01

Photon flux (15-150 keV)    in 6.264 sec:  (    ) ph/cm2/s
Energy fluence (15-150 keV)             : 0 ( 0  0 ) ergs/cm2
Single BB

Spectral model blackbody:
------------------------------------------------------------
Parameters  : value    Lower 90%  Upper 90%
kT [keV]    : 7.28708  (-0.82952  0.936461)
R^2/D10^2   : 0.780125  (-0.305417   0.510672)
(R is the radius in km and D10 is the distance to the source in units of 10 kpc)
------------------------------------------------------------
#Fit statistic : Chi-Squared =          80.52 using 59 PHA bins.
# Reduced chi-squared =          1.413 for     57 degrees of freedom
# Null hypothesis probability =   2.181737e-02

Energy  Fluence     90% Error
[keV]   [erg/cm2]   [erg/cm2]
15- 25  4.338e-08   7.229e-09
25- 50  6.414e-08   8.942e-09
50-150  1.227e-08   4.469e-09
15-150  1.198e-07   1.723e-08
Thermal bremsstrahlung (OTTB)

Spectral model: thermal bremsstrahlung
------------------------------------------------------------
Parameters  : value         Lower 90%    Upper 90%
kT [keV]    : 35.2888       (-8.09039      11.6303)
Norm        : 3.48187       (-0.677941     0.889589)
------------------------------------------------------------
#Fit statistic : Chi-Squared =          67.52 using 59 PHA bins.
# Reduced chi-squared =          1.185 for     57 degrees of freedom
# Null hypothesis probability =   1.606515e-01

Energy  Fluence     90% Error
[keV]   [erg/cm2]   [erg/cm2]
15- 25  4.781e-08   5.844e-09
25- 50  5.940e-08   7.310e-09
50-150  3.984e-08   1.442e-08
15-150  1.471e-07   1.901e-08
Double BB

Spectral model: bbodyrad<1> + bbodyrad<2>
------------------------------------------------------------
Parameters  : value         Lower 90%    Upper 90%
kT1 [keV]   : 4.99193        (-1.31875      1.46825)
R1^2/D10^2  : 2.80291        (-1.66688      6.17283)
kT2 [keV]   : 14.9681        (-4.80106      21.8024)
R2^2/D10^2  : 2.44547E-02    (-0.0236167   0.0995579)
------------------------------------------------------------
#Fit statistic : Chi-Squared =          66.16 using 59 PHA bins.
# Reduced chi-squared =          1.203 for     55 degrees of freedom
# Null hypothesis probability =   1.440865e-01

Energy  Fluence     90% Error
[keV]   [erg/cm2]   [erg/cm2]
15- 25  4.961e-08   2.555e-08
25- 50  5.610e-08   2.618e-08
50-150  4.453e-08   2.709e-08
15-150  1.502e-07   7.357e-08
Peak spectrum fit
Power-law model
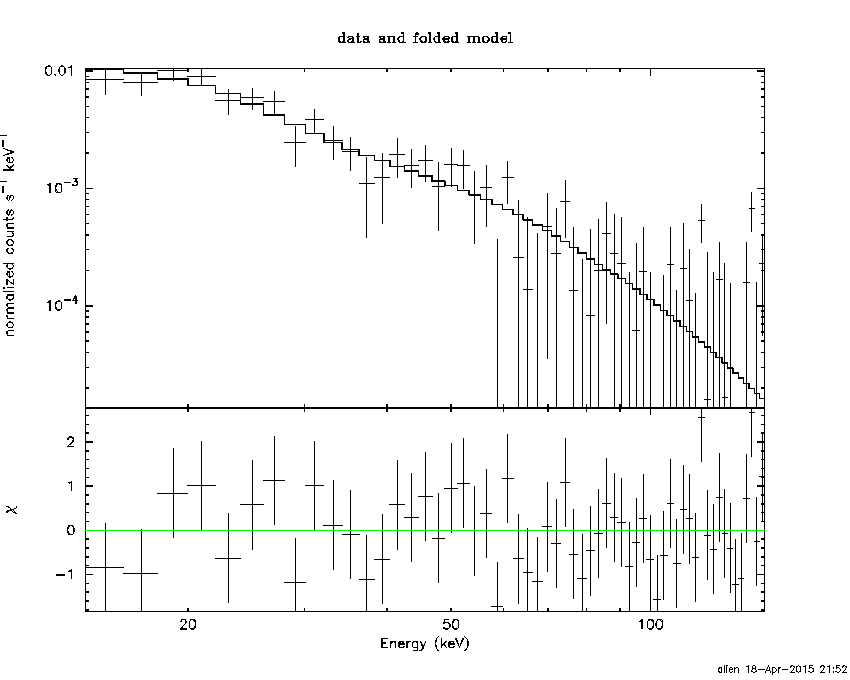
Time interval is from    0.320 sec. to    1.320 sec.

Spectral model in power-law:
------------------------------------------------------------
Parameters  : value       lower 90%   higher 90%
Photon index: 2.51169     ( -0.212834   0.229932 )
Norm@50keV  : 6.93197E-03    ( -0.00115148   0.00114143 )
------------------------------------------------------------
#Fit statistic : Chi-Squared =          48.16 using 59 PHA bins.
# Reduced chi-squared =         0.8450 for     57 degrees of freedom
# Null hypothesis probability =   7.914286e-01

Photon flux (15-150 keV)    in 1 sec: 1.37157 ( -0.137813  0.13782 ) ph/cm2/s
Energy fluence (15-150 keV)             : 6.95371e-08 ( -8.44696e-09  8.68564e-09 ) ergs/cm2
Cutoff power-law model

Time interval is from    0.320 sec. to    1.320 sec.
Spectral model in the cutoff power-law:
------------------------------------------------------------
Parameters  : value       lower 90%   higher 90%
Photon index: 1.85489     (     )
Epeak [keV] : 7.75430      (   )
Norm@50keV  : 1.82577E-02    (     )
------------------------------------------------------------
#Fit statistic : Chi-Squared =          46.83 using 59 PHA bins.
# Reduced chi-squared =         0.8363 for     56 degrees of freedom
# Null hypothesis probability =   8.035966e-01

Photon flux (15-150 keV)    in 1 sec: 1.34503 ( -0.14188  0.14249 ) ph/cm2/s
Energy fluence (15-150 keV)             : 6.50282e-08 ( -9.3629e-09  1.0753e-08 ) ergs/cm2
Band function

Time interval is from    0.320 sec. to    1.320 sec.

Spectral model in the Band function:
------------------------------------------------------------
Parameters  : value       lower 90%   higher 90%
alpha       : 4.65087   ( -4.65087   -4.65087 )
beta        : -2.67336    ( -0.317438   0.266432 )
Epeak [keV] : 19.4478      ( -4.29199 3.07327 )
Norm@50keV   : 5044.99    ( -504.467   2.69342e+07 )
------------------------------------------------------------
#Fit statistic : Chi-Squared =          45.91 using 59 PHA bins.
# Reduced chi-squared =         0.8348 for     55 degrees of freedom
# Null hypothesis probability =   8.036777e-01

Photon flux (15-150 keV)    in 1 sec:  (    ) ph/cm2/s
Energy fluence (15-150 keV)             : 0 ( 0  0 ) ergs/cm2
Single BB

Spectral model blackbody:
------------------------------------------------------------
Parameters  : value    Lower 90%  Upper 90%
kT [keV]    : 7.06125  (-0.83933  0.946287)
R^2/D10^2   : 2.43491  (-0.998679   1.74691)
(R is the radius in km and D10 is the distance to the source in units of 10 kpc)
------------------------------------------------------------
#Fit statistic : Chi-Squared =          63.19 using 59 PHA bins.
# Reduced chi-squared =          1.109 for     57 degrees of freedom
# Null hypothesis probability =   2.670771e-01

Energy  Fluence     90% Error
[keV]   [erg/cm2]   [erg/cm2]
15- 25  1.968e-08   3.235e-09
25- 50  2.741e-08   4.055e-09
50-150  4.687e-09   1.740e-09
15-150  5.177e-08   6.935e-09
Thermal bremsstrahlung (OTTB)

Spectral model: thermal bremsstrahlung
------------------------------------------------------------
Parameters  : value         Lower 90%    Upper 90%
kT [keV]    : 31.0743       (-6.81293      9.44601)
Norm        : 10.6284       (-2.19646     2.93914)
------------------------------------------------------------
#Fit statistic : Chi-Squared =          47.47 using 59 PHA bins.
# Reduced chi-squared =         0.8328 for     57 degrees of freedom
# Null hypothesis probability =   8.118260e-01

Energy  Fluence     90% Error
[keV]   [erg/cm2]   [erg/cm2]
15- 25  2.201e-08   2.975e-09
25- 50  2.564e-08   3.210e-09
50-150  1.470e-08   5.214e-09
15-150  6.236e-08   8.640e-09
Double BB

Spectral model: bbodyrad<1> + bbodyrad<2>
------------------------------------------------------------
Parameters  : value         Lower 90%    Upper 90%
kT1 [keV]   : 4.25307        (-1.14516      1.29363)
R1^2/D10^2  : 15.0789        (-9.71965      45.062)
kT2 [keV]   : 12.5742        (-3.17156      6.79234)
R2^2/D10^2  : 0.145033    (-0.124295   0.221894)
------------------------------------------------------------
#Fit statistic : Chi-Squared =          46.06 using 59 PHA bins.
# Reduced chi-squared =         0.8374 for     55 degrees of freedom
# Null hypothesis probability =   7.993698e-01

Energy  Fluence     90% Error
[keV]   [erg/cm2]   [erg/cm2]
15- 25  2.318e-08   1.155e-08
25- 50  2.400e-08   1.204e-08
50-150  1.595e-08   9.825e-09
15-150  6.313e-08   2.891e-08
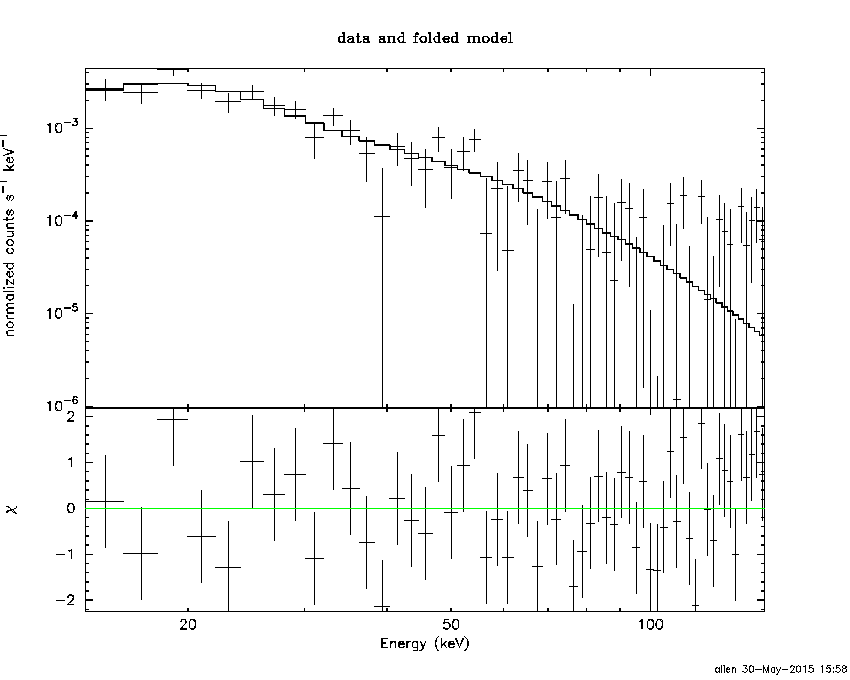
Pre-slew spectrum (Pre-slew PHA with pre-slew DRM)
Power-law model

Spectral model in power-law:
------------------------------------------------------------
Parameters  : value       lower 90%   higher 90%
Photon index: 2.36331     ( -0.207001   0.222302 )
Norm@50keV  : 2.73332E-03    ( -0.000435993   0.000431536 )
------------------------------------------------------------
#Fit statistic : Chi-Squared =          68.71 using 59 PHA bins.
# Reduced chi-squared =          1.206 for     57 degrees of freedom
# Null hypothesis probability =   1.375440e-01

Photon flux (15-150 keV)    in 6.264 sec: 0.495082 ( -0.0490559  0.0490564 ) ph/cm2/s
Energy fluence (15-150 keV)             : 1.65677e-07 ( -2.0636e-08  2.13443e-08 ) ergs/cm2
Cutoff power-law model

Spectral model in the cutoff power-law:
------------------------------------------------------------
Parameters  : value       lower 90%   higher 90%
Photon index: 1.66097     ( -1.25919   0.622615 )
Epeak [keV] : 16.7447      (   )
Norm@50keV  : 7.75465E-03    (     )
------------------------------------------------------------
#Fit statistic : Chi-Squared =          67.34 using 59 PHA bins.
# Reduced chi-squared =          1.203 for     56 degrees of freedom
# Null hypothesis probability =   1.425901e-01

Photon flux (15-150 keV)    in 6.264 sec: 0.483085 ( -0.051034  0.051617 ) ph/cm2/s
Energy fluence (15-150 keV)             : 1.51579e-07 ( -2.36961e-08  2.89704e-08 ) ergs/cm2
Band function
Spectral model in the Band function:
------------------------------------------------------------
Parameters  : value       lower 90%   higher 90%
alpha       : 4.91149   ( -6.76311   -4.91149 )
beta        : -2.55745    ( -0.414704   0.267975 )
Epeak [keV] : 20.4060      ( -3.55983 3.22744 )
Norm@50keV   : 2079.97    ( -204.855   14738.1 )
------------------------------------------------------------
#Fit statistic : Chi-Squared =          65.43 using 59 PHA bins.
# Reduced chi-squared =          1.190 for     55 degrees of freedom
# Null hypothesis probability =   1.586060e-01

Photon flux (15-150 keV)    in 6.264 sec:  (    ) ph/cm2/s
Energy fluence (15-150 keV)             : 0 ( 0  0 ) ergs/cm2
S(25-50 keV) vs. S(50-100 keV) plot

S(25-50 keV)  = 5.41e-08
S(50-100 keV) = 4.20e-08
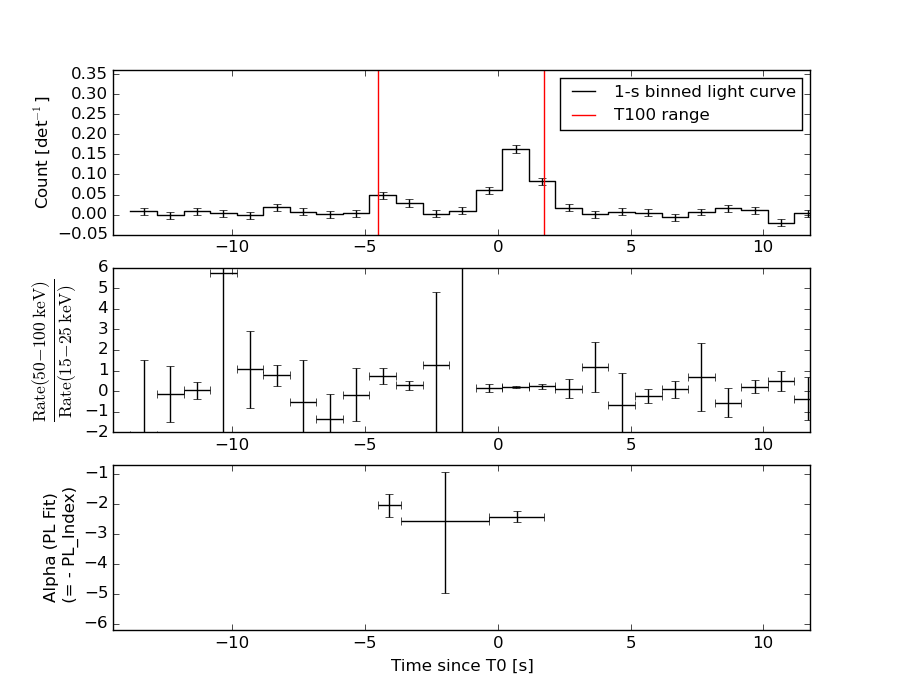
T90 vs. Hardness ratio plot
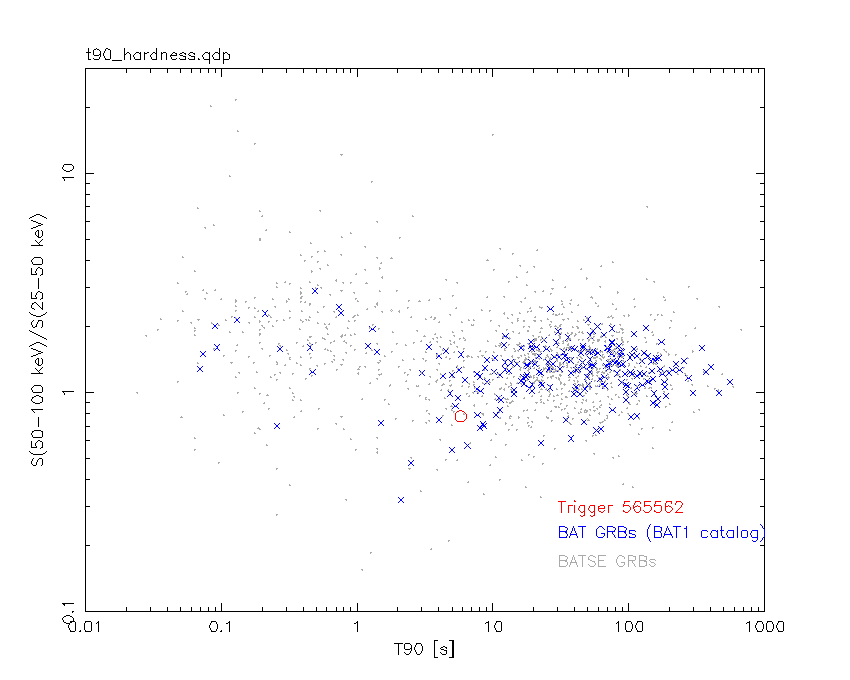
T90                                   = 5.77999997138977 sec.
Hardness ratio (energy fluence ratio) = 0.77634
Color vs. Color plot
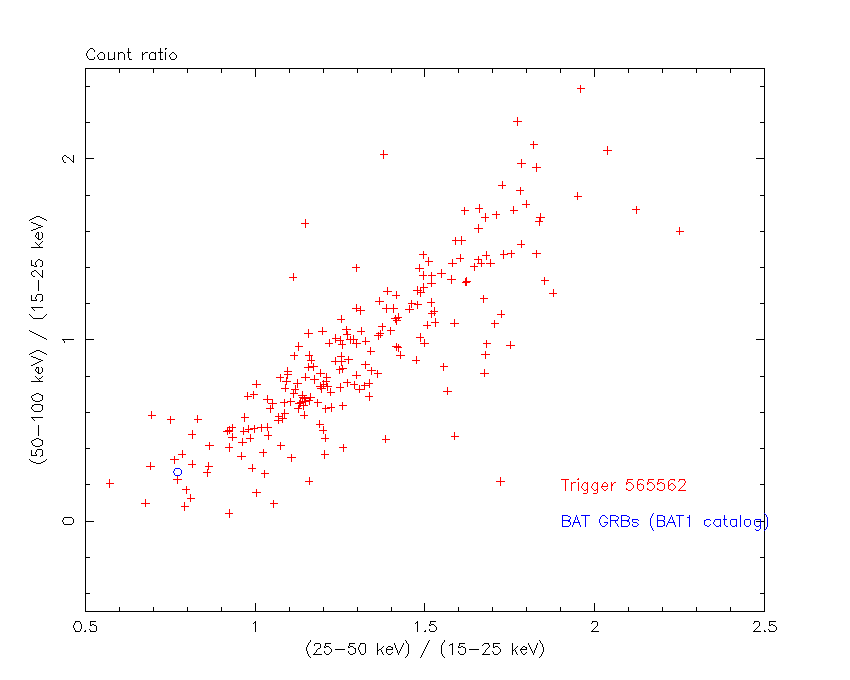
Count Ratio  (25-50 keV) / (15-25 keV) = 0.771153
Count Ratio (50-100 keV) / (15-25 keV) = 0.271201
Mask shadow pattern

IMX = 7.467981803750530E-02, IMY = 2.065985531786927E-01
TIME vs. PHA plot around the trigger time

Blue+Cyan dotted lines: Time interval of the scaled map
From 0.000000 to 1.024000
TIME vs. DetID plot around the trigger time

Blue+Cyan dotted lines: Time interval of the scaled map
From 0.000000 to 1.024000
100 us light curve (15-350 keV)

Blue+Cyan dotted lines: Time interval of the scaled map
From 0.000000 to 1.024000
Spacecraft aspect plot

Bright source in the pre-burst/pre-slew/post-slew images
Pre-burst image of 15-350 keV band
Time interval of the image:
-239.832000 -4.508000

# RAcent  DECcent POSerr Theta    Phi  PeakCts   SNR AngSep     Name
#  [deg]    [deg]    ['] [deg]  [deg]                   [']
308.1162  40.9768    3.1  40.3  133.1   1.6349   3.8    1.5	Cyg X-3
326.0238  38.4951    0.0  34.9  111.9   0.7253   2.0   12.5	Cyg X-2
  3.7171  61.4217    2.2   2.9   77.1   0.7365   5.3 ------	UNKNOWN
 79.7142  36.2638    2.7  50.6  -44.4   3.3264   4.3 ------	UNKNOWN
 81.6607  39.2644    2.6  49.0  -48.3   3.3421   4.4 ------	UNKNOWN
Pre-slew background subtracted image of 15-350 keV band
Time interval of the image:
-4.508000 1.756000

# RAcent  DECcent POSerr Theta    Phi  PeakCts   SNR AngSep     Name
#  [deg]    [deg]    ['] [deg]  [deg]                   [']
308.1645  40.8183    7.7  40.4  133.0  -0.0897  -1.5    8.4	Cyg X-3
326.0229  38.4835   14.4  34.9  111.9   0.0416   0.8   12.0	Cyg X-2
 44.9512  13.4672    2.2  57.1    3.2   0.7337   5.3 ------	UNKNOWN
 35.9031  67.5378    0.7  12.4  -70.1   0.3798  16.0 ------	UNKNOWN
 79.0260  35.1114    3.1  51.3  -43.0   0.4091   3.8 ------	UNKNOWN
Post-slew image of 15-350 keV band
Time interval of the image:
50.268600 305.468600

# RAcent  DECcent POSerr Theta    Phi  PeakCts   SNR AngSep     Name
#  [deg]    [deg]    ['] [deg]  [deg]                   [']
 29.3429  14.3759    2.1  53.3   24.1   4.7777   5.4 ------	UNKNOWN
 88.1028  71.0667    2.5  18.2 -108.6   0.7421   4.7 ------	UNKNOWN
 97.2755  54.2439    2.9  31.1  -79.6   1.0286   4.0 ------	UNKNOWN
107.7792  46.7177    2.1  41.1  -81.0   4.0657   5.4 ------	UNKNOWN
Plot creation:
Sat May 30 15:58:32 EDT 2015