Special notes of this burst
Image
Pre-slew 15.0-350.0 keV image (Event data)
#   RAcent    DECcent   POSerr    Theta     Phi              Peak Cts       SNR   Name
  215.8981    45.6036   0.0014     9.2394  -156.9254        63.3250911    133.026 TRIG_00569992

Foreground time interval of the image:
-14.391  18.009 (delta_t =  32.400 [sec])
Background time interval of the image:
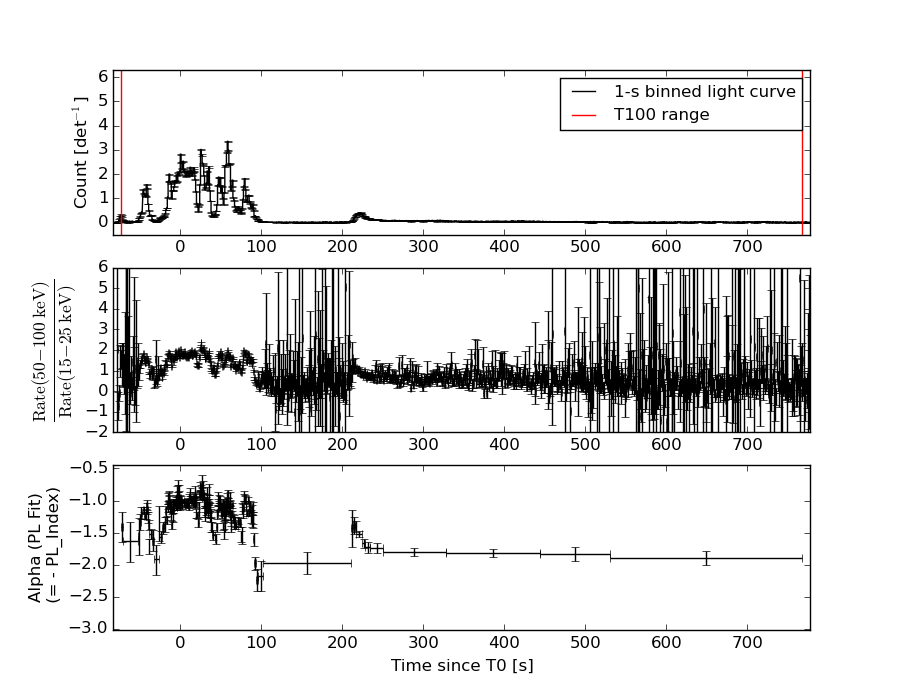
Lightcurves
Notes:
- 1) The mask-weighted light curves are using the flight position.
- 2) Multiple plots of different time binning/intervals are shown to cover all scenarios of short/long GRBs, rate/image triggers, and real/false positives.
- 3) For all the mask-weighted lightcurves, the y-axis units are counts/sec/det where a det is 0.4 x 0.4 = 0.16 sq cm.
- 4) The verticle lines correspond to following: green dotted lines are T50 interval, black dotted lines are T90 interval, blue solid line(s) is a spacecraft slew start time, and orange solid line(s) is a spacecraft slew end time.
- 5) Time of each bin is in the middle of the bin.
1 s binning
From T0-310 s to T0+310 s
From T100_start - 20 s to T100_end + 30 s
Full time interval
64 ms binning
Full time interval
From T100_start to T100_end
From T0-5 sec to T0+5 sec

16 ms binning
From T100_start-5 s to T100_start+5 s
Blue+Cyan dotted lines: Time interval of the scaled map
From 0.000000 to 0.064000
8 ms binning
From T100_start-3 s to T100_start+3 s
Blue+Cyan dotted lines: Time interval of the scaled map
From 0.000000 to 0.064000
2 ms binning
From T100_start-1 s to T100_start+1 s
Blue+Cyan dotted lines: Time interval of the scaled map
From 0.000000 to 0.064000
SN=5 or 10 sec. binning (whichever binning is satisfied first)
SN=5 or 10 sec. binning (T < 200 sec)
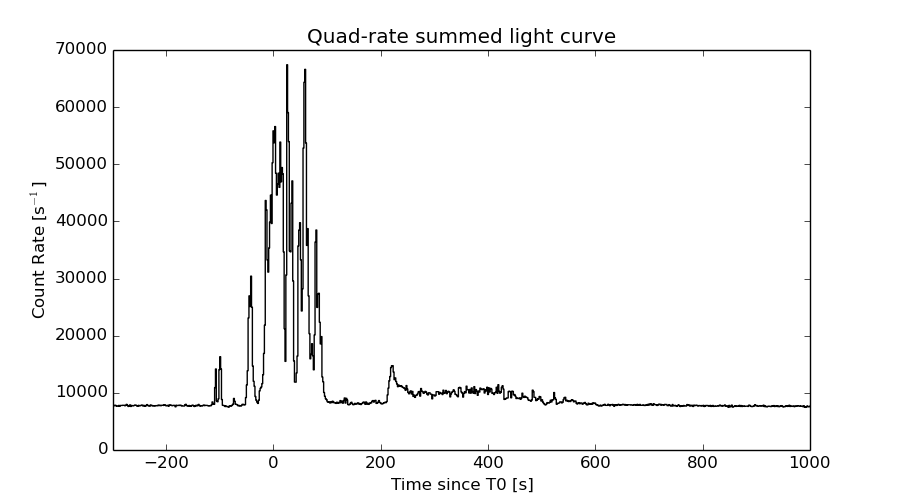
Quad-rate summed light curves (from T0-300s to T0+1000s)
Spectral Evolution
Spectra
Notes:
- 1) The fitting includes the systematic errors.
- 2) When the burst includes telescope slew time periods, the fitting uses an average response file made from multiple 5-s response files through out the slew time plus single time preiod for the non-slew times, and weighted by the total counts in the corresponding time period using addrmf. An average response file is needed becuase a spectral fit using the pre-slew DRM will introduce some errors in both a spectral shape and a normalization if the PHA file contains a lot of the slew/post-slew time interval.
- 3) For fits to more complicated models (e.g. a power-law over a cutoff power-law), the BAT team has decided to require a chi-square improvement of more than 6 for each extra dof.
Time averaged spectrum fit using the average DRM
Power-law model
Multiple GTIs in the spectrum
tstart tstop
-73.736000 -47.580100
-46.092000 767.288000

Spectral model in power-law:
------------------------------------------------------------
Parameters  : value       lower 90%   higher 90%
Photon index: 1.18957     ( -0.0189644   0.0188701 )
Norm@50keV  : 1.59100E-02    ( -0.000194563   0.000193782 )
------------------------------------------------------------
#Fit statistic : Chi-Squared =          15.88 using 59 PHA bins.
# Reduced chi-squared =         0.2786 for     57 degrees of freedom
# Null hypothesis probability =   1.000000e+00

Photon flux (15-150 keV)    in 839.5 sec: 1.86481 ( -0.0258356  0.0259679 ) ph/cm2/s
Energy fluence (15-150 keV)             : 0.000135909 ( -1.35777e-06  1.35798e-06 ) ergs/cm2
Cutoff power-law model
Multiple GTIs in the spectrum
tstart tstop
-73.736000 -47.580100
-46.092000 767.288000
Spectral model in the cutoff power-law:
------------------------------------------------------------
Parameters  : value       lower 90%   higher 90%
Photon index: 1.18442     ( -0.0196461   0.0185428 )
Epeak [keV] : 9999.36      ( -9999.36 -9999.36 )
Norm@50keV  : 1.59886E-02    ( -0.000184248   0.000309437 )
------------------------------------------------------------
#Fit statistic : Chi-Squared =          15.92 using 59 PHA bins.
# Reduced chi-squared =         0.2843 for     56 degrees of freedom
# Null hypothesis probability =   1.000000e+00

Photon flux (15-150 keV)    in 839.5 sec: 1.86335 (    ) ph/cm2/s
Energy fluence (15-150 keV)             : 0.000135975 ( -1.36335e-06  1.35411e-06 ) ergs/cm2
Band function
Multiple GTIs in the spectrum
tstart tstop
-73.736000 -47.580100
-46.092000 767.288000

Spectral model in the Band function:
------------------------------------------------------------
Parameters  : value       lower 90%   higher 90%
alpha       : -0.792165   ( 0.792165   5.71077 )
beta        : -1.19015    ( -0.0198496   0.019319 )
Epeak [keV] : 71.9194      ( -71.9194 -71.9194 )
Norm@50keV   : 3.18943E-02    ( -0.0168626   0 )
------------------------------------------------------------
#Fit statistic : Chi-Squared =          15.83 using 59 PHA bins.
# Reduced chi-squared =         0.2878 for     55 degrees of freedom
# Null hypothesis probability =   1.000000e+00

Photon flux (15-150 keV)    in 839.5 sec:  (    ) ph/cm2/s
Energy fluence (15-150 keV)             : 0 ( 0  0 ) ergs/cm2
Single BB
Spectral model blackbody:
------------------------------------------------------------
Parameters  : value    Lower 90%  Upper 90%
kT [keV]    : 26.5880  (  )
R^2/D10^2   : 3.34565E-02  (   )
(R is the radius in km and D10 is the distance to the source in units of 10 kpc)
------------------------------------------------------------
#Fit statistic : Chi-Squared =        1790.50 using 59 PHA bins.
# Reduced chi-squared =        31.4123 for     57 degrees of freedom
# Null hypothesis probability =   0.000000e+00

Energy  Fluence     90% Error
[keV]   [erg/cm2]   [erg/cm2]
15- 25  3.335e-06   8.437e-08
25- 50  1.950e-05   3.652e-07
50-150  1.011e-04   1.091e-06
15-150  1.239e-04   1.343e-06
Thermal bremsstrahlung (OTTB)
Spectral model: thermal bremsstrahlung
------------------------------------------------------------
Parameters  : value         Lower 90%    Upper 90%
kT [keV]    : 199.363       (      )
Norm        : 8.88643       (     )
------------------------------------------------------------
#Fit statistic : Chi-Squared =        1770.66 using 59 PHA bins.
# Reduced chi-squared =        31.0642 for     57 degrees of freedom
# Null hypothesis probability =   0.000000e+00

Energy  Fluence     90% Error
[keV]   [erg/cm2]   [erg/cm2]
15- 25  1.858e-05   2.560e-07
25- 50  3.573e-05   4.449e-07
50-150  7.837e-05   9.360e-07
15-150  1.327e-04   1.679e-06
Double BB
Spectral model: bbodyrad<1> + bbodyrad<2>
------------------------------------------------------------
Parameters  : value         Lower 90%    Upper 90%
kT1 [keV]   : 8.94973        (-0.410692      0.428231)
R1^2/D10^2  : 0.700073        (-0.103947      0.125776)
kT2 [keV]   : 38.0247        (-1.27962      1.4378)
R2^2/D10^2  : 9.07892E-03    (-0.00105251   0.00110646)
------------------------------------------------------------
#Fit statistic : Chi-Squared =          36.92 using 59 PHA bins.
# Reduced chi-squared =         0.6713 for     55 degrees of freedom
# Null hypothesis probability =   9.709068e-01

Energy  Fluence     90% Error
[keV]   [erg/cm2]   [erg/cm2]
15- 25  1.061e-05   4.785e-07
25- 50  2.915e-05   6.338e-07
50-150  9.600e-05   1.385e-06
15-150  1.358e-04   1.595e-06
Peak spectrum fit
Power-law model
Time interval is from   57.664 sec. to   58.664 sec.

Spectral model in power-law:
------------------------------------------------------------
Parameters  : value       lower 90%   higher 90%
Photon index: 0.991232     ( -0.0335721   0.0334723 )
Norm@50keV  : 0.224667    ( -0.00409468   0.00408549 )
------------------------------------------------------------
#Fit statistic : Chi-Squared =          59.55 using 59 PHA bins.
# Reduced chi-squared =          1.045 for     57 degrees of freedom
# Null hypothesis probability =   3.831426e-01

Photon flux (15-150 keV)    in 1 sec: 25.8558 ( -0.484112  0.483608 ) ph/cm2/s
Energy fluence (15-150 keV)             : 2.43709e-06 ( -4.58723e-08  4.57023e-08 ) ergs/cm2
Cutoff power-law model
Time interval is from   57.664 sec. to   58.664 sec.
Spectral model in the cutoff power-law:
------------------------------------------------------------
Parameters  : value       lower 90%   higher 90%
Photon index: 0.984881     ( -0.147855   0.0621952 )
Epeak [keV] : 9996.62      (   )
Norm@50keV  : 0.226006    ( -0.00405179   0.041248 )
------------------------------------------------------------
#Fit statistic : Chi-Squared =          59.45 using 59 PHA bins.
# Reduced chi-squared =          1.062 for     56 degrees of freedom
# Null hypothesis probability =   3.511220e-01

Photon flux (15-150 keV)    in 1 sec: 25.8331 ( -0.4582  0.4787 ) ph/cm2/s
Energy fluence (15-150 keV)             : 2.43282e-06 ( 0  0 ) ergs/cm2
Band function

Time interval is from   57.664 sec. to   58.664 sec.

Spectral model in the Band function:
------------------------------------------------------------
Parameters  : value       lower 90%   higher 90%
alpha       : -0.816434   ( 0.816434   0.816434 )
beta        : -0.991232    ( -0.0334698   0.0335761 )
Epeak [keV] : 52.5951      (   )
Norm@50keV   : 0.370517    (     )
------------------------------------------------------------
#Fit statistic : Chi-Squared =          59.55 using 59 PHA bins.
# Reduced chi-squared =          1.083 for     55 degrees of freedom
# Null hypothesis probability =   3.137597e-01

Photon flux (15-150 keV)    in 1 sec:  (    ) ph/cm2/s
Energy fluence (15-150 keV)             : 0 ( 0  0 ) ergs/cm2
Single BB
Spectral model blackbody:
------------------------------------------------------------
Parameters  : value    Lower 90%  Upper 90%
kT [keV]    : 23.9871  (  )
R^2/D10^2   : 0.701176  (   )
(R is the radius in km and D10 is the distance to the source in units of 10 kpc)
------------------------------------------------------------
#Fit statistic : Chi-Squared =         567.85 using 59 PHA bins.
# Reduced chi-squared =         9.9623 for     57 degrees of freedom
# Null hypothesis probability =   2.763438e-85

Energy  Fluence     90% Error
[keV]   [erg/cm2]   [erg/cm2]
15- 25  7.161e-08   2.410e-09
25- 50  3.976e-07   1.110e-08
50-150  1.704e-06   4.500e-08
15-150  2.174e-06   4.550e-08
Thermal bremsstrahlung (OTTB)
Spectral model: thermal bremsstrahlung
------------------------------------------------------------
Parameters  : value         Lower 90%    Upper 90%
kT [keV]    : 199.363       (      )
Norm        : 108.952       (     )
------------------------------------------------------------
#Fit statistic : Chi-Squared =         876.78 using 59 PHA bins.
# Reduced chi-squared =         15.382 for     57 degrees of freedom
# Null hypothesis probability =  3.397474e-147

Energy  Fluence     90% Error
[keV]   [erg/cm2]   [erg/cm2]
15- 25  2.713e-07   5.500e-09
25- 50  5.219e-07   9.800e-09
50-150  1.145e-06   2.250e-08
15-150  1.938e-06   3.800e-08
Double BB
Spectral model: bbodyrad<1> + bbodyrad<2>
------------------------------------------------------------
Parameters  : value         Lower 90%    Upper 90%
kT1 [keV]   : 8.34416        (-0.72735      0.797641)
R1^2/D10^2  : 10.1540        (-2.52799      3.57319)
kT2 [keV]   : 36.7801        (-2.42926      3.04221)
R2^2/D10^2  : 0.166627    (-0.0361315   0.0398552)
------------------------------------------------------------
#Fit statistic : Chi-Squared =          65.72 using 59 PHA bins.
# Reduced chi-squared =          1.195 for     55 degrees of freedom
# Null hypothesis probability =   1.525805e-01

Energy  Fluence     90% Error
[keV]   [erg/cm2]   [erg/cm2]
15- 25  1.625e-07   1.100e-08
25- 50  4.527e-07   1.880e-08
50-150  1.835e-06   6.400e-08
15-150  2.450e-06   7.050e-08
Pre-slew spectrum (Pre-slew PHA with pre-slew DRM)
Power-law model

Spectral model in power-law:
------------------------------------------------------------
Parameters  : value       lower 90%   higher 90%
Photon index: 1.03394     ( -0.0193654   0.0192672 )
Norm@50keV  : 0.129116    ( -0.00161002   0.00160339 )
------------------------------------------------------------
#Fit statistic : Chi-Squared =          12.19 using 59 PHA bins.
# Reduced chi-squared =         0.2138 for     57 degrees of freedom
# Null hypothesis probability =   1.000000e+00

Photon flux (15-150 keV)    in 32.4 sec: 14.8954 ( -0.19711  0.197855 ) ph/cm2/s
Energy fluence (15-150 keV)             : 4.47045e-05 ( -4.49657e-07  4.49767e-07 ) ergs/cm2
Cutoff power-law model
Spectral model in the cutoff power-law:
------------------------------------------------------------
Parameters  : value       lower 90%   higher 90%
Photon index: 1.02700     ( -0.0405982   0.0405861 )
Epeak [keV] : 9994.11      (   )
Norm@50keV  : 0.129839    ( -0.00152046   0.0089163 )
------------------------------------------------------------
#Fit statistic : Chi-Squared =          12.14 using 59 PHA bins.
# Reduced chi-squared =         0.2168 for     56 degrees of freedom
# Null hypothesis probability =   1.000000e+00

Photon flux (15-150 keV)    in 32.4 sec: 14.8753 ( -0.1841  0.2088 ) ph/cm2/s
Energy fluence (15-150 keV)             : 4.47282e-05 ( 0  0 ) ergs/cm2
Band function
Spectral model in the Band function:
------------------------------------------------------------
Parameters  : value       lower 90%   higher 90%
alpha       : 4.80189   ( -4.80189   -4.80189 )
beta        : -1.03746    ( -0.0194898   0.0195332 )
Epeak [keV] : 24.2676      ( -24.2676 3.76307 )
Norm@50keV   : 7378.95    ( -74.0431   1.40272e+07 )
------------------------------------------------------------
#Fit statistic : Chi-Squared =          10.85 using 59 PHA bins.
# Reduced chi-squared =         0.1974 for     55 degrees of freedom
# Null hypothesis probability =   1.000000e+00

Photon flux (15-150 keV)    in 32.4 sec:  (    ) ph/cm2/s
Energy fluence (15-150 keV)             : 0 ( 0  0 ) ergs/cm2
S(25-50 keV) vs. S(50-100 keV) plot
S(25-50 keV)  = 2.84e-05
S(50-100 keV) = 4.98e-05
T90 vs. Hardness ratio plot
T90                                   = 364.367999970913 sec.
Hardness ratio (energy fluence ratio) = 1.75352
Color vs. Color plot
Count Ratio  (25-50 keV) / (15-25 keV) = 1.51186
Count Ratio (50-100 keV) / (15-25 keV) = 1.4205
Mask shadow pattern
IMX = -1.496567800679415E-01, IMY = 6.375568929015461E-02
TIME vs. PHA plot around the trigger time
Blue+Cyan dotted lines: Time interval of the scaled map
From 0.000000 to 0.064000
TIME vs. DetID plot around the trigger time
Blue+Cyan dotted lines: Time interval of the scaled map
From 0.000000 to 0.064000
100 us light curve (15-350 keV)
Blue+Cyan dotted lines: Time interval of the scaled map
From 0.000000 to 0.064000
Spacecraft aspect plot
Bright source in the pre-burst/pre-slew/post-slew images
Pre-burst image of 15-350 keV band
Time interval of the image:
Pre-slew background subtracted image of 15-350 keV band
Time interval of the image:
-14.391400 18.008590

# RAcent  DECcent POSerr Theta    Phi  PeakCts   SNR AngSep     Name
#  [deg]    [deg]    ['] [deg]  [deg]                   [']
254.2791  35.4422   24.0  35.2  149.5  -0.3811  -0.5   10.6	Her X-1
276.1725  43.7791    2.5  42.4  121.6   9.8172   4.6 ------	UNKNOWN
281.1648  66.1318    2.4  34.7   87.2   5.3274   4.7 ------	UNKNOWN
268.2604  26.0508    3.4  50.2  145.5   8.5757   3.4 ------	UNKNOWN
246.0993  54.2087    2.6  20.3  121.0   2.3057   4.3 ------	UNKNOWN
215.8981  45.6036    0.1   9.2 -156.9  63.3232 133.0 ------	UNKNOWN
244.1170   8.3021    2.4  53.1 -177.5   6.5141   4.8 ------	UNKNOWN
240.9331   3.9726    2.0  55.9 -171.9  10.2983   5.7 ------	UNKNOWN
155.3910  42.2121    2.7  37.8  -40.0   3.1377   4.3 ------	UNKNOWN
213.6980  12.2921    2.7  42.0 -138.8   4.0883   4.3 ------	UNKNOWN
220.2930  -0.1121    2.5  54.9 -146.3  13.7220   4.7 ------	UNKNOWN
195.7685  13.2385    2.3  42.7 -112.8   9.5444   5.1 ------	UNKNOWN
Post-slew image of 15-350 keV band
Time interval of the image:
54.808590 962.974900

# RAcent  DECcent POSerr Theta    Phi  PeakCts   SNR AngSep     Name
#  [deg]    [deg]    ['] [deg]  [deg]                   [']
254.5061  35.3991    2.4  30.7  123.4   5.6073   4.9    4.1	Her X-1
257.7833   8.7501    3.1  51.5  150.2  14.2997   3.7 ------	UNKNOWN
215.8994  45.6044    0.1   0.0 -171.2  76.8186 107.9 ------	UNKNOWN
213.7815  20.8617    2.8  24.8 -147.6   2.9238   4.1 ------	UNKNOWN
128.7367  49.3989    2.2  55.6  -24.3  14.1124   5.2 ------	UNKNOWN
Plot creation:
Sat May 30 15:42:01 EDT 2015