Click here for the BAT GCN circular template
Image
Pre-slew 15.0-350.0 keV image (Event data)
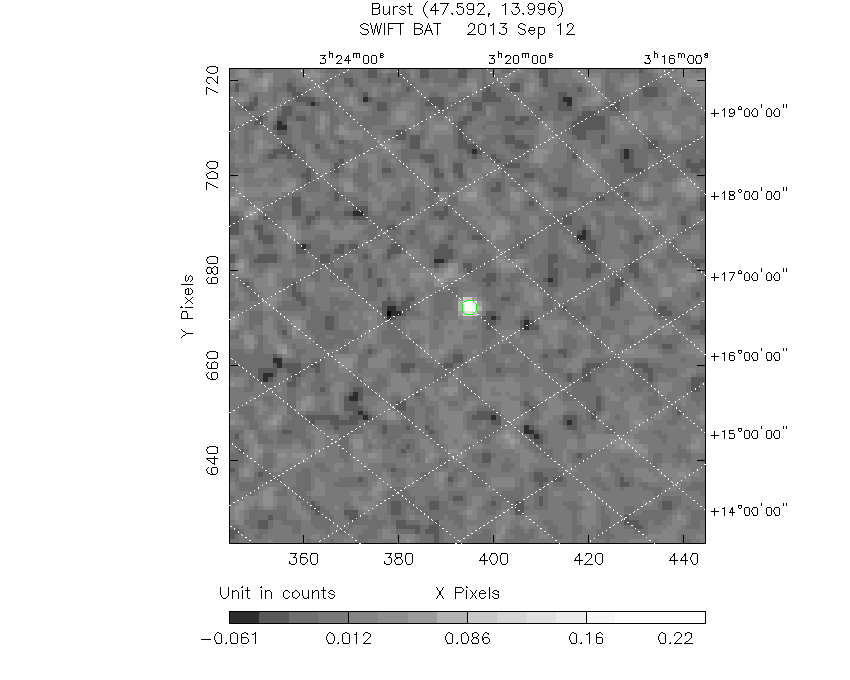
#   RAcent    DECcent   POSerr    Theta     Phi              Peak Cts       SNR   Name
   47.6065    13.9984   0.0129    47.6792   -21.9723         0.2522194     14.908 TRIG_00570465

Foreground time interval of the image:
  0.004   0.320 (delta_t =   0.316 [sec])
Background time interval of the image:
-239.956   0.004 (delta_t = 239.960 [sec])
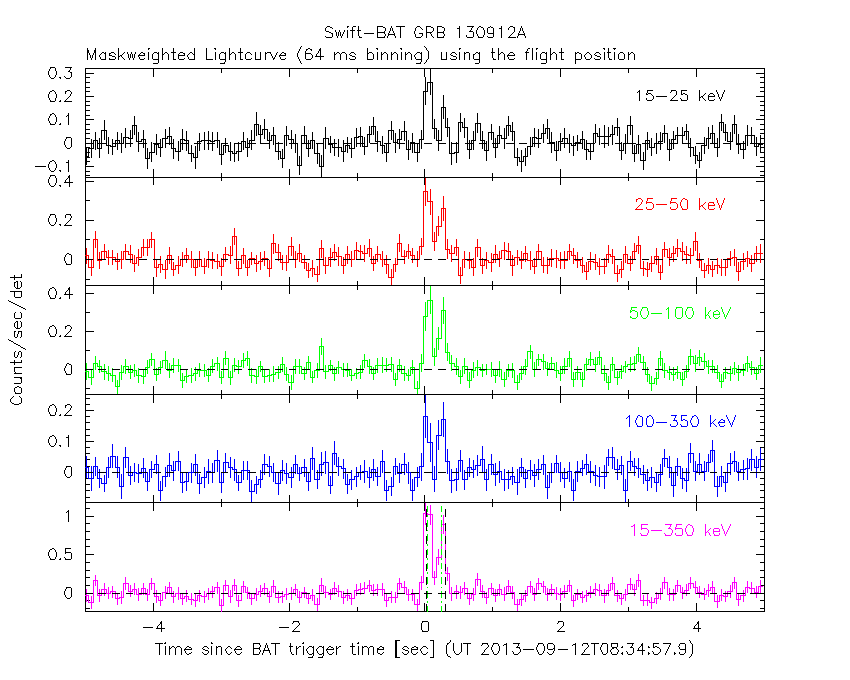
Lightcurves
Notes:
- 1) The mask-weighted light curves are using the flight position.
- 2) Multiple plots of different time binning/intervals are shown to cover all scenarios of short/long GRBs, rate/image triggers, and real/false positives.
- 3) For all the mask-weighted lightcurves, the y-axis units are counts/sec/det where a det is 0.4 x 0.4 = 0.16 sq cm.
- 4) The verticle lines correspond to following: green dotted lines are T50 interval, black dotted lines are T90 interval, blue solid line(s) is a spacecraft slew start time, and orange solid line(s) is a spacecraft slew end time.
- 5) Time of each bin is in the middle of the bin.
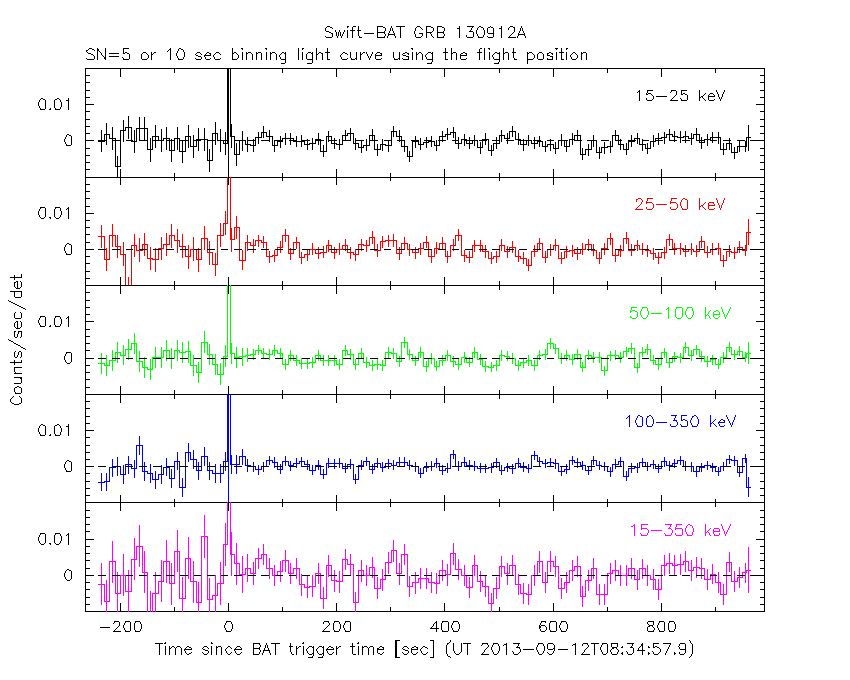
1 s binning
From T0-310 s to T0+310 s
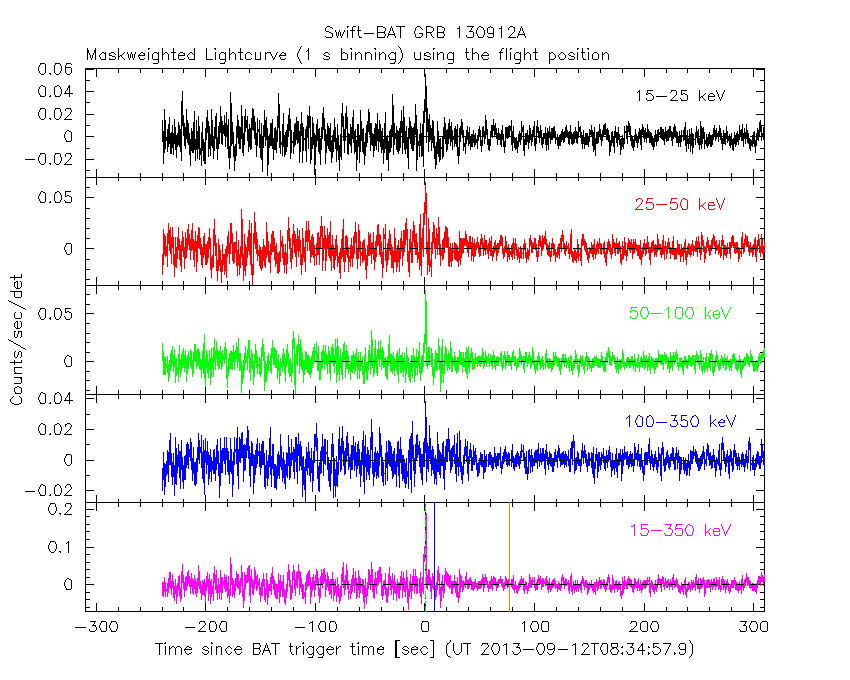
From T100_start - 20 s to T100_end + 30 s

Full time interval

64 ms binning
Full time interval

From T100_start to T100_end

From T0-5 sec to T0+5 sec
16 ms binning
From T100_start-5 s to T100_start+5 s
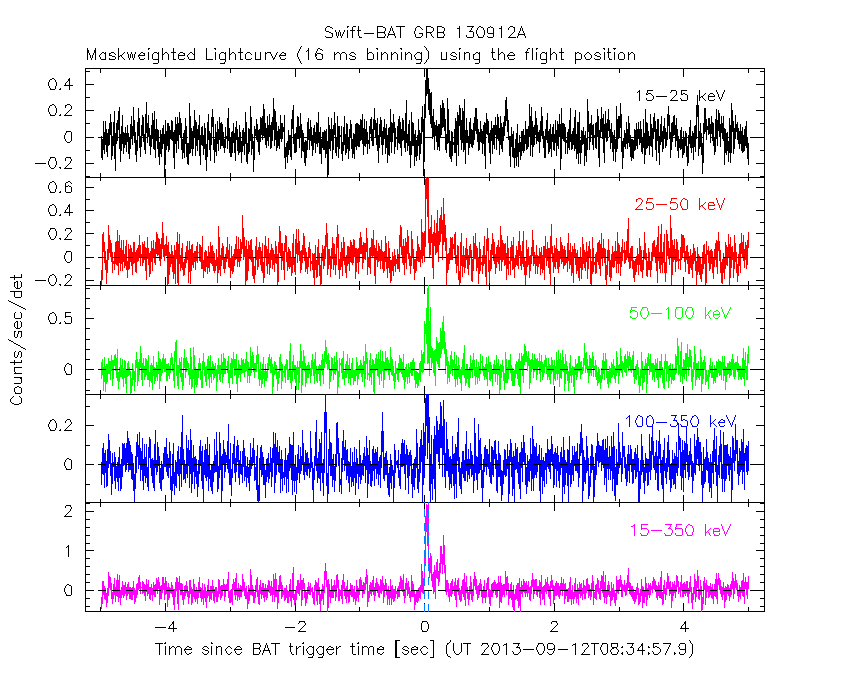
Blue+Cyan dotted lines: Time interval of the scaled map
From 0.000000 to 0.064000
8 ms binning
From T100_start-3 s to T100_start+3 s

Blue+Cyan dotted lines: Time interval of the scaled map
From 0.000000 to 0.064000
2 ms binning
From T100_start-1 s to T100_start+1 s

Blue+Cyan dotted lines: Time interval of the scaled map
From 0.000000 to 0.064000
SN=5 or 10 sec. binning (whichever binning is satisfied first)
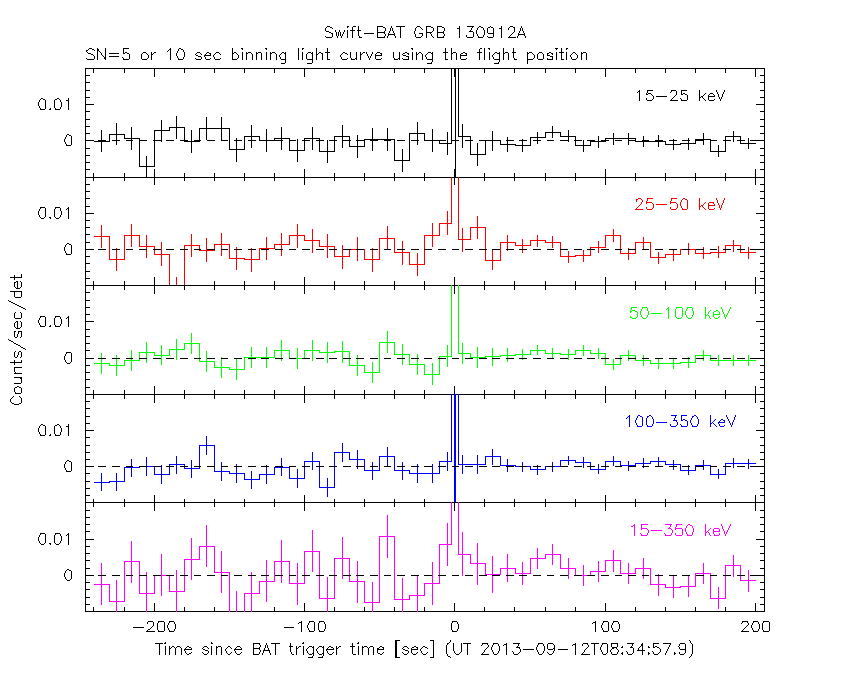
SN=5 or 10 sec. binning (T < 200 sec)
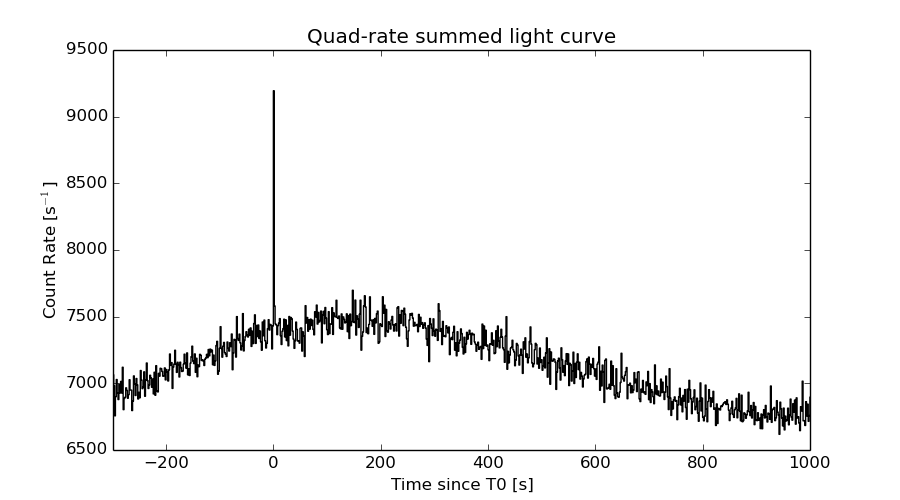
Quad-rate summed light curves (from T0-300s to T0+1000s)
Spectral Evolution

Spectra
Notes:
- 1) The fitting includes the systematic errors.
- 2) When the burst includes telescope slew time periods, the fitting uses an average response file made from multiple 5-s response files through out the slew time plus single time preiod for the non-slew times, and weighted by the total counts in the corresponding time period using addrmf. An average response file is needed becuase a spectral fit using the pre-slew DRM will introduce some errors in both a spectral shape and a normalization if the PHA file contains a lot of the slew/post-slew time interval.
- 3) For fits to more complicated models (e.g. a power-law over a cutoff power-law), the BAT team has decided to require a chi-square improvement of more than 6 for each extra dof.
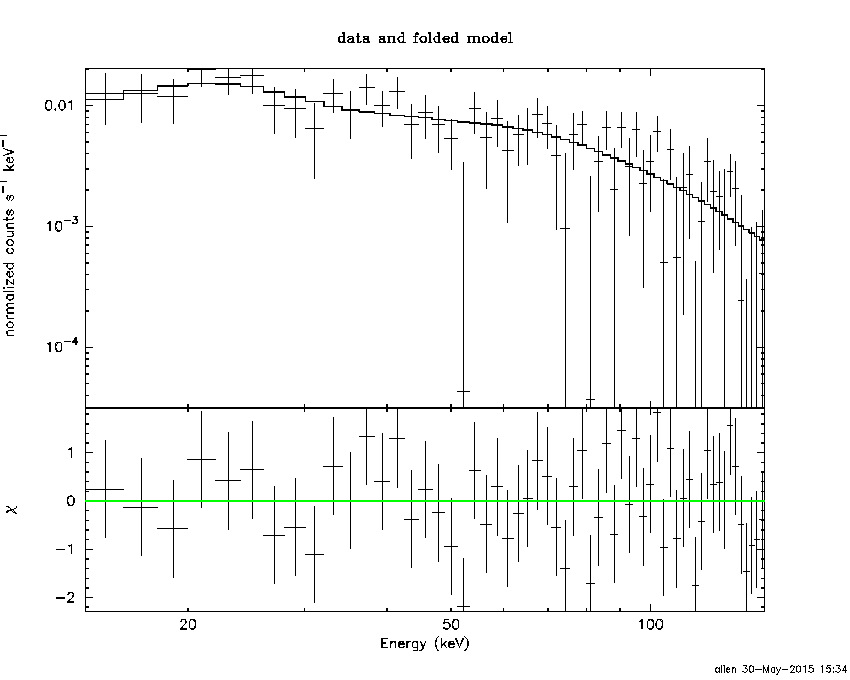
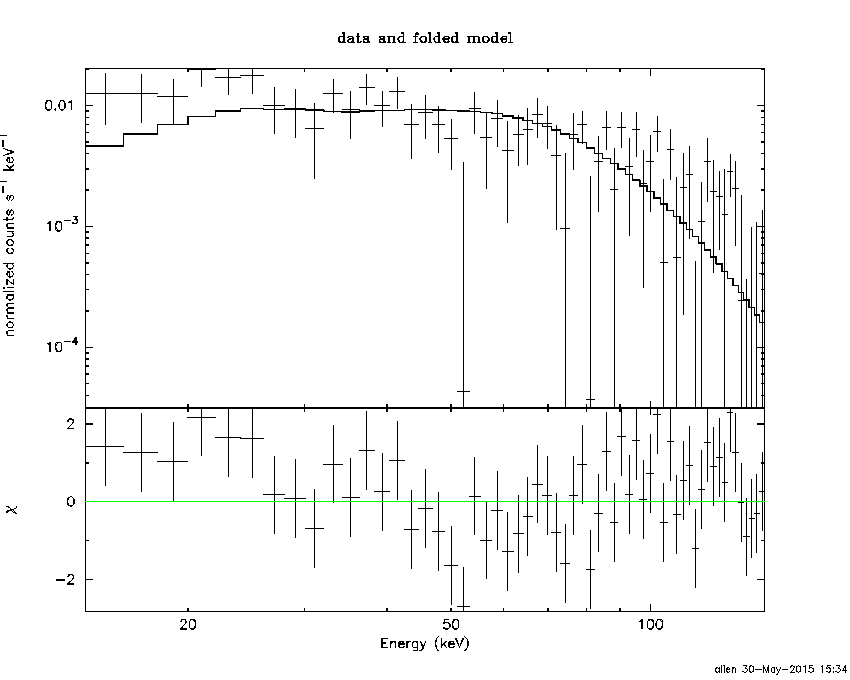
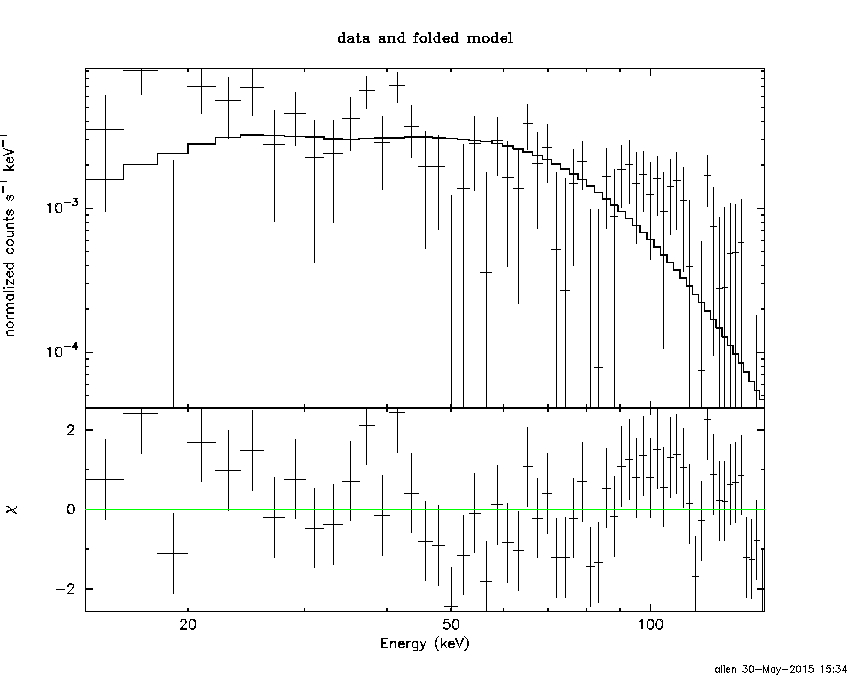
Time averaged spectrum fit using the average DRM
Power-law model

Time interval is from    0.004 sec. to    0.320 sec.

Spectral model in power-law:
------------------------------------------------------------
Parameters  : value       lower 90%   higher 90%
Photon index: 1.20452     ( -0.19507   0.195473 )
Norm@50keV  : 5.45680E-02    ( -0.00597822   0.00597635 )
------------------------------------------------------------
#Fit statistic : Chi-Squared =          46.51 using 59 PHA bins.
# Reduced chi-squared =         0.8160 for     57 degrees of freedom
# Null hypothesis probability =   8.380601e-01

Photon flux (15-150 keV)    in 0.316 sec: 6.40926 ( -0.717936  0.719126 ) ph/cm2/s
Energy fluence (15-150 keV)             : 1.7472e-07 ( -2.15764e-08  2.17022e-08 ) ergs/cm2
Cutoff power-law model

Time interval is from    0.004 sec. to    0.320 sec.
Spectral model in the cutoff power-law:
------------------------------------------------------------
Parameters  : value       lower 90%   higher 90%
Photon index: 1.20007     ( -0.562841   0.24488 )
Epeak [keV] : 1.00000E+04      (   )
Norm@50keV  : 5.48305E-02    (     )
------------------------------------------------------------
#Fit statistic : Chi-Squared =          46.52 using 59 PHA bins.
# Reduced chi-squared =         0.8307 for     56 degrees of freedom
# Null hypothesis probability =   8.127764e-01

Photon flux (15-150 keV)    in 0.316 sec: 6.41198 ( -0.71995  0.71436 ) ph/cm2/s
Energy fluence (15-150 keV)             : 1.74428e-07 ( -2.12583e-08  2.19339e-08 ) ergs/cm2
Band function
Time interval is from    0.004 sec. to    0.320 sec.

Spectral model in the Band function:
------------------------------------------------------------
Parameters  : value       lower 90%   higher 90%
alpha       : -0.890949   ( 0.890846   0.890846 )
beta        : -1.20683    ( 1.20686   0.197677 )
Epeak [keV] : 78.5118      ( -78.6598 901.959 )
Norm@50keV   : 9.65694E-02    ( -0.0479231   7.90489 )
------------------------------------------------------------
#Fit statistic : Chi-Squared =          46.51 using 59 PHA bins.
# Reduced chi-squared =         0.8457 for     55 degrees of freedom
# Null hypothesis probability =   7.854095e-01

Photon flux (15-150 keV)    in 0.316 sec:  (    ) ph/cm2/s
Energy fluence (15-150 keV)             : 0 ( 0  0 ) ergs/cm2
Single BB
Spectral model blackbody:
------------------------------------------------------------
Parameters  : value    Lower 90%  Upper 90%
kT [keV]    : 19.9031  (-3.22647  3.94437)
R^2/D10^2   : 0.297232  (-0.129651   0.228805)
(R is the radius in km and D10 is the distance to the source in units of 10 kpc)
------------------------------------------------------------
#Fit statistic : Chi-Squared =          72.09 using 59 PHA bins.
# Reduced chi-squared =          1.265 for     57 degrees of freedom
# Null hypothesis probability =   8.594275e-02

Energy  Fluence     90% Error
[keV]   [erg/cm2]   [erg/cm2]
15- 25  7.186e-09   1.681e-09
25- 50  3.568e-08   5.976e-09
50-150  1.047e-07   2.150e-08
15-150  1.476e-07   2.424e-08
Thermal bremsstrahlung (OTTB)
Spectral model: thermal bremsstrahlung
------------------------------------------------------------
Parameters  : value         Lower 90%    Upper 90%
kT [keV]    : 200.000       (      )
Norm        : 26.2601       (-2.93964     2.93953)
------------------------------------------------------------
#Fit statistic : Chi-Squared =          56.29 using 59 PHA bins.
# Reduced chi-squared =         0.9875 for     57 degrees of freedom
# Null hypothesis probability =   5.017109e-01

Energy  Fluence     90% Error
[keV]   [erg/cm2]   [erg/cm2]
15- 25  2.066e-08   1.145e-08
25- 50  3.974e-08   2.179e-08
50-150  8.716e-08   4.748e-08
15-150  1.476e-07   8.082e-08
Double BB

Spectral model: bbodyrad<1> + bbodyrad<2>
------------------------------------------------------------
Parameters  : value         Lower 90%    Upper 90%
kT1 [keV]   : 7.48744        (-2.24065      2.73086)
R1^2/D10^2  : 4.77446        (-3.04442      10.3775)
kT2 [keV]   : 36.3465        (-9.67191      24.0388)
R2^2/D10^2  : 3.77153E-02    (-0.0284255   0.0490388)
------------------------------------------------------------
#Fit statistic : Chi-Squared =          45.36 using 59 PHA bins.
# Reduced chi-squared =         0.8247 for     55 degrees of freedom
# Null hypothesis probability =   8.198892e-01

Energy  Fluence     90% Error
[keV]   [erg/cm2]   [erg/cm2]
15- 25  1.667e-08   8.713e-09
25- 50  3.693e-08   1.672e-08
50-150  1.263e-07   6.460e-08
15-150  1.798e-07   8.050e-08
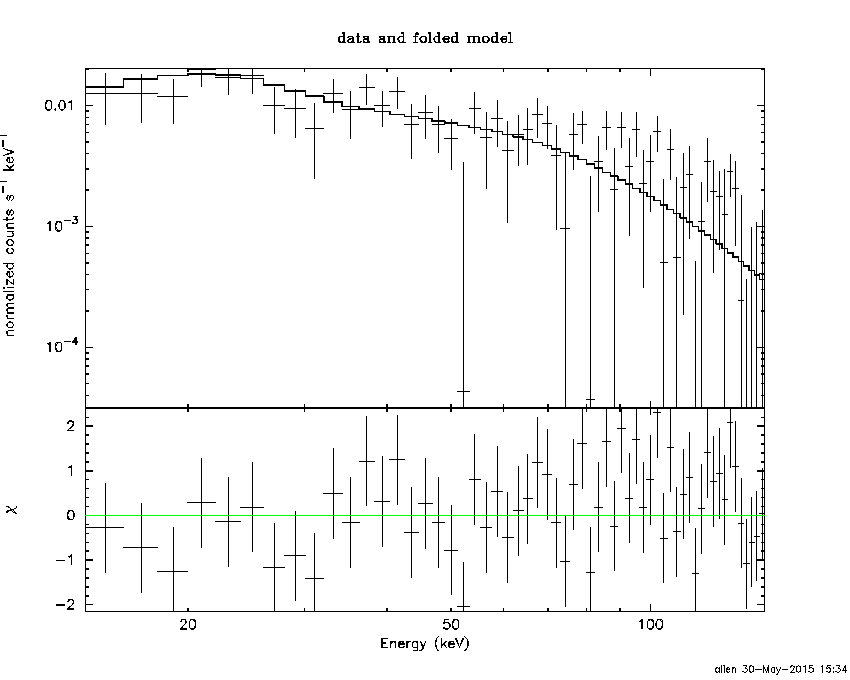
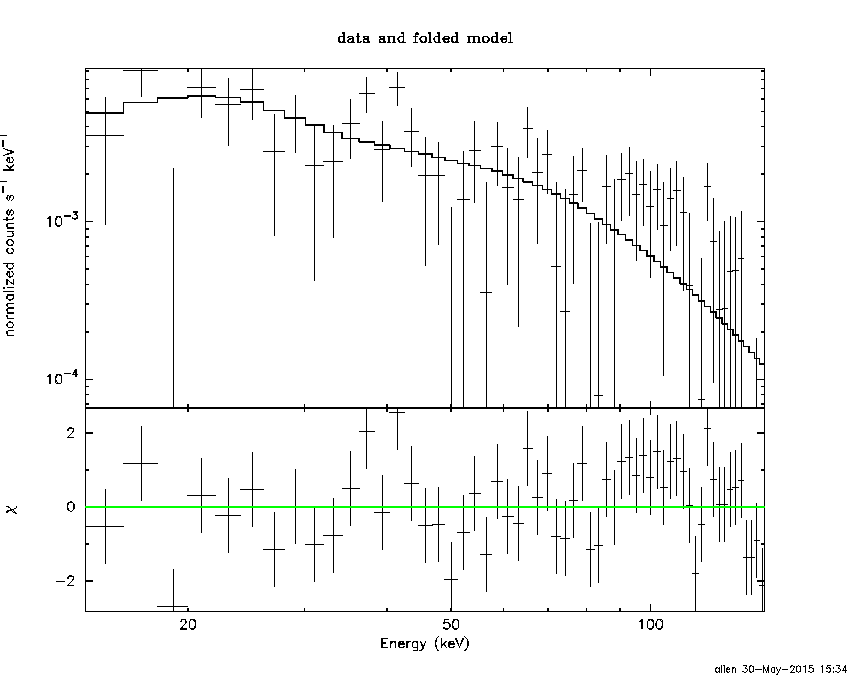
Peak spectrum fit
Power-law model
Time interval is from   -0.336 sec. to    0.664 sec.

Spectral model in power-law:
------------------------------------------------------------
Parameters  : value       lower 90%   higher 90%
Photon index: 1.26773     ( -0.258017   0.256151 )
Norm@50keV  : 1.81503E-02    ( -0.00264424   0.00264421 )
------------------------------------------------------------
#Fit statistic : Chi-Squared =          68.04 using 59 PHA bins.
# Reduced chi-squared =          1.194 for     57 degrees of freedom
# Null hypothesis probability =   1.503185e-01

Photon flux (15-150 keV)    in 1 sec: 2.15303 ( -0.327137  0.328908 ) ph/cm2/s
Energy fluence (15-150 keV)             : 1.80813e-07 ( -2.86703e-08  2.88792e-08 ) ergs/cm2
Cutoff power-law model
Time interval is from   -0.336 sec. to    0.664 sec.
Spectral model in the cutoff power-law:
------------------------------------------------------------
Parameters  : value       lower 90%   higher 90%
Photon index: 2.08567     (     )
Epeak [keV] : 31.8322      (   )
Norm@50keV  : 4.16004E-03    (     )
------------------------------------------------------------
#Fit statistic : Chi-Squared =          66.88 using 59 PHA bins.
# Reduced chi-squared =          1.194 for     56 degrees of freedom
# Null hypothesis probability =   1.514160e-01

Photon flux (15-150 keV)    in 1 sec: 2.13534 ( -0.33614  0.33683 ) ph/cm2/s
Energy fluence (15-150 keV)             : 1.79462e-07 ( -2.9795e-08  2.9582e-08 ) ergs/cm2
Band function

Time interval is from   -0.336 sec. to    0.664 sec.

Spectral model in the Band function:
------------------------------------------------------------
Parameters  : value       lower 90%   higher 90%
alpha       : -0.538055   ( 0.533593   0.533593 )
beta        : -1.35400    ( 1.35626   0.333114 )
Epeak [keV] : 75.5259      ( -75.529 842.823 )
Norm@50keV   : 4.88265E-02    ( -0.0496603   1.32797e+06 )
------------------------------------------------------------
#Fit statistic : Chi-Squared =          67.79 using 59 PHA bins.
# Reduced chi-squared =          1.232 for     55 degrees of freedom
# Null hypothesis probability =   1.154201e-01

Photon flux (15-150 keV)    in 1 sec:  (    ) ph/cm2/s
Energy fluence (15-150 keV)             : 0 ( 0  0 ) ergs/cm2
Single BB
Spectral model blackbody:
------------------------------------------------------------
Parameters  : value    Lower 90%  Upper 90%
kT [keV]    : 19.3458  (-3.82977  4.98463)
R^2/D10^2   : 0.107914  (-0.0564598   0.116953)
(R is the radius in km and D10 is the distance to the source in units of 10 kpc)
------------------------------------------------------------
#Fit statistic : Chi-Squared =          79.94 using 59 PHA bins.
# Reduced chi-squared =          1.402 for     57 degrees of freedom
# Null hypothesis probability =   2.418337e-02

Energy  Fluence     90% Error
[keV]   [erg/cm2]   [erg/cm2]
15- 25  7.886e-09   2.455e-09
25- 50  3.841e-08   1.011e-08
50-150  1.060e-07   2.990e-08
15-150  1.523e-07   3.735e-08
Thermal bremsstrahlung (OTTB)
Spectral model: thermal bremsstrahlung
------------------------------------------------------------
Parameters  : value         Lower 90%    Upper 90%
kT [keV]    : 200.000       (      )
Norm        : 8.98680       (-1.32913     1.32895)
------------------------------------------------------------
#Fit statistic : Chi-Squared =          71.70 using 59 PHA bins.
# Reduced chi-squared =          1.258 for     57 degrees of freedom
# Null hypothesis probability =   9.100811e-02

Energy  Fluence     90% Error
[keV]   [erg/cm2]   [erg/cm2]
15- 25  2.239e-08   1.277e-08
25- 50  4.307e-08   2.430e-08
50-150  9.445e-08   5.255e-08
15-150  1.599e-07   8.945e-08
Double BB
Spectral model: bbodyrad<1> + bbodyrad<2>
------------------------------------------------------------
Parameters  : value         Lower 90%    Upper 90%
kT1 [keV]   : 8.10932        (-2.69679      3.32756)
R1^2/D10^2  : 1.25381        (-0.854007      3.55309)
kT2 [keV]   : 35.0129        (-10.8917      32.3234)
R2^2/D10^2  : 1.29152E-02    (-0.0107927   0.0318564)
------------------------------------------------------------
#Fit statistic : Chi-Squared =          66.13 using 59 PHA bins.
# Reduced chi-squared =          1.202 for     55 degrees of freedom
# Null hypothesis probability =   1.446377e-01

Energy  Fluence     90% Error
[keV]   [erg/cm2]   [erg/cm2]
15- 25  1.730e-08   9.785e-09
25- 50  4.164e-08   2.236e-08
50-150  1.250e-07   6.910e-08
15-150  1.839e-07   9.470e-08
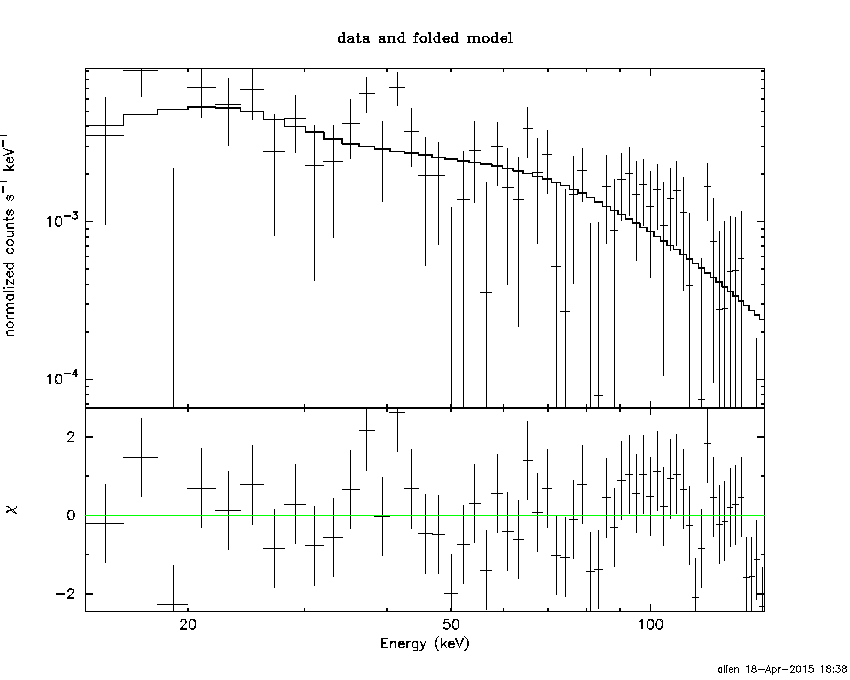
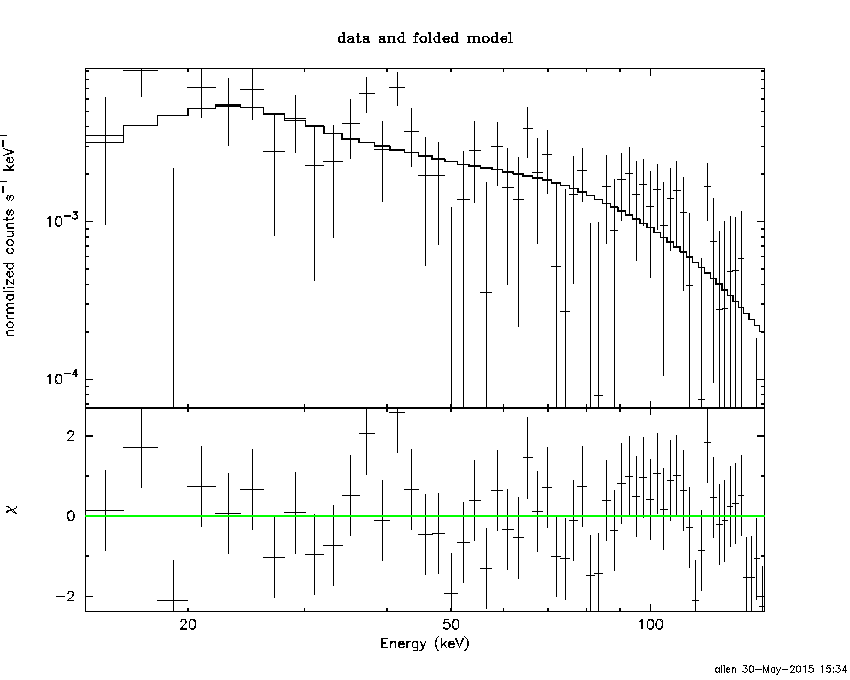
Pre-slew spectrum (Pre-slew PHA with pre-slew DRM)
Power-law model

Spectral model in power-law:
------------------------------------------------------------
Parameters  : value       lower 90%   higher 90%
Photon index: 1.20452     ( -0.19507   0.195473 )
Norm@50keV  : 5.45680E-02    ( -0.00597822   0.00597635 )
------------------------------------------------------------
#Fit statistic : Chi-Squared =          46.51 using 59 PHA bins.
# Reduced chi-squared =         0.8160 for     57 degrees of freedom
# Null hypothesis probability =   8.380601e-01

Photon flux (15-150 keV)    in 0.316 sec: 6.40926 ( -0.717936  0.719126 ) ph/cm2/s
Energy fluence (15-150 keV)             : 1.7472e-07 ( -2.15764e-08  2.17022e-08 ) ergs/cm2
Cutoff power-law model

Spectral model in the cutoff power-law:
------------------------------------------------------------
Parameters  : value       lower 90%   higher 90%
Photon index: 1.20007     ( -0.562841   0.24488 )
Epeak [keV] : 1.00000E+04      (   )
Norm@50keV  : 5.48305E-02    (     )
------------------------------------------------------------
#Fit statistic : Chi-Squared =          46.52 using 59 PHA bins.
# Reduced chi-squared =         0.8307 for     56 degrees of freedom
# Null hypothesis probability =   8.127764e-01

Photon flux (15-150 keV)    in 0.316 sec: 6.41198 ( -0.71995  0.71436 ) ph/cm2/s
Energy fluence (15-150 keV)             : 1.74428e-07 ( -2.12583e-08  2.19339e-08 ) ergs/cm2
Band function

Spectral model in the Band function:
------------------------------------------------------------
Parameters  : value       lower 90%   higher 90%
alpha       : -0.890949   ( 0.890846   0.890846 )
beta        : -1.20683    ( 1.20686   0.197677 )
Epeak [keV] : 78.5118      ( -78.6598 901.959 )
Norm@50keV   : 9.65694E-02    ( -0.0479185   4.10663 )
------------------------------------------------------------
#Fit statistic : Chi-Squared =          46.51 using 59 PHA bins.
# Reduced chi-squared =         0.8457 for     55 degrees of freedom
# Null hypothesis probability =   7.854095e-01

Photon flux (15-150 keV)    in 0.316 sec:  (    ) ph/cm2/s
Energy fluence (15-150 keV)             : 0 ( 0  0 ) ergs/cm2
S(25-50 keV) vs. S(50-100 keV) plot
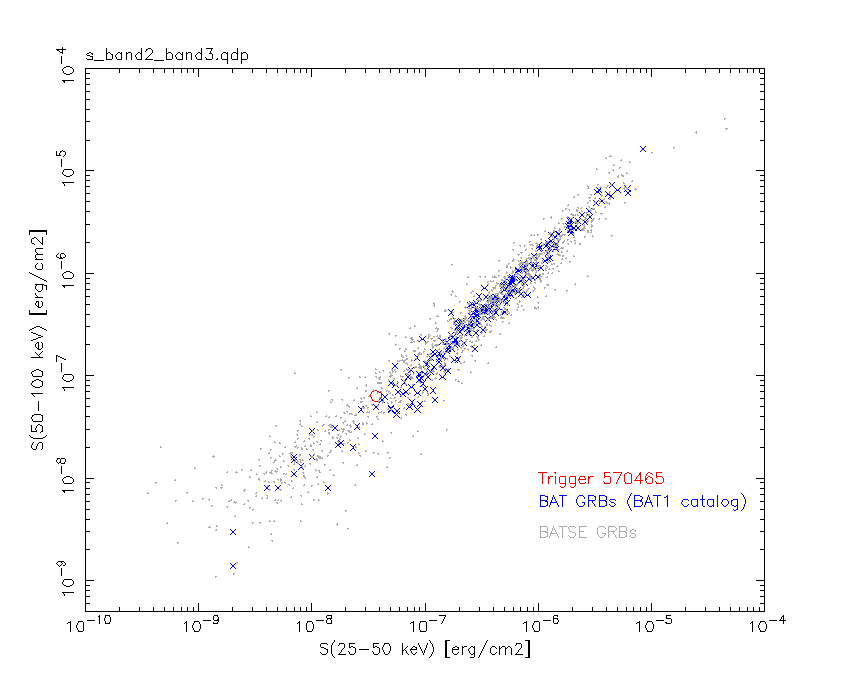
S(25-50 keV)  = 3.68e-08
S(50-100 keV) = 6.39e-08
T90 vs. Hardness ratio plot
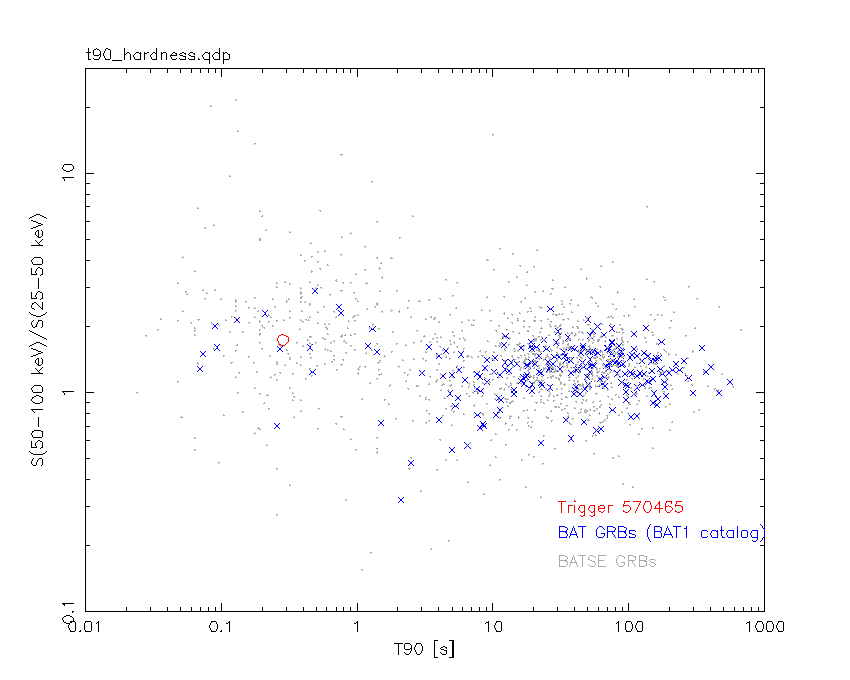
T90                                   = 0.283999919891357 sec.
Hardness ratio (energy fluence ratio) = 1.73641
Color vs. Color plot
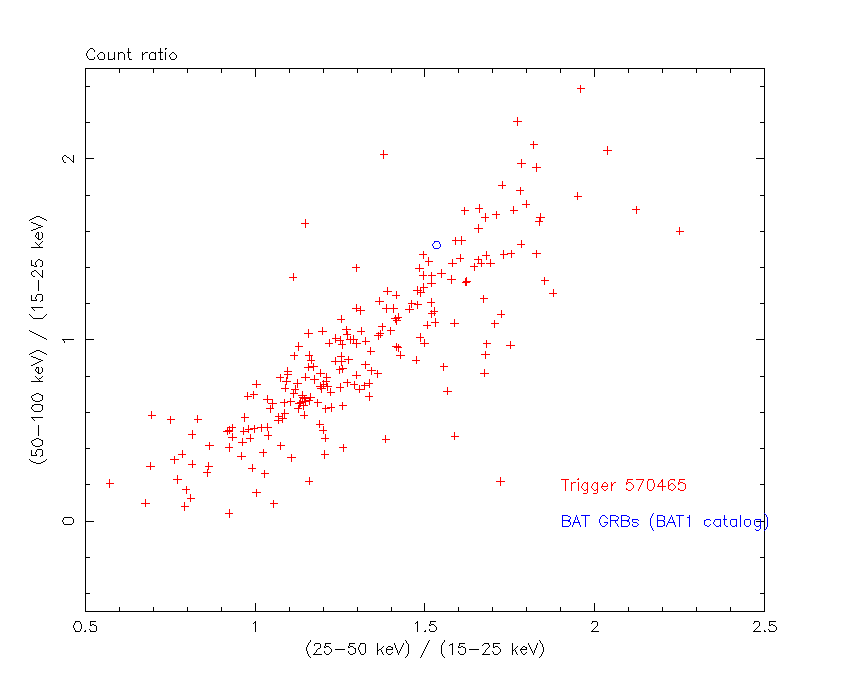
Count Ratio  (25-50 keV) / (15-25 keV) = 1.53418
Count Ratio (50-100 keV) / (15-25 keV) = 1.52397
Mask shadow pattern

IMX = 1.018415789227998E+00, IMY = 4.108947869760430E-01
TIME vs. PHA plot around the trigger time

Blue+Cyan dotted lines: Time interval of the scaled map
From 0.000000 to 0.064000
TIME vs. DetID plot around the trigger time

Blue+Cyan dotted lines: Time interval of the scaled map
From 0.000000 to 0.064000
100 us light curve (15-350 keV)
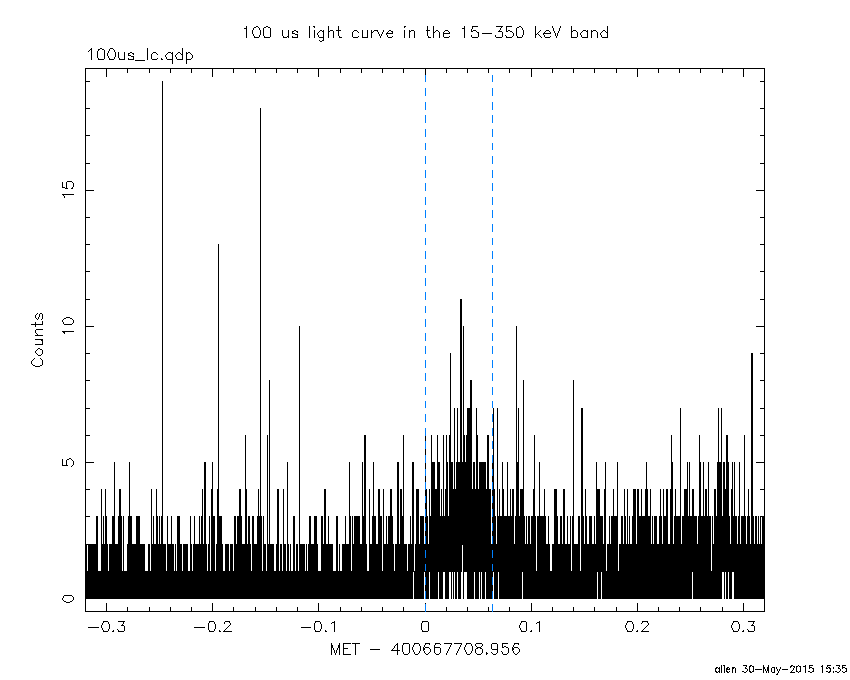
Blue+Cyan dotted lines: Time interval of the scaled map
From 0.000000 to 0.064000
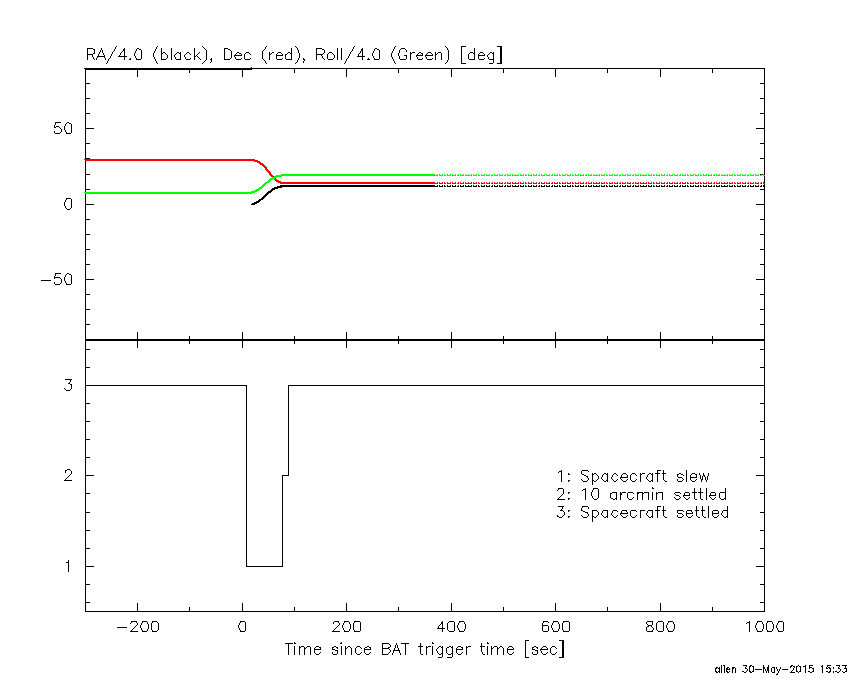
Spacecraft aspect plot
Bright source in the pre-burst/pre-slew/post-slew images
Pre-burst image of 15-350 keV band
Time interval of the image:
-239.956000 0.004000

# RAcent  DECcent POSerr Theta    Phi  PeakCts   SNR AngSep     Name
#  [deg]    [deg]    ['] [deg]  [deg]                   [']
299.5537  35.2740    8.0  49.5  173.1   0.6405   1.4    4.7	Cyg X-1
308.1330  40.9129    1.7  42.2  179.9   2.0246   6.9    2.6	Cyg X-3
326.2038  38.1812    2.5  28.1  176.9   0.8727   4.5    8.6	Cyg X-2
324.6058  18.1346    2.3  33.0  137.8   1.4011   5.0 ------	UNKNOWN
 54.7380  36.1769    4.2  47.0  -53.5   2.4558   2.8 ------	UNKNOWN
Pre-slew background subtracted image of 15-350 keV band
Time interval of the image:
0.004000 0.320000

# RAcent  DECcent POSerr Theta    Phi  PeakCts   SNR AngSep     Name
#  [deg]    [deg]    ['] [deg]  [deg]                   [']
299.7066  35.1434   15.2  49.4  172.9  -0.0131  -0.8    6.7	Cyg X-1
307.9171  40.9037  102.2  42.4  179.9  -0.0013  -0.1    9.2	Cyg X-3
326.1715  38.3225  495.9  28.2  177.1   0.0002   0.0    0.1	Cyg X-2
300.0769  21.6199    2.3  52.9  156.0   0.1681   5.1 ------	UNKNOWN
 47.6066  13.9984    0.8  47.7  -22.0   0.2522  14.9 ------	UNKNOWN
 29.4651  47.7826    2.4  30.0  -76.3   0.0565   4.9 ------	UNKNOWN
 39.4607  37.6698    2.3  34.7  -54.6   0.0548   5.0 ------	UNKNOWN
Post-slew image of 15-350 keV band
Time interval of the image:
77.344590 962.164300

# RAcent  DECcent POSerr Theta    Phi  PeakCts   SNR AngSep     Name
#  [deg]    [deg]    ['] [deg]  [deg]                   [']
 83.6277  22.0012    0.4  35.1  -94.9  36.4178  32.5    0.9	Crab
 29.1837 -15.7740    3.8  34.9   45.7   2.4438   3.0 ------	UNKNOWN
 42.0512   1.4076    2.4  13.7   37.7   2.1599   4.7 ------	UNKNOWN
 56.8687 -40.6469    2.7  55.3    5.0   9.1436   4.3 ------	UNKNOWN
 71.1525 -32.3299    2.8  51.5  -12.0   4.3838   4.2 ------	UNKNOWN
 72.6838 -38.1858    2.9  57.2   -9.8   8.0378   4.0 ------	UNKNOWN
 87.9906 -27.1115    3.3  56.8  -30.0  10.0322   3.5 ------	UNKNOWN
Plot creation:
Sat May 30 15:35:18 EDT 2015