Click here for the BAT GCN circular template
Image
Pre-slew 15.0-350.0 keV image (Event data)
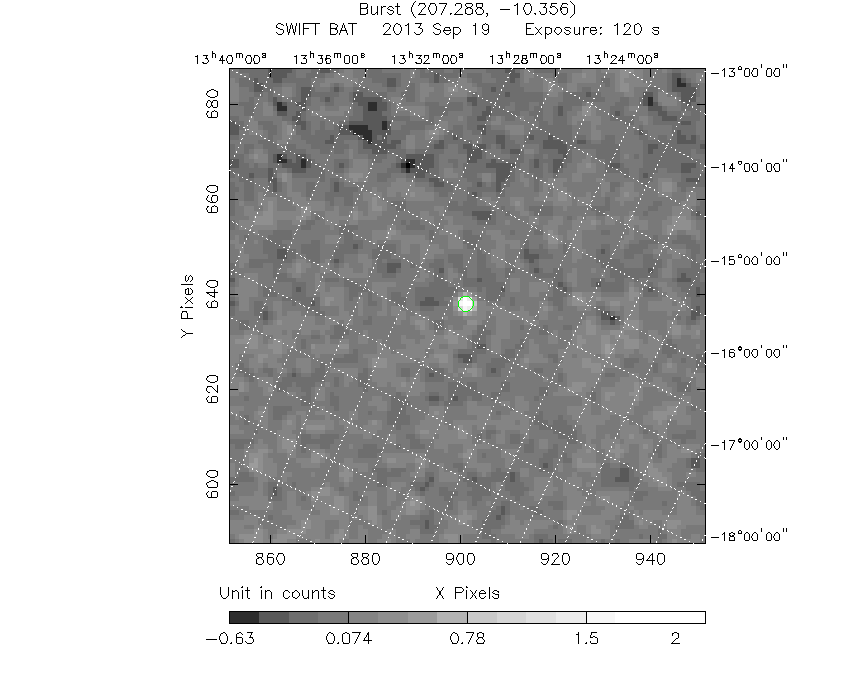
#   RAcent    DECcent   POSerr    Theta     Phi              Peak Cts       SNR   Name
  207.2806   -10.3542   0.0119    18.8778   -97.5897         2.2520415     16.120 TRIG_00571271

Foreground time interval of the image:
-11.699 108.068 (delta_t = 119.767 [sec])
Background time interval of the image:
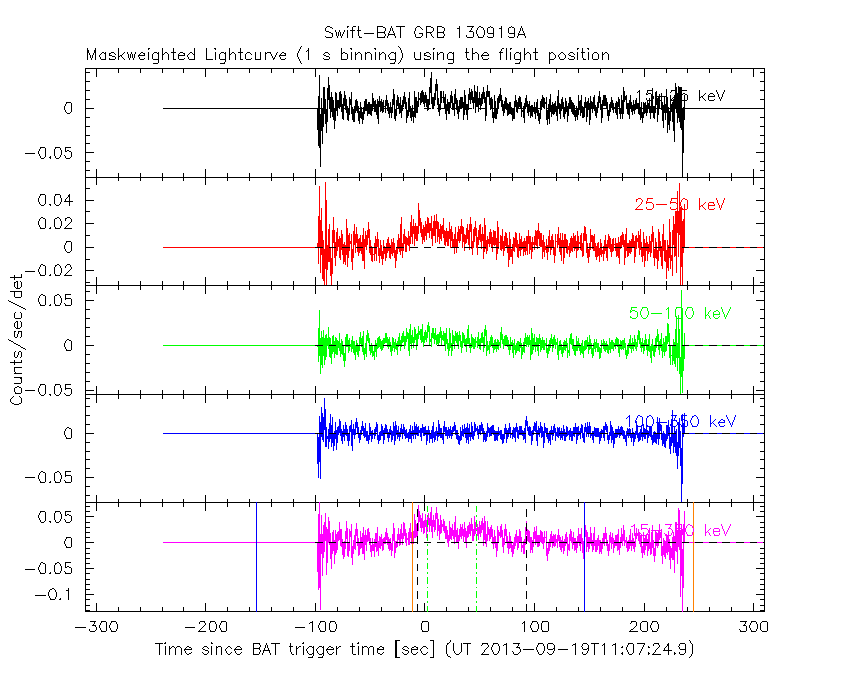
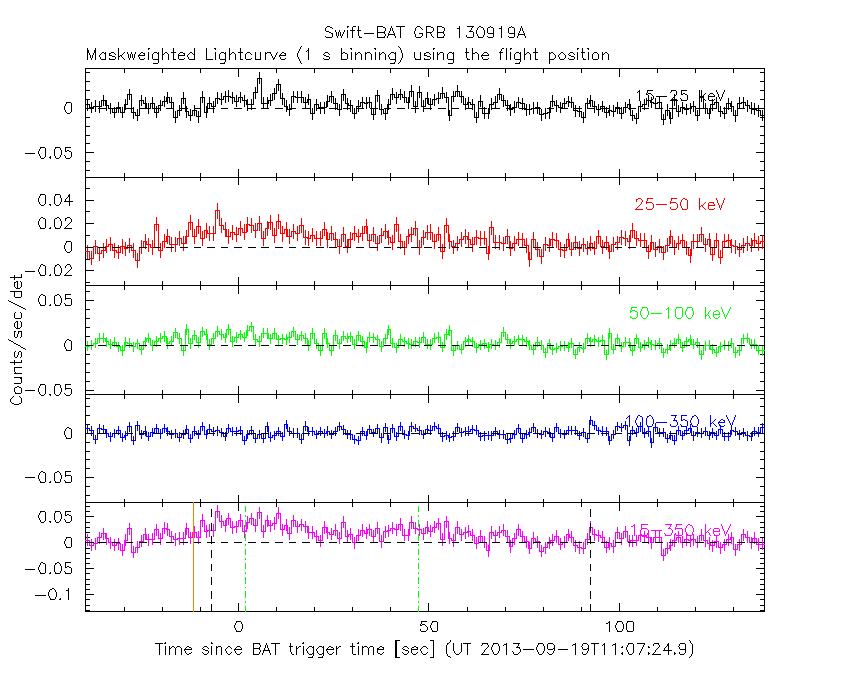
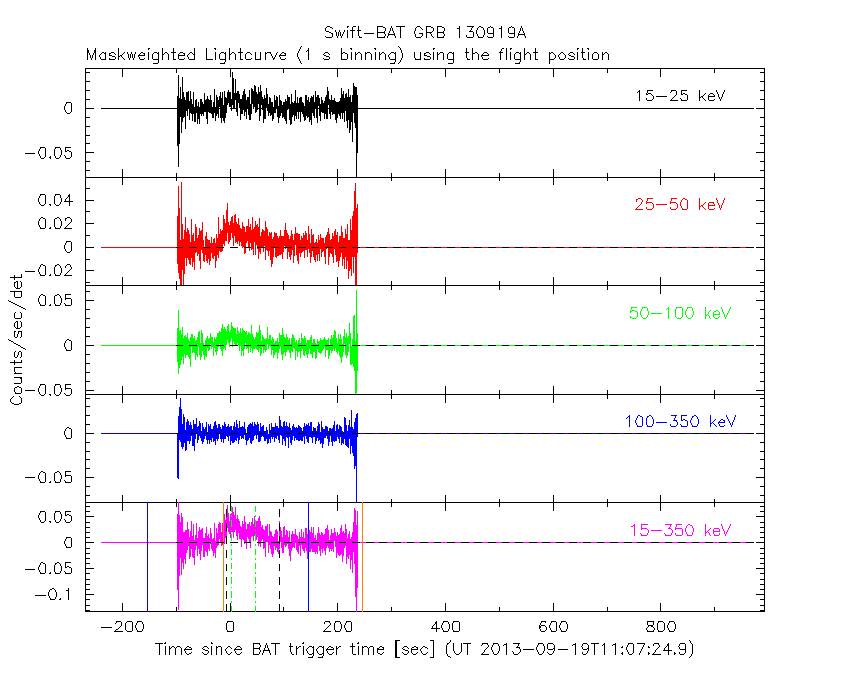
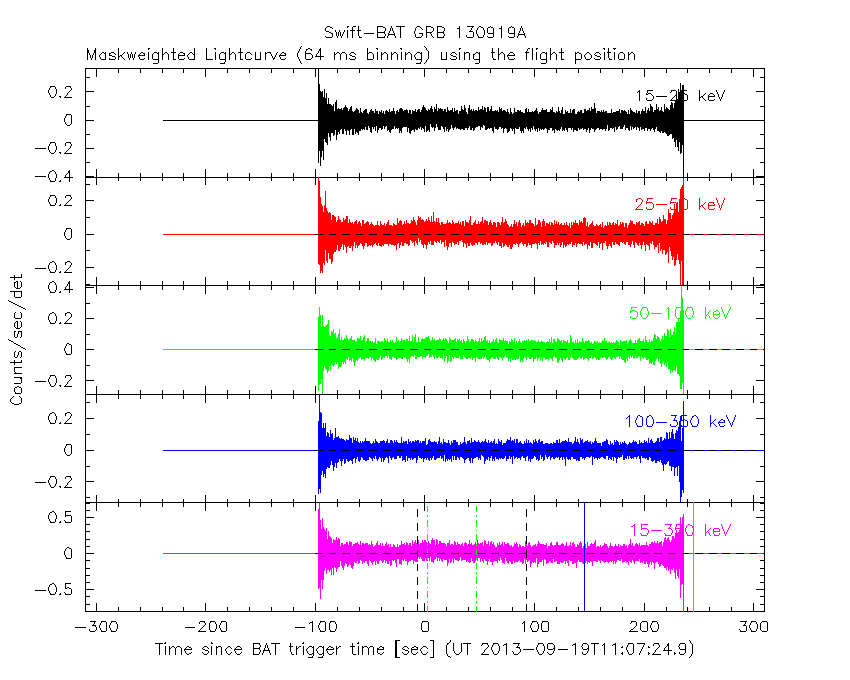
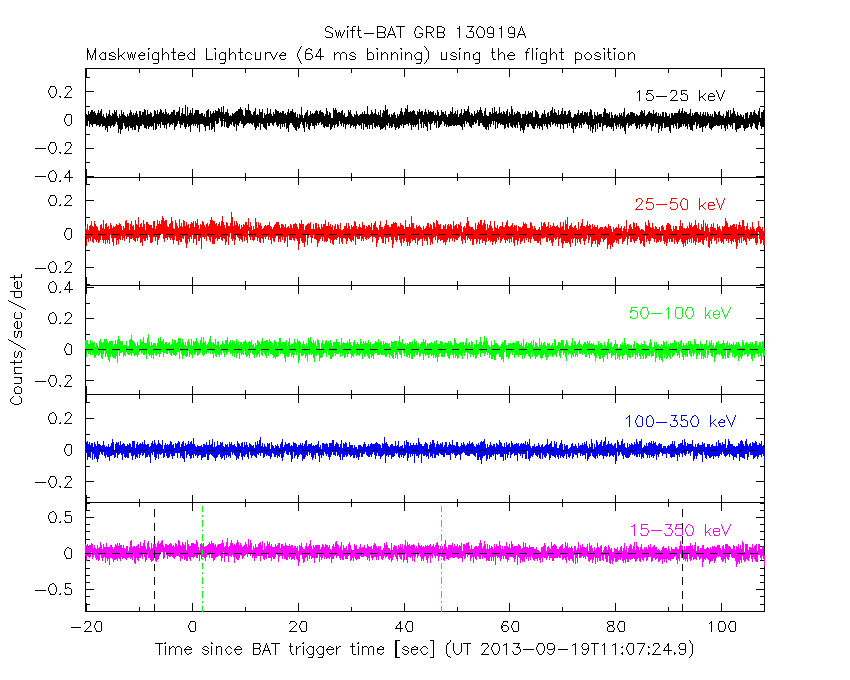
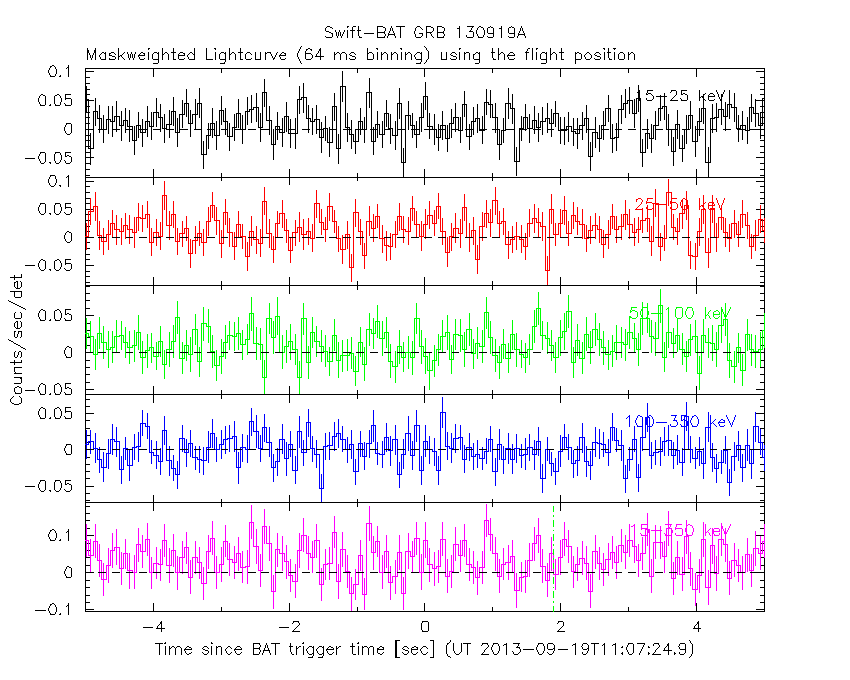
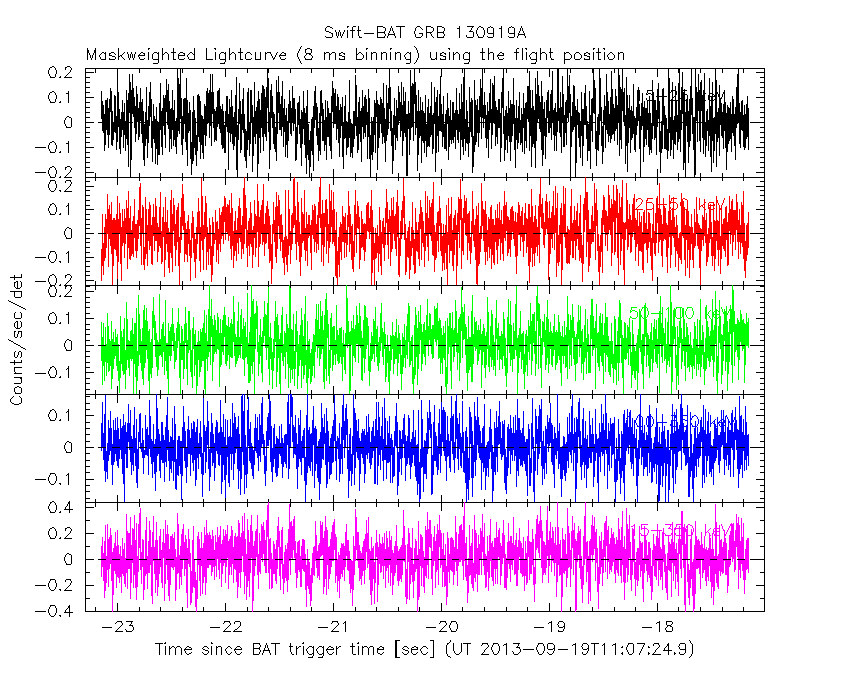
Lightcurves
Notes:
- 1) The mask-weighted light curves are using the flight position.
- 2) Multiple plots of different time binning/intervals are shown to cover all scenarios of short/long GRBs, rate/image triggers, and real/false positives.
- 3) For all the mask-weighted lightcurves, the y-axis units are counts/sec/det where a det is 0.4 x 0.4 = 0.16 sq cm.
- 4) The verticle lines correspond to following: green dotted lines are T50 interval, black dotted lines are T90 interval, blue solid line(s) is a spacecraft slew start time, and orange solid line(s) is a spacecraft slew end time.
- 5) Time of each bin is in the middle of the bin.
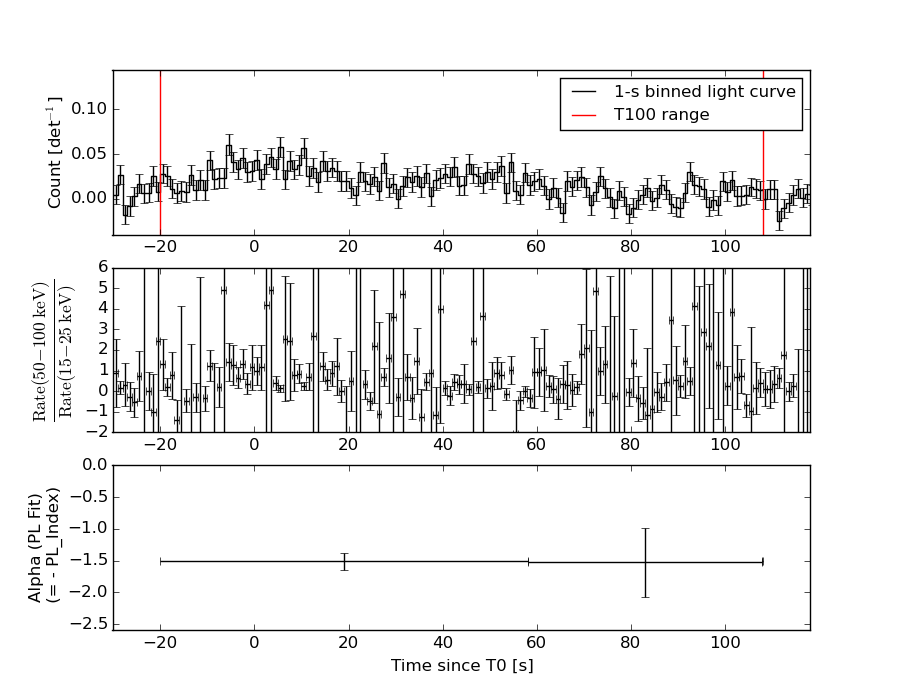
1 s binning
From T0-310 s to T0+310 s
From T100_start - 20 s to T100_end + 30 s
Full time interval
64 ms binning
Full time interval
From T100_start to T100_end
From T0-5 sec to T0+5 sec
16 ms binning
From T100_start-5 s to T100_start+5 s

Blue+Cyan dotted lines: Time interval of the scaled map
From 0.000000 to 64.000000
8 ms binning
From T100_start-3 s to T100_start+3 s
Blue+Cyan dotted lines: Time interval of the scaled map
From 0.000000 to 64.000000
2 ms binning
From T100_start-1 s to T100_start+1 s
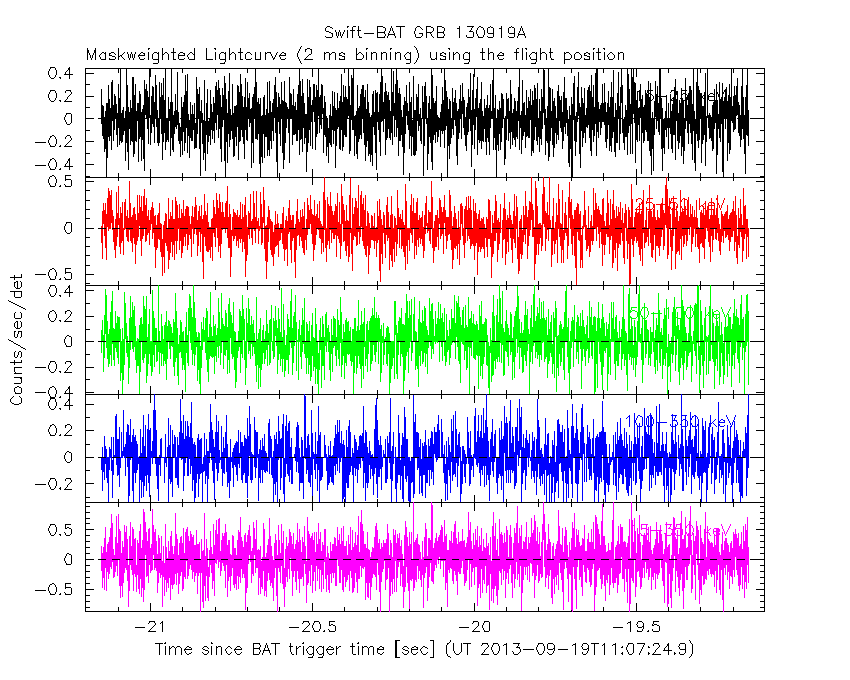
Blue+Cyan dotted lines: Time interval of the scaled map
From 0.000000 to 64.000000
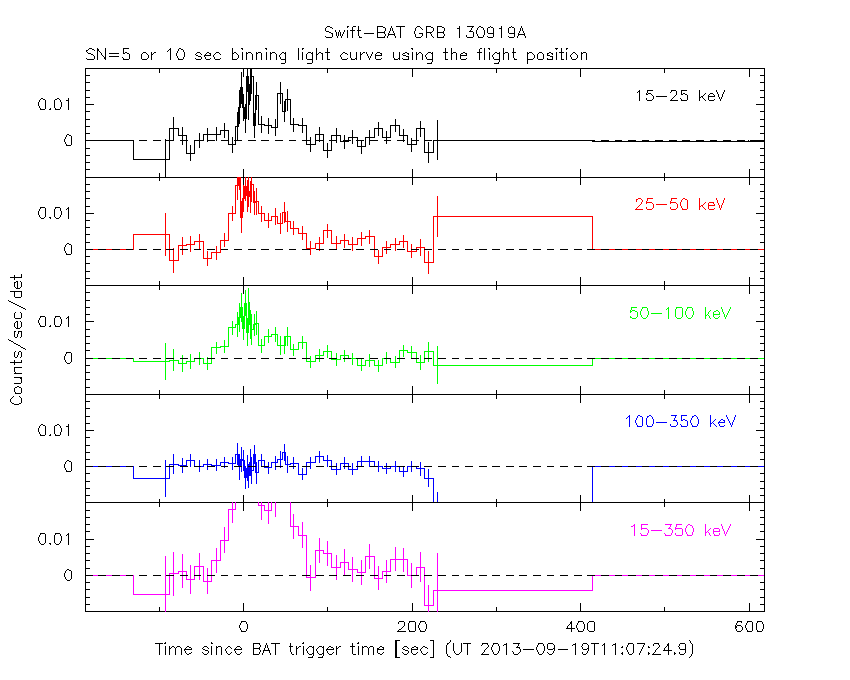
SN=5 or 10 sec. binning (whichever binning is satisfied first)
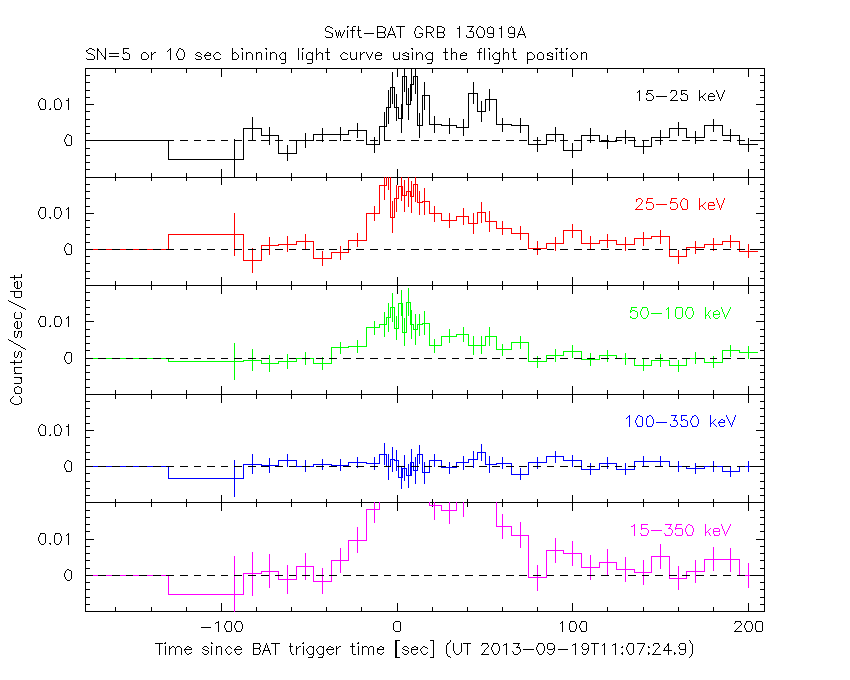
SN=5 or 10 sec. binning (T < 200 sec)
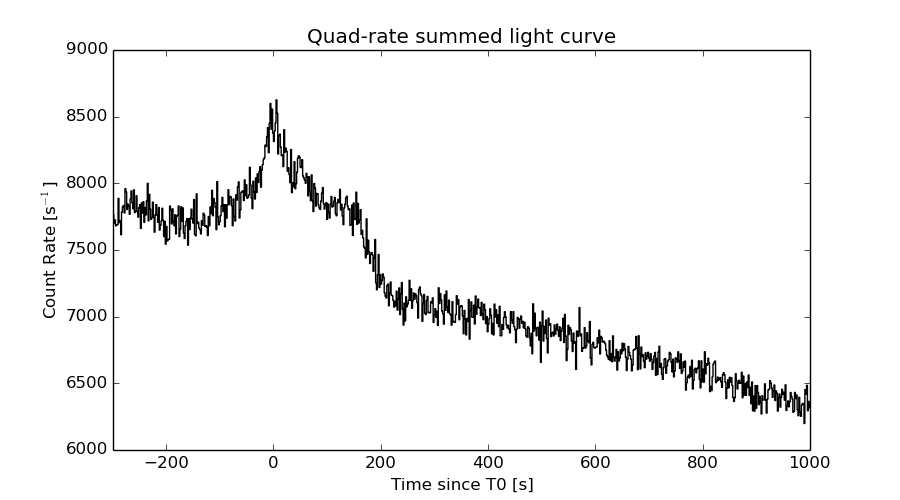
Quad-rate summed light curves (from T0-300s to T0+1000s)
Spectral Evolution
Spectra
Notes:
- 1) The fitting includes the systematic errors.
- 2) When the burst includes telescope slew time periods, the fitting uses an average response file made from multiple 5-s response files through out the slew time plus single time preiod for the non-slew times, and weighted by the total counts in the corresponding time period using addrmf. An average response file is needed becuase a spectral fit using the pre-slew DRM will introduce some errors in both a spectral shape and a normalization if the PHA file contains a lot of the slew/post-slew time interval.
- 3) For fits to more complicated models (e.g. a power-law over a cutoff power-law), the BAT team has decided to require a chi-square improvement of more than 6 for each extra dof.
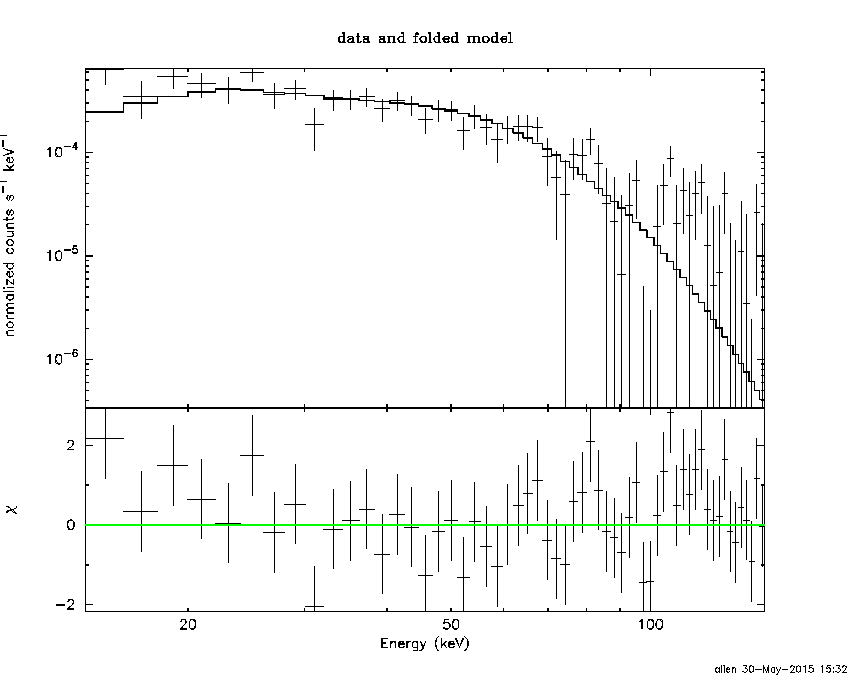
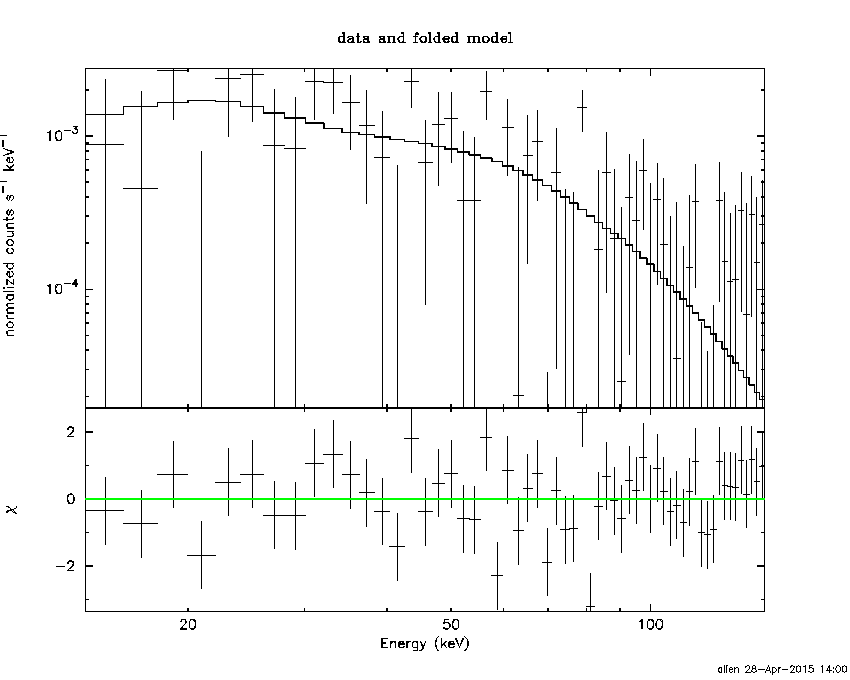
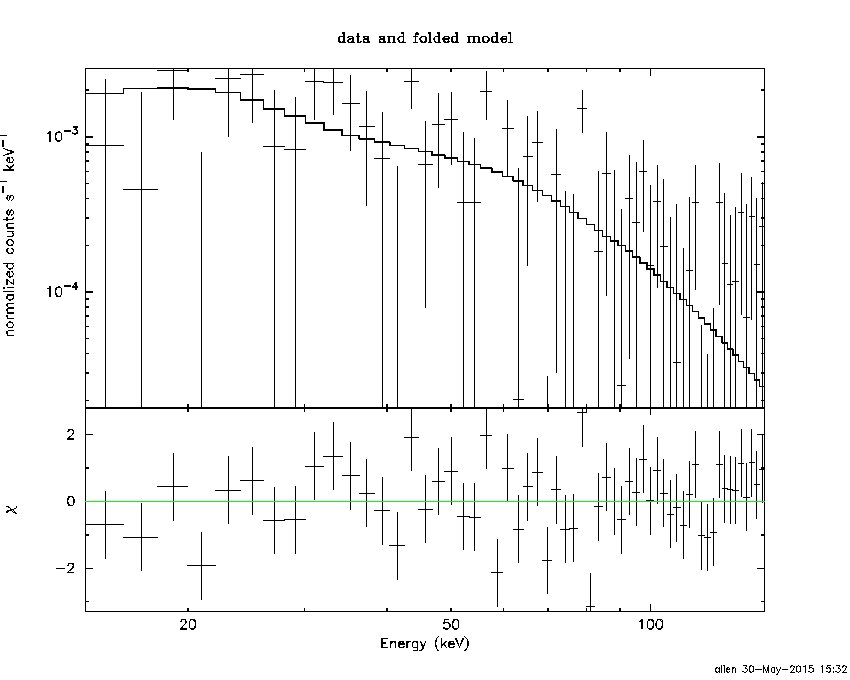
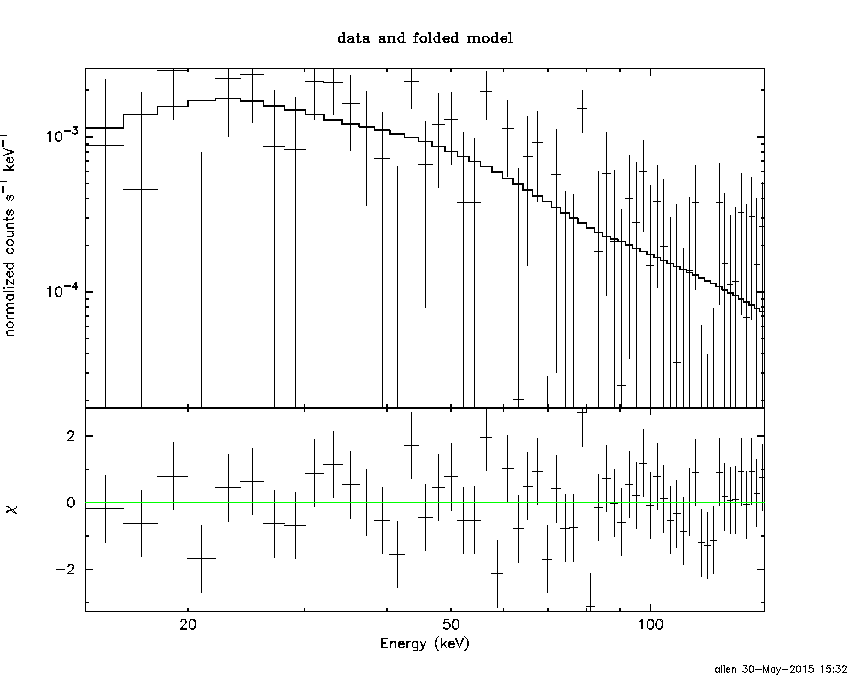
Time averaged spectrum fit using the average DRM
Power-law model
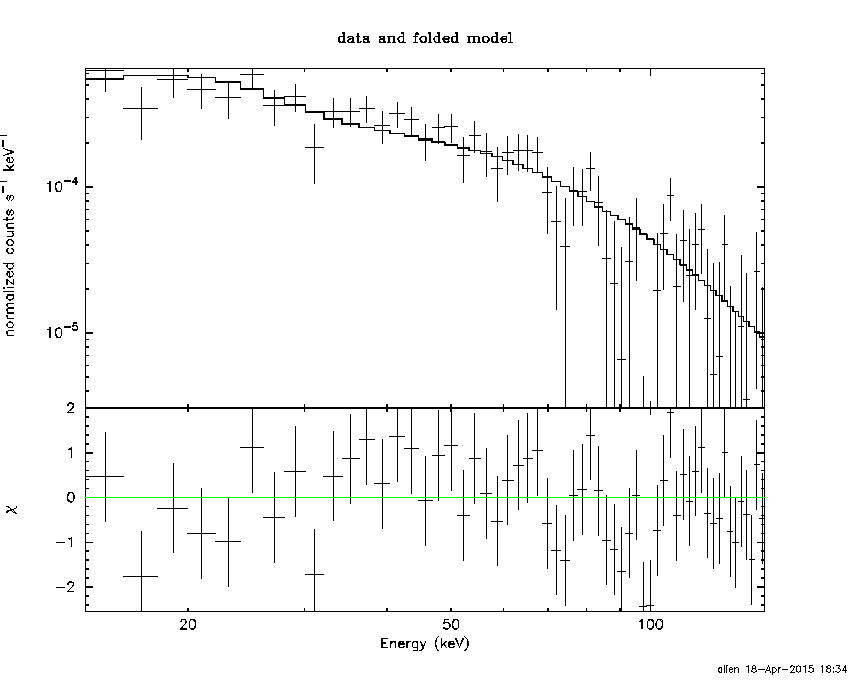
Time interval is from  -20.152 sec. to  108.068 sec.

Spectral model in power-law:
------------------------------------------------------------
Parameters  : value       lower 90%   higher 90%
Photon index: 1.51393     ( -0.137736   0.139084 )
Norm@50keV  : 1.24130E-03    ( -0.000102755   0.000102267 )
------------------------------------------------------------
#Fit statistic : Chi-Squared =          57.19 using 59 PHA bins.
# Reduced chi-squared =          1.003 for     57 degrees of freedom
# Null hypothesis probability =   4.680098e-01

Photon flux (15-150 keV)    in 128.2 sec: 0.155550 ( -0.0125772  0.0125928 ) ph/cm2/s
Energy fluence (15-150 keV)             : 1.50627e-06 ( -1.36207e-07  1.37666e-07 ) ergs/cm2
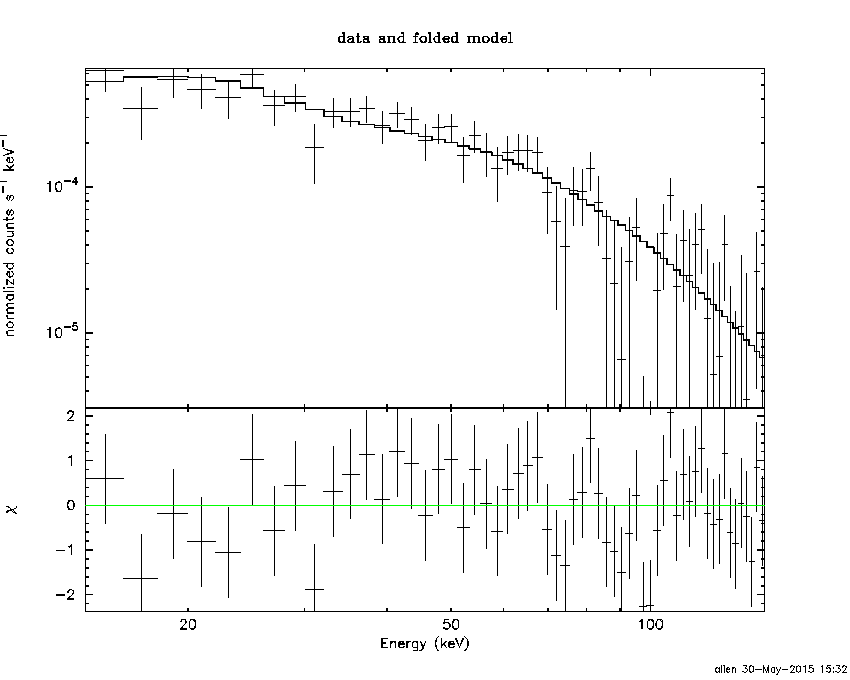
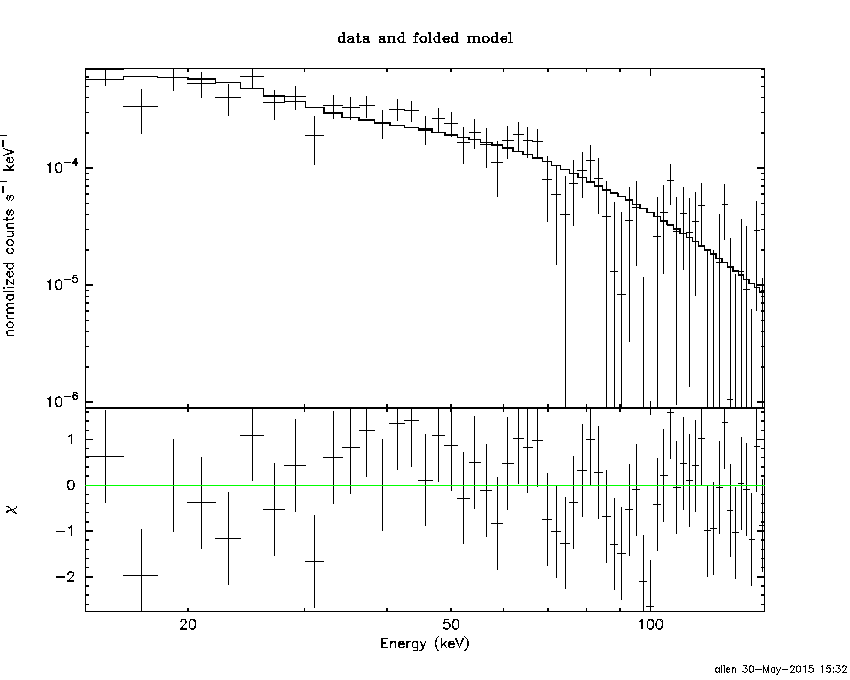
Cutoff power-law model
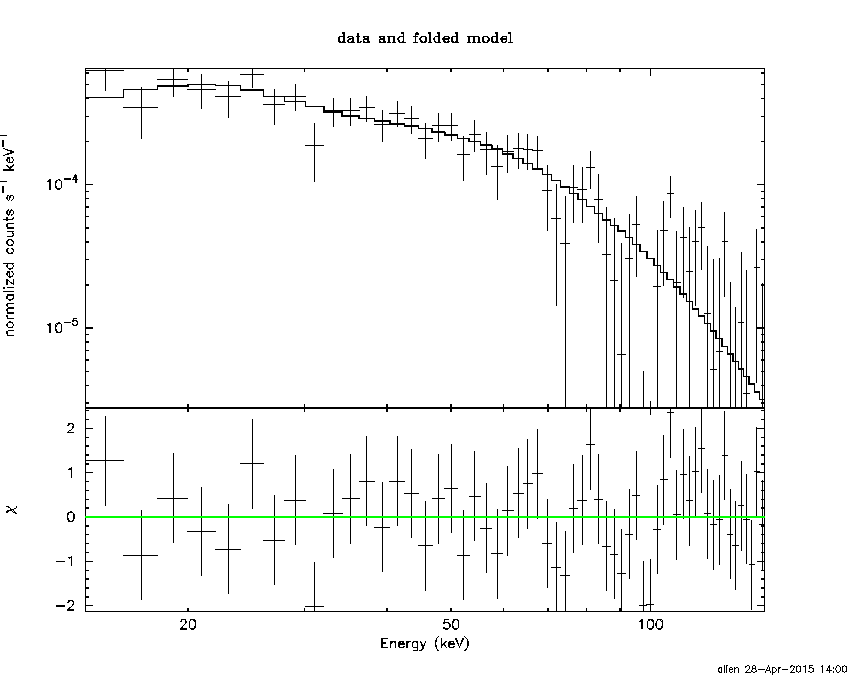
Time interval is from  -20.152 sec. to  108.068 sec.
Spectral model in the cutoff power-law:
------------------------------------------------------------
Parameters  : value       lower 90%   higher 90%
Photon index: 0.392275     ( -0.814046   0.681208 )
Epeak [keV] : 68.5429      ( -11.9474 34.3716 )
Norm@50keV  : 4.71598E-03    ( -0.00258556   0.00754538 )
------------------------------------------------------------
#Fit statistic : Chi-Squared =          48.52 using 59 PHA bins.
# Reduced chi-squared =         0.8664 for     56 degrees of freedom
# Null hypothesis probability =   7.509824e-01

Photon flux (15-150 keV)    in 128.2 sec: 0.147104 ( -0.013546  0.013527 ) ph/cm2/s
Energy fluence (15-150 keV)             : 1.36278e-06 ( -1.54726e-07  1.59981e-07 ) ergs/cm2
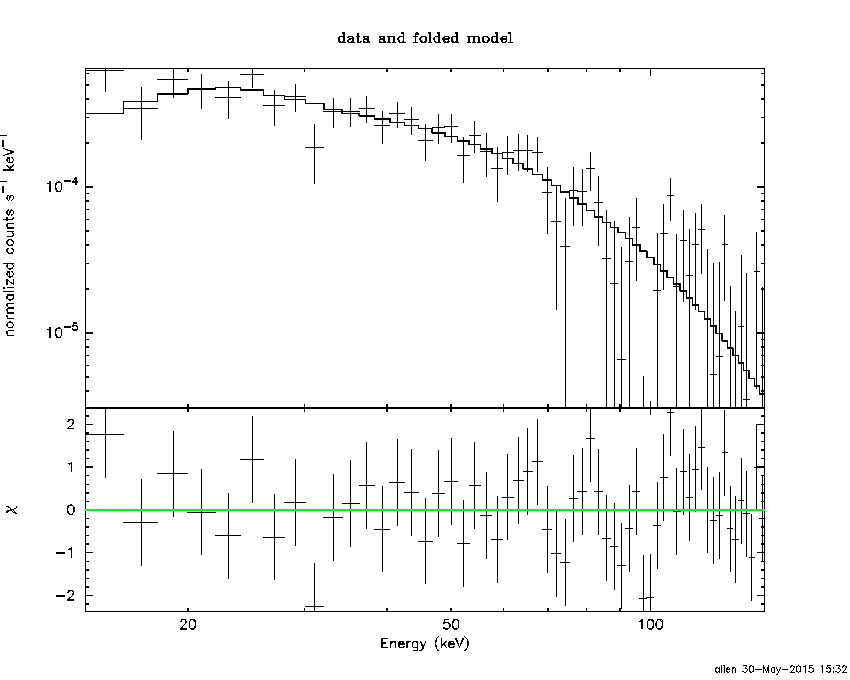
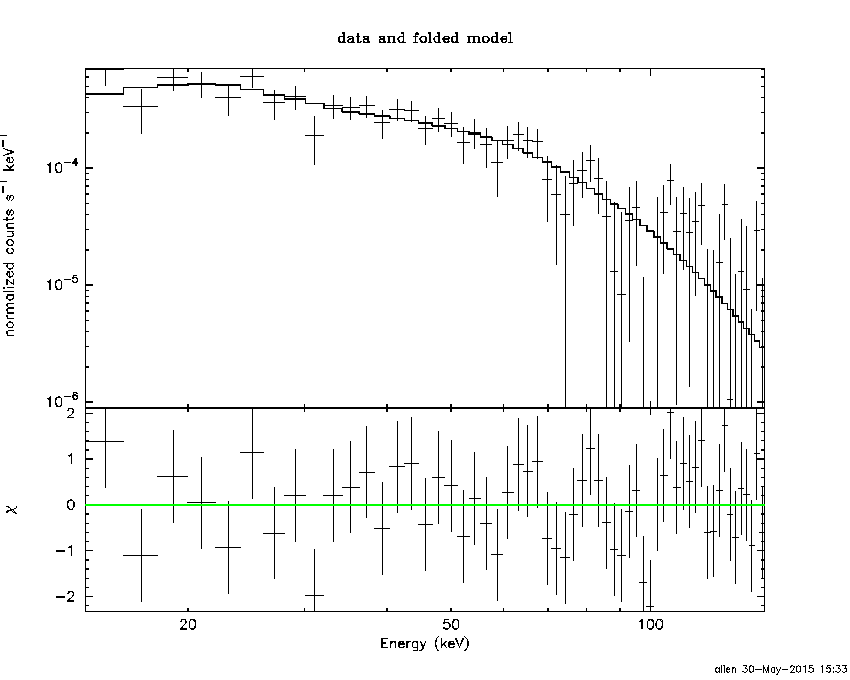
Band function
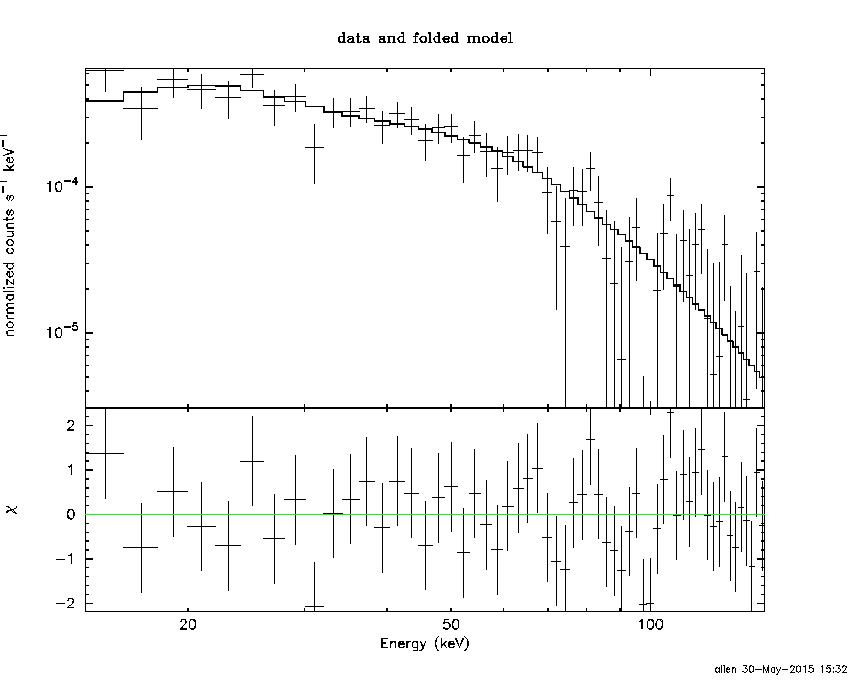
Time interval is from  -20.152 sec. to  108.068 sec.

Spectral model in the Band function:
------------------------------------------------------------
Parameters  : value       lower 90%   higher 90%
alpha       : -0.175846   ( -0.821648   1.60543 )
beta        : -2.34786    ( 2.34441   0.617232 )
Epeak [keV] : 62.6741      ( -19.3429 30.7598 )
Norm@50keV   : 6.31178E-03    ( -0.00377716   0.0571575 )
------------------------------------------------------------
#Fit statistic : Chi-Squared =          47.87 using 59 PHA bins.
# Reduced chi-squared =         0.8704 for     55 degrees of freedom
# Null hypothesis probability =   7.412826e-01

Photon flux (15-150 keV)    in 128.2 sec:  (    ) ph/cm2/s
Energy fluence (15-150 keV)             : 0 ( 0  0 ) ergs/cm2
Single BB
Spectral model blackbody:
------------------------------------------------------------
Parameters  : value    Lower 90%  Upper 90%
kT [keV]    : 14.1334  (-1.21277  1.35848)
R^2/D10^2   : 2.20446E-02  (-0.00616598   0.00833591)
(R is the radius in km and D10 is the distance to the source in units of 10 kpc)
------------------------------------------------------------
#Fit statistic : Chi-Squared =          60.12 using 59 PHA bins.
# Reduced chi-squared =          1.055 for     57 degrees of freedom
# Null hypothesis probability =   3.633675e-01

Energy  Fluence     90% Error
[keV]   [erg/cm2]   [erg/cm2]
15- 25  1.191e-07   1.635e-08
25- 50  4.473e-07   4.423e-08
50-150  5.911e-07   9.250e-08
15-150  1.158e-06   1.255e-07
Thermal bremsstrahlung (OTTB)
Spectral model: thermal bremsstrahlung
------------------------------------------------------------
Parameters  : value         Lower 90%    Upper 90%
kT [keV]    : 199.321       (-66.9077      -199.346)
Norm        : 0.636883       (-0.0503705     0.050429)
------------------------------------------------------------
#Fit statistic : Chi-Squared =          53.06 using 59 PHA bins.
# Reduced chi-squared =         0.9310 for     57 degrees of freedom
# Null hypothesis probability =   6.234433e-01

Energy  Fluence     90% Error
[keV]   [erg/cm2]   [erg/cm2]
15- 25  2.033e-07   2.167e-08
25- 50  3.911e-07   1.010e-07
50-150  8.577e-07   2.918e-07
15-150  1.452e-06   5.596e-07
Double BB
Spectral model: bbodyrad<1> + bbodyrad<2>
------------------------------------------------------------
Parameters  : value         Lower 90%    Upper 90%
kT1 [keV]   : 9.39273        (-7.05664      -9.46295)
R1^2/D10^2  : 5.77407E-02        (-0.0311057      11.1853)
kT2 [keV]   : 24.9635        (-23.4126      -25.8299)
R2^2/D10^2  : 1.78542E-03    (-0.0014779   0.017067)
------------------------------------------------------------
#Fit statistic : Chi-Squared =          49.88 using 59 PHA bins.
# Reduced chi-squared =         0.9070 for     55 degrees of freedom
# Null hypothesis probability =   6.698828e-01

Energy  Fluence     90% Error
[keV]   [erg/cm2]   [erg/cm2]
15- 25  1.546e-07   7.763e-08
25- 50  4.351e-07   1.844e-07
50-150  7.776e-07   4.081e-07
15-150  1.367e-06   6.398e-07
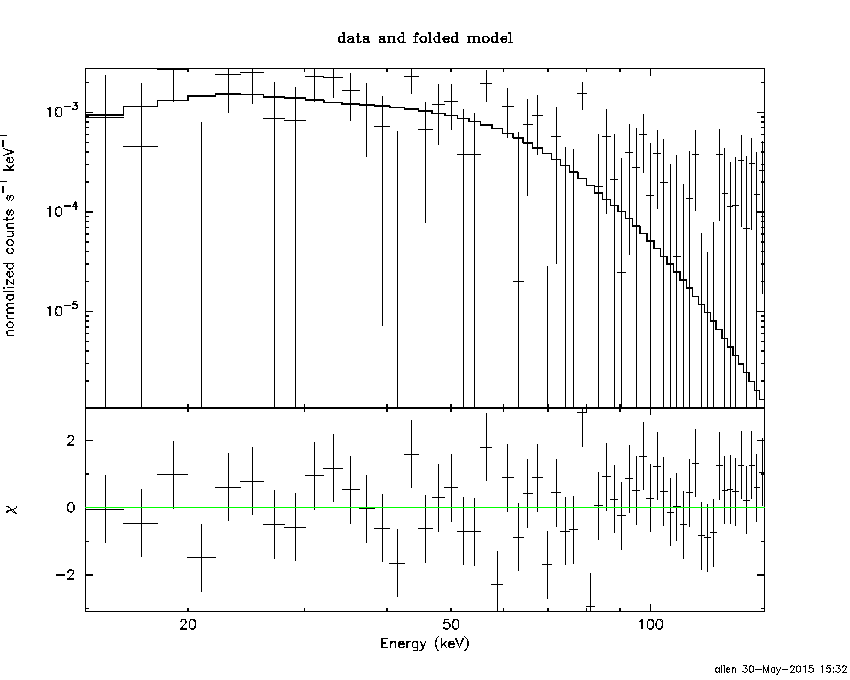
Peak spectrum fit
Power-law model
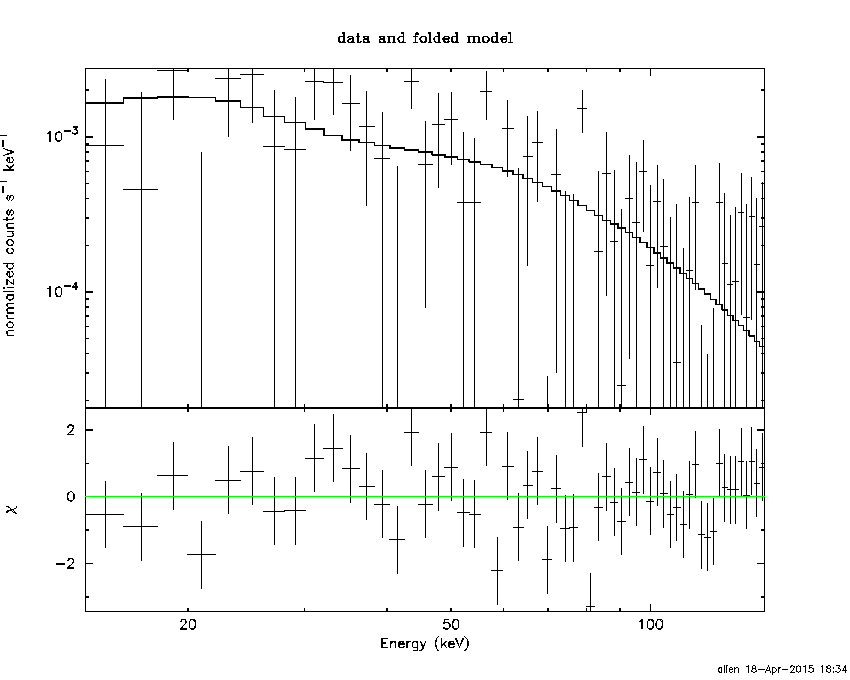
Time interval is from   -6.344 sec. to   -5.344 sec.

Spectral model in power-law:
------------------------------------------------------------
Parameters  : value       lower 90%   higher 90%
Photon index: 1.31320     ( -0.438344   0.422148 )
Norm@50keV  : 4.66254E-03    ( -0.00116195   0.0011587 )
------------------------------------------------------------
#Fit statistic : Chi-Squared =          63.83 using 59 PHA bins.
# Reduced chi-squared =          1.120 for     57 degrees of freedom
# Null hypothesis probability =   2.490832e-01

Photon flux (15-150 keV)    in 1 sec: 0.557630 ( -0.140694  0.141255 ) ph/cm2/s
Energy fluence (15-150 keV)             : 4.59275e-08 ( -1.25517e-08  1.28909e-08 ) ergs/cm2
Cutoff power-law model
Time interval is from   -6.344 sec. to   -5.344 sec.
Spectral model in the cutoff power-law:
------------------------------------------------------------
Parameters  : value       lower 90%   higher 90%
Photon index: 0.501725     ( -4.62802   0.975718 )
Epeak [keV] : 85.2104      (   )
Norm@50keV  : 1.27837E-02    (     )
------------------------------------------------------------
#Fit statistic : Chi-Squared =          63.44 using 59 PHA bins.
# Reduced chi-squared =          1.133 for     56 degrees of freedom
# Null hypothesis probability =   2.307824e-01

Photon flux (15-150 keV)    in 1 sec: 0.539028 ( -0.157688  0.149959 ) ph/cm2/s
Energy fluence (15-150 keV)             : 4.1867e-08 ( -1.70135e-08  1.59964e-08 ) ergs/cm2
Band function
Time interval is from   -6.344 sec. to   -5.344 sec.

Spectral model in the Band function:
------------------------------------------------------------
Parameters  : value       lower 90%   higher 90%
alpha       : 5.00000   ( -5   -5 )
beta        : -1.86708    ( -1.58467   0.685177 )
Epeak [keV] : 36.9831      ( -36.9831 11.262 )
Norm@50keV   : 46.6017    ( -11.1721   1.52655e+06 )
------------------------------------------------------------
#Fit statistic : Chi-Squared =          61.32 using 59 PHA bins.
# Reduced chi-squared =          1.115 for     55 degrees of freedom
# Null hypothesis probability =   2.597946e-01

Photon flux (15-150 keV)    in 1 sec:  (    ) ph/cm2/s
Energy fluence (15-150 keV)             : 0 ( 0  0 ) ergs/cm2
Single BB
Spectral model blackbody:
------------------------------------------------------------
Parameters  : value    Lower 90%  Upper 90%
kT [keV]    : 13.8361  (-3.37138  5.41909)
R^2/D10^2   : 8.76152E-02  (-0.0601043   0.148596)
(R is the radius in km and D10 is the distance to the source in units of 10 kpc)
------------------------------------------------------------
#Fit statistic : Chi-Squared =          64.51 using 59 PHA bins.
# Reduced chi-squared =          1.132 for     57 degrees of freedom
# Null hypothesis probability =   2.306387e-01

Energy  Fluence     90% Error
[keV]   [erg/cm2]   [erg/cm2]
15- 25  3.547e-09   1.832e-09
25- 50  1.304e-08   7.020e-09
50-150  1.633e-08   8.936e-09
15-150  3.292e-08   1.638e-08
Thermal bremsstrahlung (OTTB)
Spectral model: thermal bremsstrahlung
------------------------------------------------------------
Parameters  : value         Lower 90%    Upper 90%
kT [keV]    : 199.363       (-108.638      -199.363)
Norm        : 2.31144       (-0.574757     0.574757)
------------------------------------------------------------
#Fit statistic : Chi-Squared =          64.30 using 59 PHA bins.
# Reduced chi-squared =          1.128 for     57 degrees of freedom
# Null hypothesis probability =   2.363041e-01

Energy  Fluence     90% Error
[keV]   [erg/cm2]   [erg/cm2]
15- 25  5.756e-09   3.517e-09
25- 50  1.107e-08   6.655e-09
50-150  2.428e-08   1.442e-08
15-150  4.111e-08   2.471e-08
Double BB
Spectral model: bbodyrad<1> + bbodyrad<2>
------------------------------------------------------------
Parameters  : value         Lower 90%    Upper 90%
kT1 [keV]   : 10.9735        (-2.50788      4.07504)
R1^2/D10^2  : 0.168915        (-0.110826      0.153506)
kT2 [keV]   : 197.224        (-197.718      -197.718)
R2^2/D10^2  : 7.71664E-05    (-5.12862e-05   0.00993667)
------------------------------------------------------------
#Fit statistic : Chi-Squared =          60.22 using 59 PHA bins.
# Reduced chi-squared =          1.095 for     55 degrees of freedom
# Null hypothesis probability =   2.926440e-01

Energy  Fluence     90% Error
[keV]   [erg/cm2]   [erg/cm2]
15- 25  4.346e-09   2.708e-09
25- 50  1.280e-08   7.985e-09
50-150  2.827e-08   8.020e-09
15-150  4.542e-08   1.869e-08
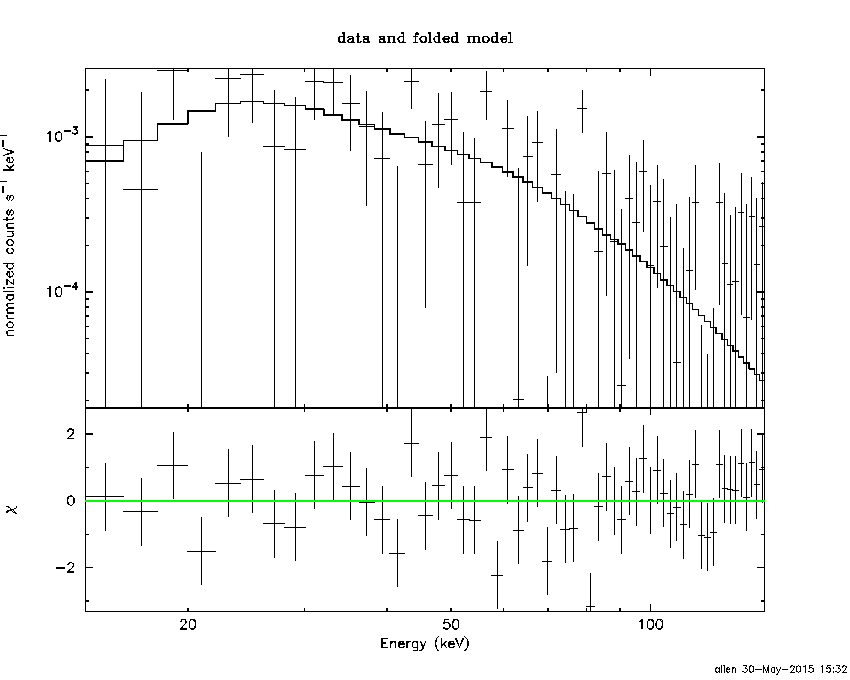
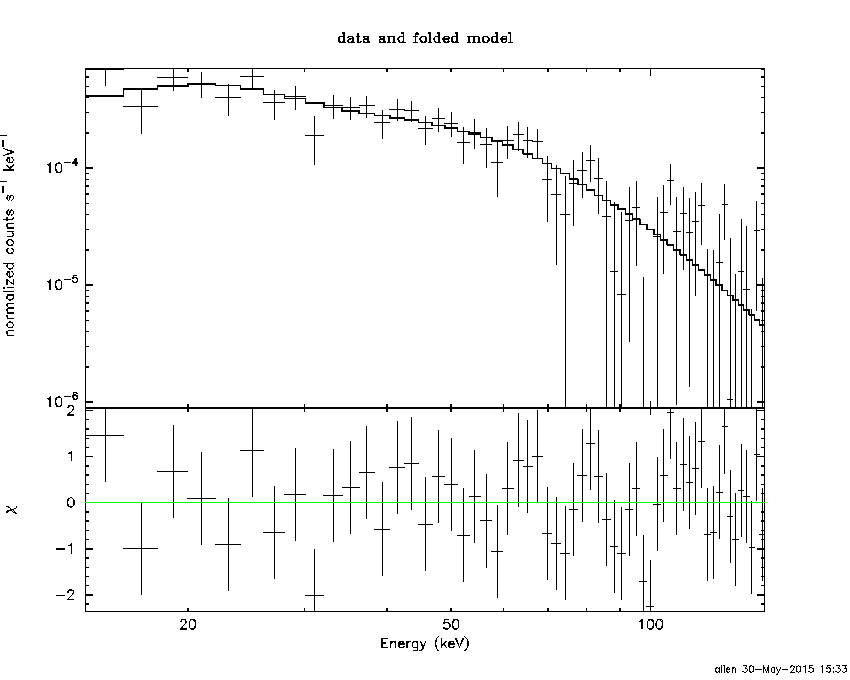
Pre-slew spectrum (Pre-slew PHA with pre-slew DRM)
Power-law model
Spectral model in power-law:
------------------------------------------------------------
Parameters  : value       lower 90%   higher 90%
Photon index: 1.56423     ( -0.14351   0.145545 )
Norm@50keV  : 1.22932E-03    ( -0.000107073   0.000106361 )
------------------------------------------------------------
#Fit statistic : Chi-Squared =          55.25 using 59 PHA bins.
# Reduced chi-squared =         0.9693 for     57 degrees of freedom
# Null hypothesis probability =   5.409385e-01

Photon flux (15-150 keV)    in 119.8 sec: 0.156274 ( -0.0130585  0.0130742 ) ph/cm2/s
Energy fluence (15-150 keV)             : 1.38369e-06 ( -1.30483e-07  1.32039e-07 ) ergs/cm2
Cutoff power-law model
Spectral model in the cutoff power-law:
------------------------------------------------------------
Parameters  : value       lower 90%   higher 90%
Photon index: 0.473228     ( -0.847742   0.704765 )
Epeak [keV] : 65.8654      ( -11.7338 36.7052 )
Norm@50keV  : 4.57983E-03    ( -0.0025902   0.00799954 )
------------------------------------------------------------
#Fit statistic : Chi-Squared =          47.68 using 59 PHA bins.
# Reduced chi-squared =         0.8515 for     56 degrees of freedom
# Null hypothesis probability =   7.777755e-01

Photon flux (15-150 keV)    in 119.8 sec: 0.148047 ( -0.014073  0.014057 ) ph/cm2/s
Energy fluence (15-150 keV)             : 1.25199e-06 ( -1.48056e-07  1.53979e-07 ) ergs/cm2
Band function
Spectral model in the Band function:
------------------------------------------------------------
Parameters  : value       lower 90%   higher 90%
alpha       : -0.264581   ( -0.838492   1.58901 )
beta        : -2.39412    ( 2.39504   0.643265 )
Epeak [keV] : 60.5255      ( -18.6098 33.9064 )
Norm@50keV   : 6.07829E-03    ( -0.00359488   0.0532291 )
------------------------------------------------------------
#Fit statistic : Chi-Squared =          47.13 using 59 PHA bins.
# Reduced chi-squared =         0.8569 for     55 degrees of freedom
# Null hypothesis probability =   7.657828e-01

Photon flux (15-150 keV)    in 119.8 sec:  (    ) ph/cm2/s
Energy fluence (15-150 keV)             : 1.26724e-06 ( -1.26641e-06  -7.56082e-08 ) ergs/cm2
S(25-50 keV) vs. S(50-100 keV) plot
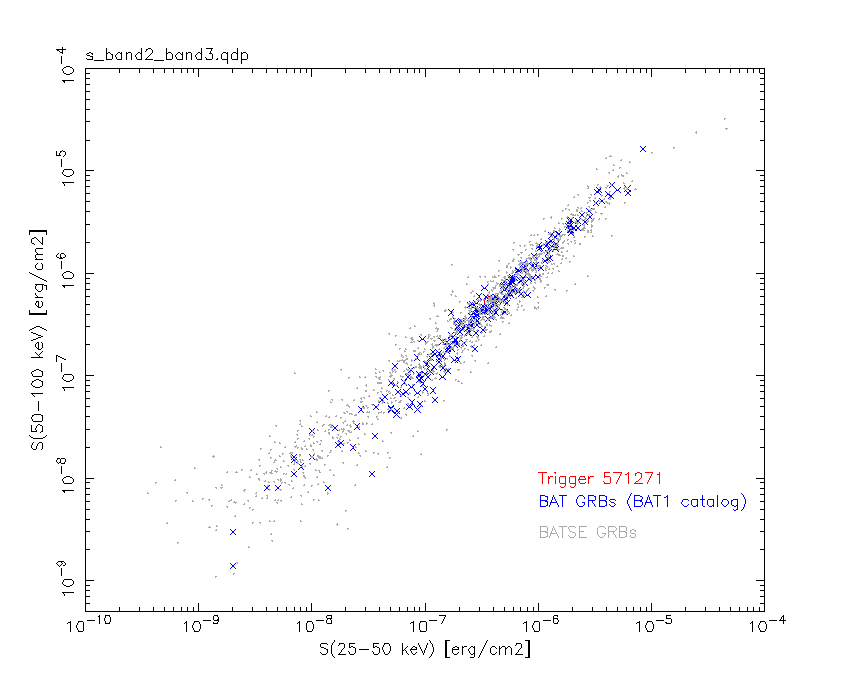
S(25-50 keV)  = 3.75e-07
S(50-100 keV) = 5.25e-07
T90 vs. Hardness ratio plot
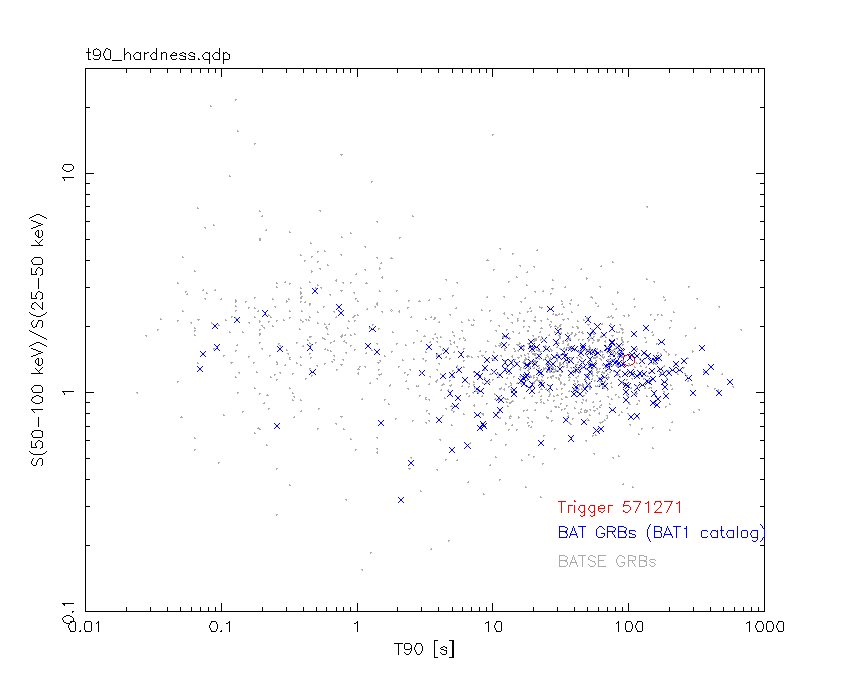
T90                                   = 99.6839999556541 sec.
Hardness ratio (energy fluence ratio) = 1.4
Color vs. Color plot
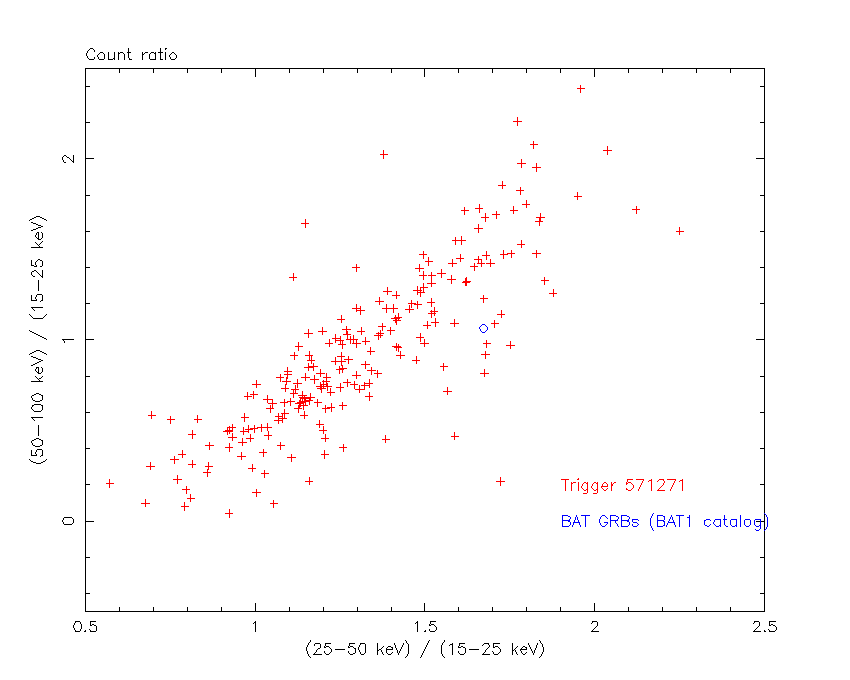
Count Ratio  (25-50 keV) / (15-25 keV) = 1.67226
Count Ratio (50-100 keV) / (15-25 keV) = 1.06376
Mask shadow pattern
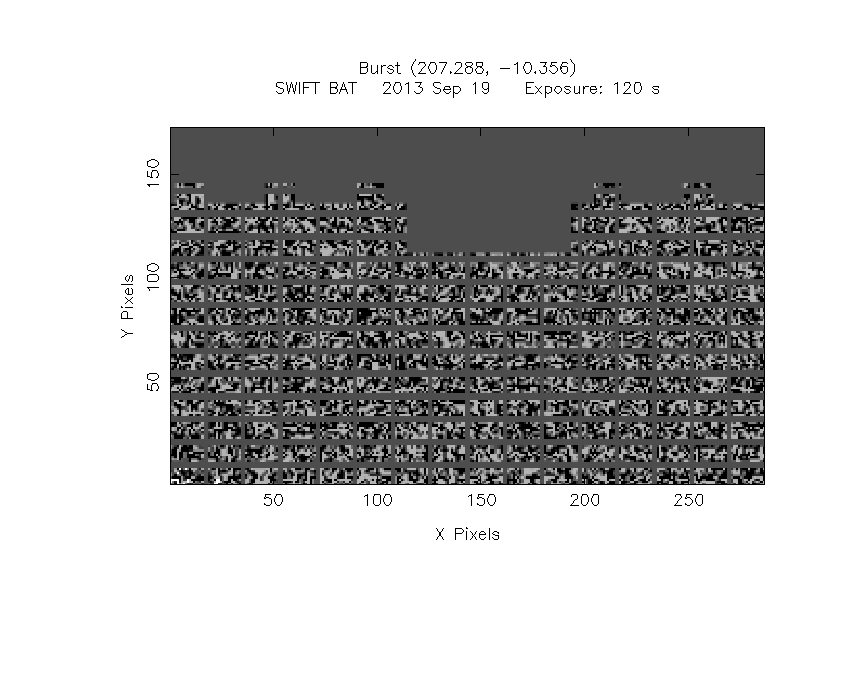
IMX = -4.516322321979809E-02, IMY = 3.389476216050898E-01
TIME vs. PHA plot around the trigger time
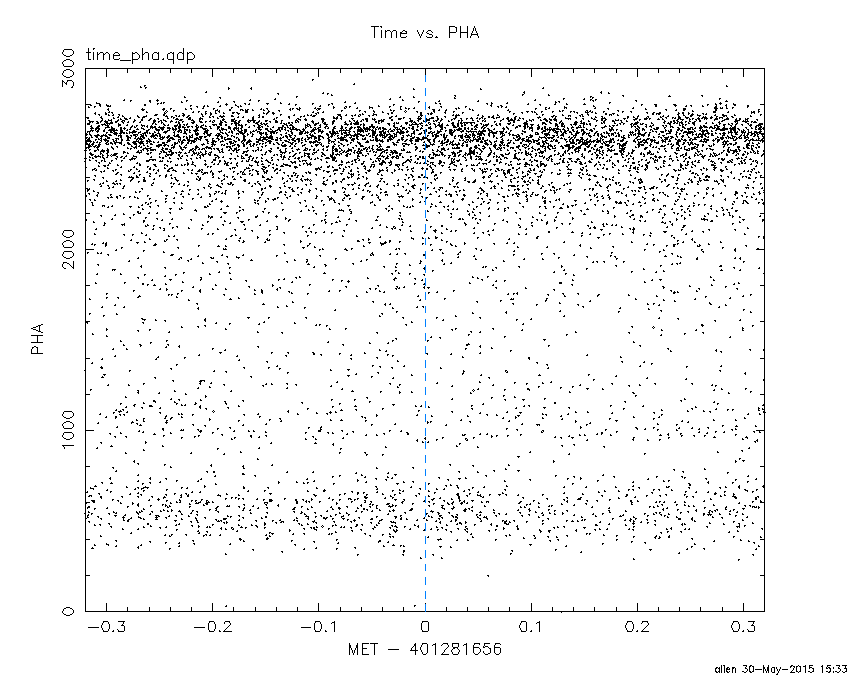
Blue+Cyan dotted lines: Time interval of the scaled map
From 0.000000 to 64.000000
TIME vs. DetID plot around the trigger time
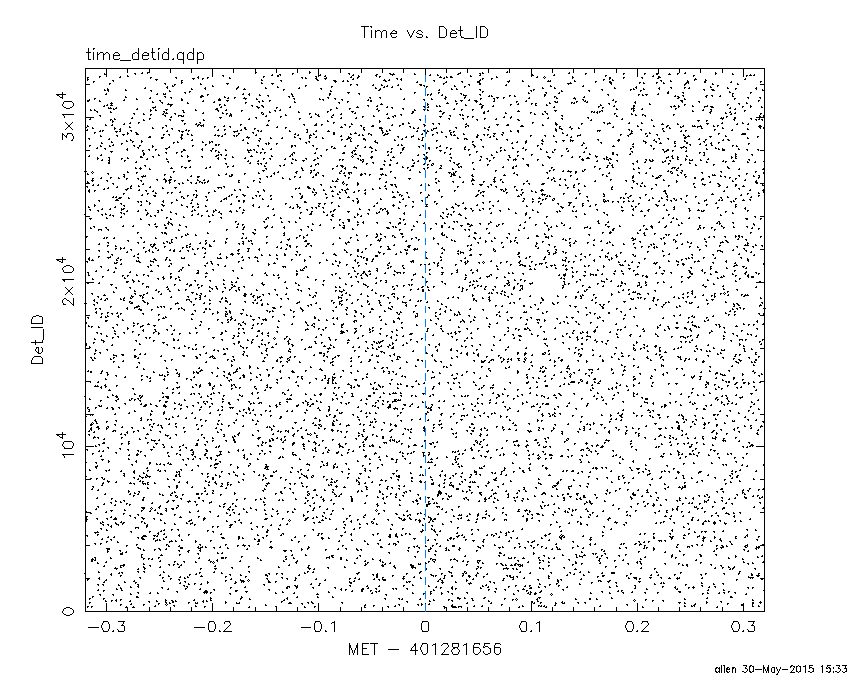
Blue+Cyan dotted lines: Time interval of the scaled map
From 0.000000 to 64.000000
100 us light curve (15-350 keV)
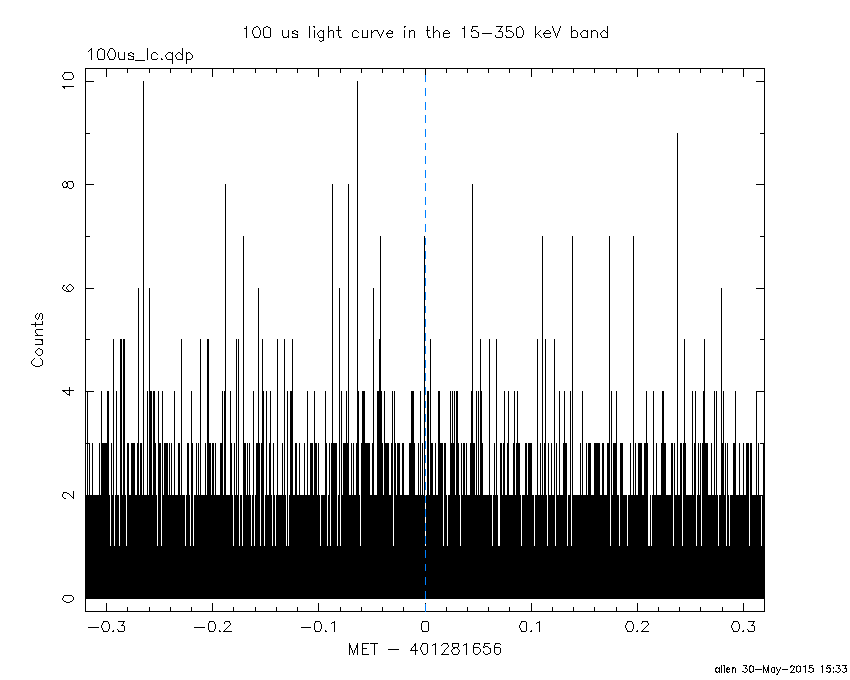
Blue+Cyan dotted lines: Time interval of the scaled map
From 0.000000 to 64.000000
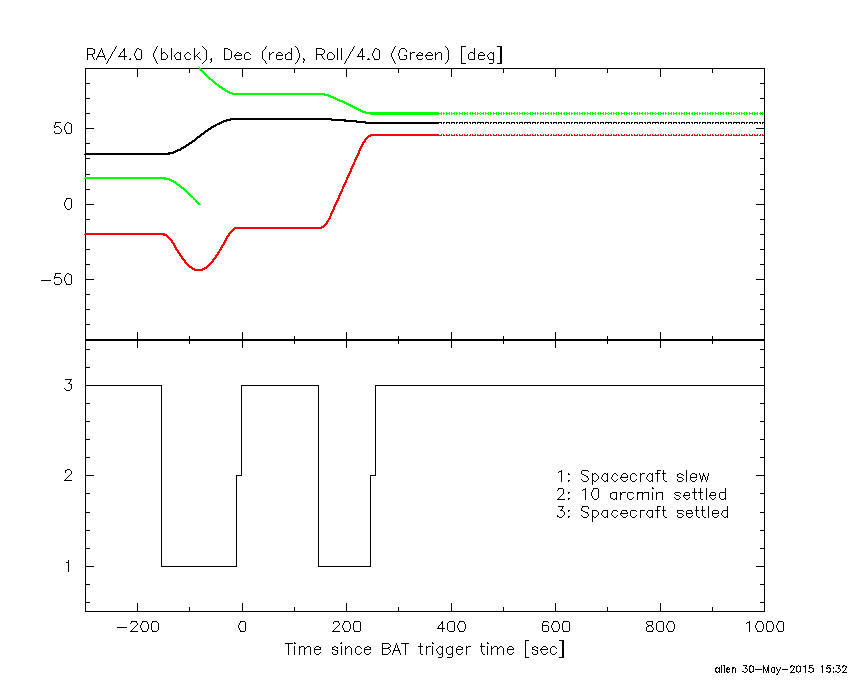
Spacecraft aspect plot
Bright source in the pre-burst/pre-slew/post-slew images
Pre-burst image of 15-350 keV band
Time interval of the image:
Pre-slew background subtracted image of 15-350 keV band
Time interval of the image:
-11.699410 108.068000

# RAcent  DECcent POSerr Theta    Phi  PeakCts   SNR AngSep     Name
#  [deg]    [deg]    ['] [deg]  [deg]                   [']
186.5758 -62.6874    9.4  54.4  179.3   0.6001   1.2    5.4	GX 301-2
245.0115 -15.6393    0.4  18.4   71.0   4.1755  29.4    1.9	Sco X-1
255.9531 -37.9712    7.4  34.6  114.4   0.4501   1.6    7.8	4U 1700-377
256.4014 -36.3115   23.2  34.1  111.5  -0.1453  -0.5    6.9	GX 349+2
262.8265 -24.8437    0.0  35.7   89.4   0.5910   1.6   11.6	GX 1+4
262.9191 -33.9532    8.0  38.0  104.1  -0.5720  -1.4    7.9	GX 354-0
207.2806 -10.3542    0.7  18.9  -97.6   2.2522  16.1 ------	UNKNOWN
186.1468  -3.1626    4.6  41.0  -98.0   1.7536   2.5 ------	UNKNOWN
Post-slew image of 15-350 keV band
Time interval of the image:
245.500590 963.024700

# RAcent  DECcent POSerr Theta    Phi  PeakCts   SNR AngSep     Name
#  [deg]    [deg]    ['] [deg]  [deg]                   [']
254.5427  35.4163   38.8  30.8  125.3  -0.1917  -0.3    6.1	Her X-1
270.0039  64.6450    3.7  34.8   67.3   2.6769   3.2 ------	UNKNOWN
249.3149  81.7758    2.2  37.7   37.2   3.8239   5.4 ------	UNKNOWN
219.4395  59.2324    3.3  13.8   37.6   1.3775   3.5 ------	UNKNOWN
206.0229  34.1020    2.4  13.7 -113.8   2.0069   4.9 ------	UNKNOWN
152.3323  58.3089    2.3  39.4  -17.9   2.5641   5.0 ------	UNKNOWN
125.3286  47.2132    2.6  58.6  -22.9  13.1775   4.3 ------	UNKNOWN
147.4179  36.8007    3.6  50.6  -44.6   7.0849   3.2 ------	UNKNOWN
Plot creation:
Sat May 30 15:33:36 EDT 2015