Special notes of this burst
Image
Pre-slew 15.0-350.0 keV image (Event data)
#   RAcent    DECcent   POSerr    Theta     Phi              Peak Cts       SNR   Name
  135.0244   -47.5563   0.0128    42.5817     1.7264         1.2461214     14.978 TRIG_00572308

Foreground time interval of the image:
 -1.928  12.408 (delta_t =  14.336 [sec])
Background time interval of the image:
-119.224  -1.928 (delta_t = 117.296 [sec])
Lightcurves
Notes:
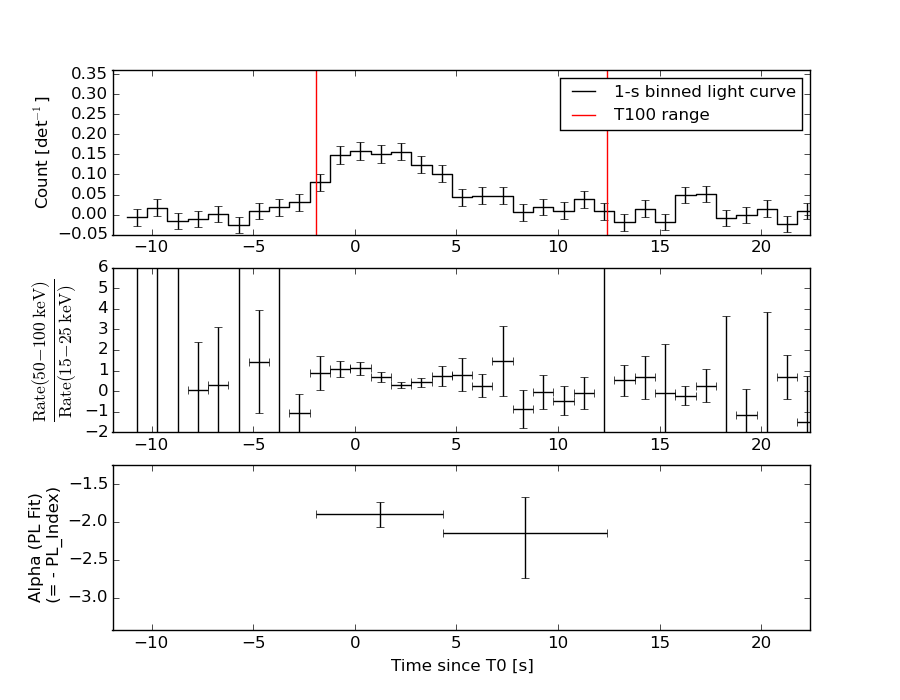
- 1) The mask-weighted light curves are using the flight position.
- 2) Multiple plots of different time binning/intervals are shown to cover all scenarios of short/long GRBs, rate/image triggers, and real/false positives.
- 3) For all the mask-weighted lightcurves, the y-axis units are counts/sec/det where a det is 0.4 x 0.4 = 0.16 sq cm.
- 4) The verticle lines correspond to following: green dotted lines are T50 interval, black dotted lines are T90 interval, blue solid line(s) is a spacecraft slew start time, and orange solid line(s) is a spacecraft slew end time.
- 5) Time of each bin is in the middle of the bin.
1 s binning
From T0-310 s to T0+310 s
From T100_start - 20 s to T100_end + 30 s
Full time interval
64 ms binning
Full time interval
From T100_start to T100_end
From T0-5 sec to T0+5 sec
16 ms binning
From T100_start-5 s to T100_start+5 s
Blue+Cyan dotted lines: Time interval of the scaled map
From 0.000000 to 1.024000
8 ms binning
From T100_start-3 s to T100_start+3 s
Blue+Cyan dotted lines: Time interval of the scaled map
From 0.000000 to 1.024000
2 ms binning
From T100_start-1 s to T100_start+1 s
Blue+Cyan dotted lines: Time interval of the scaled map
From 0.000000 to 1.024000
SN=5 or 10 sec. binning (whichever binning is satisfied first)
SN=5 or 10 sec. binning (T < 200 sec)
Quad-rate summed light curves (from T0-300s to T0+1000s)
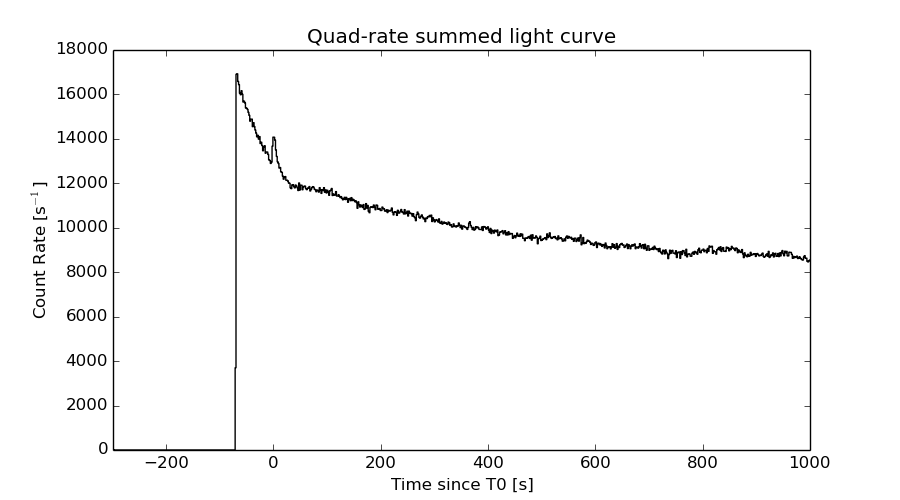
The mask-weighted light curves based on cleaned DPHs

Spectral Evolution
Spectra
Notes:
- 1) The fitting includes the systematic errors.
- 2) When the burst includes telescope slew time periods, the fitting uses an average response file made from multiple 5-s response files through out the slew time plus single time preiod for the non-slew times, and weighted by the total counts in the corresponding time period using addrmf. An average response file is needed becuase a spectral fit using the pre-slew DRM will introduce some errors in both a spectral shape and a normalization if the PHA file contains a lot of the slew/post-slew time interval.
- 3) For fits to more complicated models (e.g. a power-law over a cutoff power-law), the BAT team has decided to require a chi-square improvement of more than 6 for each extra dof.
Time averaged spectrum fit using the average DRM
Power-law model

Time interval is from   -1.928 sec. to   12.408 sec.

Spectral model in power-law:
------------------------------------------------------------
Parameters  : value       lower 90%   higher 90%
Photon index: 1.96460     ( -0.179694   0.190435 )
Norm@50keV  : 5.35846E-03    ( -0.000675567   0.000661932 )
------------------------------------------------------------
#Fit statistic : Chi-Squared =          51.64 using 59 PHA bins.
# Reduced chi-squared =         0.9059 for     57 degrees of freedom
# Null hypothesis probability =   6.758036e-01

Photon flux (15-150 keV)    in 14.34 sec: 0.790965 ( -0.0778136  0.0778268 ) ph/cm2/s
Energy fluence (15-150 keV)             : 7.0748e-07 ( -8.43284e-08  8.62627e-08 ) ergs/cm2
Cutoff power-law model

Time interval is from   -1.928 sec. to   12.408 sec.
Spectral model in the cutoff power-law:
------------------------------------------------------------
Parameters  : value       lower 90%   higher 90%
Photon index: 0.968183     ( -0.950276   0.778723 )
Epeak [keV] : 43.8469      ( -11.3306 17.9375 )
Norm@50keV  : 1.97702E-02    ( -0.0124905   0.0494406 )
------------------------------------------------------------
#Fit statistic : Chi-Squared =          46.63 using 59 PHA bins.
# Reduced chi-squared =         0.8327 for     56 degrees of freedom
# Null hypothesis probability =   8.095638e-01

Photon flux (15-150 keV)    in 14.34 sec: 0.761072 ( -0.080558  0.080768 ) ph/cm2/s
Energy fluence (15-150 keV)             : 6.47095e-07 ( -8.93296e-08  9.54442e-08 ) ergs/cm2
Band function

Time interval is from   -1.928 sec. to   12.408 sec.

Spectral model in the Band function:
------------------------------------------------------------
Parameters  : value       lower 90%   higher 90%
alpha       : -0.968281   ( -0.612253   1.18172 )
beta        : -10.0000    ( 10   1.06581e-14 )
Epeak [keV] : 43.8391      ( -11.2948 17.9423 )
Norm@50keV   : 1.97666E-02    ( -0.012489   0.0495964 )
------------------------------------------------------------
#Fit statistic : Chi-Squared =          46.63 using 59 PHA bins.
# Reduced chi-squared =         0.8478 for     55 degrees of freedom
# Null hypothesis probability =   7.817513e-01

Photon flux (15-150 keV)    in 14.34 sec: 0.769020 ( 6.23098  -0.090132 ) ph/cm2/s
Energy fluence (15-150 keV)             : 6.48015e-07 ( -6.47914e-07  -9.08539e-08 ) ergs/cm2
Single BB
Spectral model blackbody:
------------------------------------------------------------
Parameters  : value    Lower 90%  Upper 90%
kT [keV]    : 10.4138  (-1.16935  1.31107)
R^2/D10^2   : 0.319034  (-0.114767   0.18078)
(R is the radius in km and D10 is the distance to the source in units of 10 kpc)
------------------------------------------------------------
#Fit statistic : Chi-Squared =          60.47 using 59 PHA bins.
# Reduced chi-squared =          1.061 for     57 degrees of freedom
# Null hypothesis probability =   3.518191e-01

Energy  Fluence     90% Error
[keV]   [erg/cm2]   [erg/cm2]
15- 25  1.023e-07   1.738e-08
25- 50  2.691e-07   3.542e-08
50-150  1.578e-07   4.202e-08
15-150  5.292e-07   7.005e-08
Thermal bremsstrahlung (OTTB)
Spectral model: thermal bremsstrahlung
------------------------------------------------------------
Parameters  : value         Lower 90%    Upper 90%
kT [keV]    : 69.2967       (-18.3907      29.2831)
Norm        : 3.91821       (-0.570547     0.660149)
------------------------------------------------------------
#Fit statistic : Chi-Squared =          47.13 using 59 PHA bins.
# Reduced chi-squared =         0.8268 for     57 degrees of freedom
# Null hypothesis probability =   8.214564e-01

Energy  Fluence     90% Error
[keV]   [erg/cm2]   [erg/cm2]
15- 25  1.440e-07   2.032e-08
25- 50  2.285e-07   2.495e-08
50-150  2.913e-07   7.973e-08
15-150  6.637e-07   9.221e-08
Double BB
Spectral model: bbodyrad<1> + bbodyrad<2>
------------------------------------------------------------
Parameters  : value         Lower 90%    Upper 90%
kT1 [keV]   : 5.24258        (-2.21553      2.43674)
R1^2/D10^2  : 2.42210        (-1.71781      22.5501)
kT2 [keV]   : 15.5836        (-3.63895      7.68716)
R2^2/D10^2  : 5.21924E-02    (-0.0435683   0.116273)
------------------------------------------------------------
#Fit statistic : Chi-Squared =          46.59 using 59 PHA bins.
# Reduced chi-squared =         0.8470 for     55 degrees of freedom
# Null hypothesis probability =   7.831339e-01

Energy  Fluence     90% Error
[keV]   [erg/cm2]   [erg/cm2]
15- 25  1.395e-07   6.922e-08
25- 50  2.300e-07   1.079e-07
50-150  2.649e-07   1.546e-07
15-150  6.343e-07   2.872e-07
Peak spectrum fit
Power-law model
Time interval is from    1.324 sec. to    2.324 sec.

Spectral model in power-law:
------------------------------------------------------------
Parameters  : value       lower 90%   higher 90%
Photon index: 2.05878     ( -0.347403   0.392056 )
Norm@50keV  : 1.09533E-02    ( -0.00284461   0.00270444 )
------------------------------------------------------------
#Fit statistic : Chi-Squared =          76.40 using 59 PHA bins.
# Reduced chi-squared =          1.340 for     57 degrees of freedom
# Null hypothesis probability =   4.413103e-02

Photon flux (15-150 keV)    in 1 sec: 1.68901 ( -0.297663  0.297689 ) ph/cm2/s
Energy fluence (15-150 keV)             : 1.01401e-07 ( -2.30335e-08  2.41823e-08 ) ergs/cm2
Cutoff power-law model
Time interval is from    1.324 sec. to    2.324 sec.
Spectral model in the cutoff power-law:
------------------------------------------------------------
Parameters  : value       lower 90%   higher 90%
Photon index: 2.11204     (     )
Epeak [keV] : 62.5299      (   )
Norm@50keV  : 9.98731E-03    (     )
------------------------------------------------------------
#Fit statistic : Chi-Squared =          76.29 using 59 PHA bins.
# Reduced chi-squared =          1.362 for     56 degrees of freedom
# Null hypothesis probability =   3.704195e-02

Photon flux (15-150 keV)    in 1 sec: 1.68728 ( -0.29704  0.29754 ) ph/cm2/s
Energy fluence (15-150 keV)             : 1.01436e-07 ( -1.29819e-08  2.376e-08 ) ergs/cm2
Band function
Time interval is from    1.324 sec. to    2.324 sec.

Spectral model in the Band function:
------------------------------------------------------------
Parameters  : value       lower 90%   higher 90%
alpha       : 4.75828   ( -4.75828   -4.75828 )
beta        : -2.21259    ( -0.577592   0.425158 )
Epeak [keV] : 21.1318      ( -21.1318 5.80571 )
Norm@50keV   : 3727.45    ( -653.267   2.01158e+07 )
------------------------------------------------------------
#Fit statistic : Chi-Squared =          75.59 using 59 PHA bins.
# Reduced chi-squared =          1.374 for     55 degrees of freedom
# Null hypothesis probability =   3.416285e-02

Photon flux (15-150 keV)    in 1 sec:  (    ) ph/cm2/s
Energy fluence (15-150 keV)             : 0 ( 0  0 ) ergs/cm2
Single BB
Spectral model blackbody:
------------------------------------------------------------
Parameters  : value    Lower 90%  Upper 90%
kT [keV]    : 7.33083  (-1.54636  2.25262)
R^2/D10^2   : 2.52580  (-1.6221   4.06061)
(R is the radius in km and D10 is the distance to the source in units of 10 kpc)
------------------------------------------------------------
#Fit statistic : Chi-Squared =          85.67 using 59 PHA bins.
# Reduced chi-squared =          1.503 for     57 degrees of freedom
# Null hypothesis probability =   8.333690e-03

Energy  Fluence     90% Error
[keV]   [erg/cm2]   [erg/cm2]
15- 25  2.282e-08   8.470e-09
25- 50  3.412e-08   1.221e-08
50-150  6.663e-09   3.929e-09
15-150  6.361e-08   2.108e-08
Thermal bremsstrahlung (OTTB)
Spectral model: thermal bremsstrahlung
------------------------------------------------------------
Parameters  : value         Lower 90%    Upper 90%
kT [keV]    : 57.0574       (-25.9417      68.4432)
Norm        : 8.98987       (-2.52367     4.06044)
------------------------------------------------------------
#Fit statistic : Chi-Squared =          78.06 using 59 PHA bins.
# Reduced chi-squared =          1.369 for     57 degrees of freedom
# Null hypothesis probability =   3.347319e-02

Energy  Fluence     90% Error
[keV]   [erg/cm2]   [erg/cm2]
15- 25  2.240e-08   5.175e-09
25- 50  3.356e-08   8.840e-09
50-150  3.659e-08   1.939e-08
15-150  9.255e-08   3.077e-08
Double BB
Spectral model: bbodyrad<1> + bbodyrad<2>
------------------------------------------------------------
Parameters  : value         Lower 90%    Upper 90%
kT1 [keV]   : 5.82540        (-1.59638      2.02771)
R1^2/D10^2  : 5.66200        (-3.77358      14.2836)
kT2 [keV]   : 37.7399        (-22.3209      -38.0422)
R2^2/D10^2  : 4.78962E-03    (-0.00447793   0.0526856)
------------------------------------------------------------
#Fit statistic : Chi-Squared =          74.15 using 59 PHA bins.
# Reduced chi-squared =          1.348 for     55 degrees of freedom
# Null hypothesis probability =   4.354096e-02

Energy  Fluence     90% Error
[keV]   [erg/cm2]   [erg/cm2]
15- 25  2.536e-08   1.307e-08
25- 50  2.899e-08   1.355e-08
50-150  5.643e-08   3.580e-08
15-150  1.108e-07   5.612e-08
Pre-slew spectrum (Pre-slew PHA with pre-slew DRM)
Power-law model
Spectral model in power-law:
------------------------------------------------------------
Parameters  : value       lower 90%   higher 90%
Photon index: 1.96460     ( -0.179694   0.190435 )
Norm@50keV  : 5.35846E-03    ( -0.000675567   0.000661932 )
------------------------------------------------------------
#Fit statistic : Chi-Squared =          51.64 using 59 PHA bins.
# Reduced chi-squared =         0.9059 for     57 degrees of freedom
# Null hypothesis probability =   6.758036e-01

Photon flux (15-150 keV)    in 14.34 sec: 0.790965 ( -0.0778136  0.0778268 ) ph/cm2/s
Energy fluence (15-150 keV)             : 7.0748e-07 ( -8.43284e-08  8.62627e-08 ) ergs/cm2
Cutoff power-law model

Spectral model in the cutoff power-law:
------------------------------------------------------------
Parameters  : value       lower 90%   higher 90%
Photon index: 0.968183     ( -0.950276   0.778723 )
Epeak [keV] : 43.8469      ( -11.3306 17.9375 )
Norm@50keV  : 1.97702E-02    ( -0.0124905   0.0494406 )
------------------------------------------------------------
#Fit statistic : Chi-Squared =          46.63 using 59 PHA bins.
# Reduced chi-squared =         0.8327 for     56 degrees of freedom
# Null hypothesis probability =   8.095638e-01

Photon flux (15-150 keV)    in 14.34 sec: 0.761072 ( -0.080558  0.080768 ) ph/cm2/s
Energy fluence (15-150 keV)             : 6.47095e-07 ( -8.93296e-08  9.54442e-08 ) ergs/cm2
Band function
Spectral model in the Band function:
------------------------------------------------------------
Parameters  : value       lower 90%   higher 90%
alpha       : -0.968281   ( -0.612253   1.18172 )
beta        : -10.0000    ( 10   1.77636e-14 )
Epeak [keV] : 43.8391      ( -11.2948 17.9423 )
Norm@50keV   : 1.97666E-02    ( -0.012489   0.0495964 )
------------------------------------------------------------
#Fit statistic : Chi-Squared =          46.63 using 59 PHA bins.
# Reduced chi-squared =         0.8478 for     55 degrees of freedom
# Null hypothesis probability =   7.817513e-01

Photon flux (15-150 keV)    in 14.34 sec: 0.769020 ( 6.23098  -0.090132 ) ph/cm2/s
Energy fluence (15-150 keV)             : 6.48015e-07 ( -6.47914e-07  -9.08539e-08 ) ergs/cm2
S(25-50 keV) vs. S(50-100 keV) plot
S(25-50 keV)  = 2.11e-07
S(50-100 keV) = 2.16e-07
T90 vs. Hardness ratio plot
T90                                   = 12.2400000095367 sec.
Hardness ratio (energy fluence ratio) = 1.0237
Color vs. Color plot
Count Ratio  (25-50 keV) / (15-25 keV) = 1.36044
Count Ratio (50-100 keV) / (15-25 keV) = 0.666504
Mask shadow pattern
IMX = 9.185392598813594E-01, IMY = -2.768482040946642E-02
TIME vs. PHA plot around the trigger time
Blue+Cyan dotted lines: Time interval of the scaled map
From 0.000000 to 1.024000
TIME vs. DetID plot around the trigger time
Blue+Cyan dotted lines: Time interval of the scaled map
From 0.000000 to 1.024000
100 us light curve (15-350 keV)
Blue+Cyan dotted lines: Time interval of the scaled map
From 0.000000 to 1.024000
Spacecraft aspect plot
Bright source in the pre-burst/pre-slew/post-slew images
Pre-burst image of 15-350 keV band
Time interval of the image:
-119.224000 -1.928000

# RAcent  DECcent POSerr Theta    Phi  PeakCts   SNR AngSep     Name
#  [deg]    [deg]    ['] [deg]  [deg]                   [']
135.4880 -40.5509    1.9  35.6    1.3   1.2795   6.1    1.9	Vela X-1
108.4441 -25.5352    3.3  33.1   50.0   0.9178   3.5 ------	UNKNOWN
139.4625  51.8505    2.7  56.9 -175.8   3.6857   4.2 ------	UNKNOWN
167.7385 -51.3737    2.4  53.6  -23.2   2.2314   4.9 ------	UNKNOWN
176.0594 -23.8025    2.6  43.4  -58.9   2.2979   4.4 ------	UNKNOWN
Pre-slew background subtracted image of 15-350 keV band
Time interval of the image:
-1.928000 12.408000

# RAcent  DECcent POSerr Theta    Phi  PeakCts   SNR AngSep     Name
#  [deg]    [deg]    ['] [deg]  [deg]                   [']
135.6875 -40.5099    5.2  35.5    1.0   0.1502   2.2    7.7	Vela X-1
 98.1733 -31.0731    2.1  43.6   50.0   1.1027   5.5 ------	UNKNOWN
135.0243 -47.5563    0.8  42.6    1.7   1.2462  15.0 ------	UNKNOWN
159.5894  45.0508    2.3  54.5 -157.9   0.8349   5.1 ------	UNKNOWN
Post-slew image of 15-350 keV band
Time interval of the image:
85.076600 962.851800

# RAcent  DECcent POSerr Theta    Phi  PeakCts   SNR AngSep     Name
#  [deg]    [deg]    ['] [deg]  [deg]                   [']
135.5137 -40.5664    0.7   7.0 -147.9   9.2105  17.3    1.0	Vela X-1
170.3609 -60.6703    3.2  24.0  -14.4   2.1024   3.5    3.1	Cen X-3
186.6389 -62.7529    0.8  32.0  -13.0   9.8017  15.2    1.2	GX 301-2
 88.5375 -63.4385    3.1  29.8   70.4   3.8067   3.8 ------	UNKNOWN
183.8679 -73.8103    2.1  33.6    7.3   3.4426   5.5 ------	UNKNOWN
205.1560 -37.5882    3.4  50.7  -44.5  11.0295   4.0 ------	UNKNOWN
204.8634 -37.4823    5.3  50.6  -44.8   8.4985   3.0 ------	UNKNOWN
Plot creation:
Sat May 30 15:30:03 EDT 2015