Click here for the BAT GCN circular template
Image
Pre-slew 15.0-350.0 keV image (Event data)
#   RAcent    DECcent   POSerr    Theta     Phi              Peak Cts       SNR   Name
  290.5431   -64.6003   0.0174    21.2058   -58.5979         0.6764293     11.073 TRIG_00575707

Foreground time interval of the image:
-13.499  17.000 (delta_t =  30.499 [sec])
Background time interval of the image:
Lightcurves
Notes:
- 1) The mask-weighted light curves are using the flight position.
- 2) Multiple plots of different time binning/intervals are shown to cover all scenarios of short/long GRBs, rate/image triggers, and real/false positives.
- 3) For all the mask-weighted lightcurves, the y-axis units are counts/sec/det where a det is 0.4 x 0.4 = 0.16 sq cm.
- 4) The verticle lines correspond to following: green dotted lines are T50 interval, black dotted lines are T90 interval, blue solid line(s) is a spacecraft slew start time, and orange solid line(s) is a spacecraft slew end time.
- 5) Time of each bin is in the middle of the bin.
1 s binning
From T0-310 s to T0+310 s
From T100_start - 20 s to T100_end + 30 s
Full time interval
64 ms binning
Full time interval
From T100_start to T100_end
From T0-5 sec to T0+5 sec

16 ms binning
From T100_start-5 s to T100_start+5 s
Blue+Cyan dotted lines: Time interval of the scaled map
From 0.000000 to 64.000000
8 ms binning
From T100_start-3 s to T100_start+3 s
Blue+Cyan dotted lines: Time interval of the scaled map
From 0.000000 to 64.000000
2 ms binning
From T100_start-1 s to T100_start+1 s
Blue+Cyan dotted lines: Time interval of the scaled map
From 0.000000 to 64.000000
SN=5 or 10 sec. binning (whichever binning is satisfied first)
SN=5 or 10 sec. binning (T < 200 sec)

Quad-rate summed light curves (from T0-300s to T0+1000s)
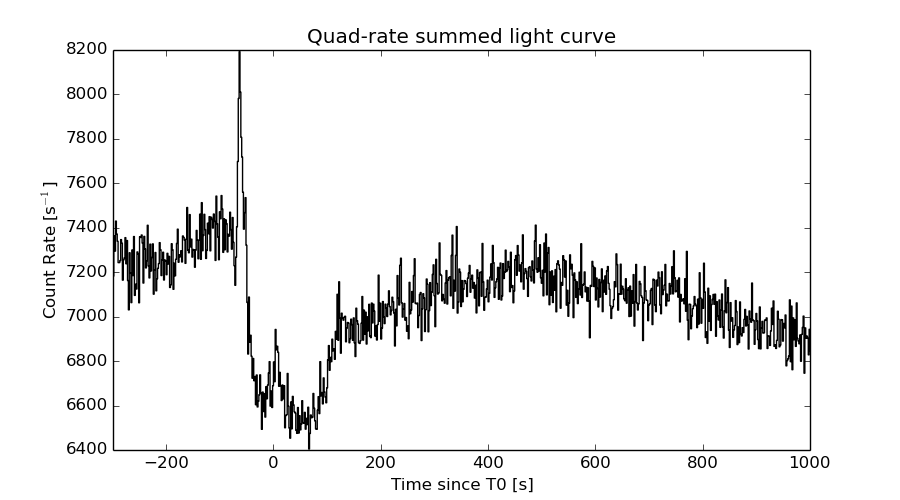
The mask-weighted light curves based on cleaned DPHs

Spectral Evolution

Spectra
Notes:
- 1) The fitting includes the systematic errors.
- 2) When the burst includes telescope slew time periods, the fitting uses an average response file made from multiple 5-s response files through out the slew time plus single time preiod for the non-slew times, and weighted by the total counts in the corresponding time period using addrmf. An average response file is needed becuase a spectral fit using the pre-slew DRM will introduce some errors in both a spectral shape and a normalization if the PHA file contains a lot of the slew/post-slew time interval.
- 3) For fits to more complicated models (e.g. a power-law over a cutoff power-law), the BAT team has decided to require a chi-square improvement of more than 6 for each extra dof.
Time averaged spectrum fit using the average DRM
Power-law model
Time interval is from -111.000 sec. to   17.000 sec.

Spectral model in power-law:
------------------------------------------------------------
Parameters  : value       lower 90%   higher 90%
Photon index: 1.84237     ( -0.177414   0.183502 )
Norm@50keV  : 1.02773E-03    ( -0.000118106   0.000115936 )
------------------------------------------------------------
#Fit statistic : Chi-Squared =          53.70 using 59 PHA bins.
# Reduced chi-squared =         0.9420 for     57 degrees of freedom
# Null hypothesis probability =   5.998148e-01

Photon flux (15-150 keV)    in 128 sec: 0.144014 ( -0.0140177  0.0140243 ) ph/cm2/s
Energy fluence (15-150 keV)             : 1.20972e-06 ( -1.38244e-07  1.408e-07 ) ergs/cm2
Cutoff power-law model

Time interval is from -111.000 sec. to   17.000 sec.
Spectral model in the cutoff power-law:
------------------------------------------------------------
Parameters  : value       lower 90%   higher 90%
Photon index: 1.43612     ( -0.85654   0.696687 )
Epeak [keV] : 59.1993      ( -21.6447 -59.2021 )
Norm@50keV  : 1.75053E-03    ( -0.000809109   0.0036697 )
------------------------------------------------------------
#Fit statistic : Chi-Squared =          52.75 using 59 PHA bins.
# Reduced chi-squared =         0.9419 for     56 degrees of freedom
# Null hypothesis probability =   5.987559e-01

Photon flux (15-150 keV)    in 128 sec: 0.141420 ( -0.014483  0.01468 ) ph/cm2/s
Energy fluence (15-150 keV)             : 1.15415e-06 ( -1.66522e-07  1.69302e-07 ) ergs/cm2
Band function

Time interval is from -111.000 sec. to   17.000 sec.

Spectral model in the Band function:
------------------------------------------------------------
Parameters  : value       lower 90%   higher 90%
alpha       : -1.45357   ( -3.06174   0.572155 )
beta        : -9.37167    ( 9.37167   19.3717 )
Epeak [keV] : 60.2577      ( -21.5653 -60.2347 )
Norm@50keV   : 1.70781E-03    ( -0.00080779   0.000902103 )
------------------------------------------------------------
#Fit statistic : Chi-Squared =          52.75 using 59 PHA bins.
# Reduced chi-squared =         0.9591 for     55 degrees of freedom
# Null hypothesis probability =   5.610977e-01

Photon flux (15-150 keV)    in 128 sec:  (    ) ph/cm2/s
Energy fluence (15-150 keV)             : 1.16332e-06 ( 0  0 ) ergs/cm2
Single BB

Spectral model blackbody:
------------------------------------------------------------
Parameters  : value    Lower 90%  Upper 90%
kT [keV]    : 10.3584  (-1.15323  1.34244)
R^2/D10^2   : 5.87545E-02  (-0.0218204   0.0334696)
(R is the radius in km and D10 is the distance to the source in units of 10 kpc)
------------------------------------------------------------
#Fit statistic : Chi-Squared =          71.78 using 59 PHA bins.
# Reduced chi-squared =          1.259 for     57 degrees of freedom
# Null hypothesis probability =   8.995316e-02

Energy  Fluence     90% Error
[keV]   [erg/cm2]   [erg/cm2]
15- 25  1.662e-07   2.822e-08
25- 50  4.339e-07   5.235e-08
50-150  2.505e-07   6.355e-08
15-150  8.506e-07   1.014e-07
Thermal bremsstrahlung (OTTB)
Spectral model: thermal bremsstrahlung
------------------------------------------------------------
Parameters  : value         Lower 90%    Upper 90%
kT [keV]    : 87.2885       (-25.6802      47.3021)
Norm        : 0.657588       (-0.0911126     0.112061)
------------------------------------------------------------
#Fit statistic : Chi-Squared =          52.77 using 59 PHA bins.
# Reduced chi-squared =         0.9257 for     57 degrees of freedom
# Null hypothesis probability =   6.344922e-01

Energy  Fluence     90% Error
[keV]   [erg/cm2]   [erg/cm2]
15- 25  2.194e-07   3.110e-08
25- 50  3.686e-07   4.058e-08
50-150  5.506e-07   2.312e-07
15-150  1.139e-06   2.328e-07
Double BB

Spectral model: bbodyrad<1> + bbodyrad<2>
------------------------------------------------------------
Parameters  : value         Lower 90%    Upper 90%
kT1 [keV]   : 6.71112        (-1.97158      1.91047)
R1^2/D10^2  : 0.217131        (-0.0825842      0.215927)
kT2 [keV]   : 23.2575        (-11.0942      41.2186)
R2^2/D10^2  : 1.75312E-03    (-0.000740213   0.00391805)
------------------------------------------------------------
#Fit statistic : Chi-Squared =          51.63 using 59 PHA bins.
# Reduced chi-squared =         0.9387 for     55 degrees of freedom
# Null hypothesis probability =   6.042125e-01

Energy  Fluence     90% Error
[keV]   [erg/cm2]   [erg/cm2]
15- 25  2.140e-07   1.204e-07
25- 50  3.615e-07   1.809e-07
50-150  5.167e-07   3.012e-07
15-150  1.092e-06   5.871e-07
Peak spectrum fit
Power-law model
Time interval is from  -55.500 sec. to  -54.500 sec.

Spectral model in power-law:
------------------------------------------------------------
Parameters  : value       lower 90%   higher 90%
Photon index: 1.17453     ( -0.796575   0.712817 )
Norm@50keV  : 2.12742E-03    ( -0.00100097   0.000998274 )
------------------------------------------------------------
#Fit statistic : Chi-Squared =          60.44 using 59 PHA bins.
# Reduced chi-squared =          1.060 for     57 degrees of freedom
# Null hypothesis probability =   3.528376e-01

Photon flux (15-150 keV)    in 1 sec: 0.248570 ( -0.116924  0.120777 ) ph/cm2/s
Energy fluence (15-150 keV)             : 2.17721e-08 ( -1.06671e-08  1.10368e-08 ) ergs/cm2
Cutoff power-law model
Time interval is from  -55.500 sec. to  -54.500 sec.
Spectral model in the cutoff power-law:
------------------------------------------------------------
Parameters  : value       lower 90%   higher 90%
Photon index: -9.99919     ( 9.99973   9.2331 )
Epeak [keV] : 41.3063      ( -6.44891 25.3623 )
Norm@50keV  : 7059.03    ( -7098.62   41555.2 )
------------------------------------------------------------
#Fit statistic : Chi-Squared =          55.55 using 59 PHA bins.
# Reduced chi-squared =         0.9919 for     56 degrees of freedom
# Null hypothesis probability =   4.920125e-01

Photon flux (15-150 keV)    in 1 sec: 0.212050 ( -0.08501  0.087236 ) ph/cm2/s
Energy fluence (15-150 keV)             : 1.28303e-08 ( -5.13761e-09  8.4781e-09 ) ergs/cm2
Band function
Time interval is from  -55.500 sec. to  -54.500 sec.

Spectral model in the Band function:
------------------------------------------------------------
Parameters  : value       lower 90%   higher 90%
alpha       : 5.00000   ( -6.11039   -5 )
beta        : -2.72449    ( 2.71776   1.51587 )
Epeak [keV] : 44.2869      ( -11.6501 14.2758 )
Norm@50keV   : 9.05265    ( -3.59447   41.4447 )
------------------------------------------------------------
#Fit statistic : Chi-Squared =          55.72 using 59 PHA bins.
# Reduced chi-squared =          1.013 for     55 degrees of freedom
# Null hypothesis probability =   4.476899e-01

Photon flux (15-150 keV)    in 1 sec:  (    ) ph/cm2/s
Energy fluence (15-150 keV)             : 1.95049e-08 ( -1.94979e-08  -9.75484e-09 ) ergs/cm2
Single BB
Spectral model blackbody:
------------------------------------------------------------
Parameters  : value    Lower 90%  Upper 90%
kT [keV]    : 14.9120  (-5.03745  10.9258)
R^2/D10^2   : 3.43021E-02  (-0.0343021   0.110103)
(R is the radius in km and D10 is the distance to the source in units of 10 kpc)
------------------------------------------------------------
#Fit statistic : Chi-Squared =          58.05 using 59 PHA bins.
# Reduced chi-squared =          1.018 for     57 degrees of freedom
# Null hypothesis probability =   4.365553e-01

Energy  Fluence     90% Error
[keV]   [erg/cm2]   [erg/cm2]
15- 25  1.599e-09   1.044e-09
25- 50  6.317e-09   4.196e-09
50-150  9.534e-09   6.720e-09
15-150  1.745e-08   1.147e-08
Thermal bremsstrahlung (OTTB)

Spectral model: thermal bremsstrahlung
------------------------------------------------------------
Parameters  : value         Lower 90%    Upper 90%
kT [keV]    : 199.363       (-199.363      -199.363)
Norm        : 1.04762       (-0.498146     0.498146)
------------------------------------------------------------
#Fit statistic : Chi-Squared =          60.76 using 59 PHA bins.
# Reduced chi-squared =          1.066 for     57 degrees of freedom
# Null hypothesis probability =   3.421967e-01

Energy  Fluence     90% Error
[keV]   [erg/cm2]   [erg/cm2]
15- 25  2.609e-09   1.825e-09
25- 50  5.018e-09   3.351e-09
50-150  1.101e-08   7.230e-09
15-150  1.863e-08   1.213e-08
Double BB

------------------------------------------------------------
#Fit statistic : Chi-Squared =          58.05 using 59 PHA bins.
#Fit statistic : Chi-Squared =          57.92 using 59 PHA bins.
#Fit statistic : Chi-Squared =          57.90 using 59 PHA bins.
#Fit statistic : Chi-Squared =          57.89 using 59 PHA bins.
# Reduced chi-squared =          1.055 for     55 degrees of freedom
# Reduced chi-squared =          1.053 for     55 degrees of freedom
# Reduced chi-squared =          1.053 for     55 degrees of freedom
# Reduced chi-squared =          1.053 for     55 degrees of freedom
# Null hypothesis probability =   3.637322e-01
# Null hypothesis probability =   3.681225e-01
# Null hypothesis probability =   3.686317e-01
# Null hypothesis probability =   3.690496e-01

Energy  Fluence     90% Error
[keV]   [erg/cm2]   [erg/cm2]
15- 25  0.000e+00   0.000e+00
25- 50  0.000e+00   0.000e+00
50-150  0.000e+00   0.000e+00
15-150  0.000e+00   0.000e+00
Pre-slew spectrum (Pre-slew PHA with pre-slew DRM)
Power-law model

Spectral model in power-law:
------------------------------------------------------------
Parameters  : value       lower 90%   higher 90%
Photon index: 1.78620     ( -0.219459   0.229644 )
Norm@50keV  : 1.42479E-03    ( -0.00021907   0.000214763 )
------------------------------------------------------------
#Fit statistic : Chi-Squared =          75.56 using 59 PHA bins.
# Reduced chi-squared =          1.326 for     57 degrees of freedom
# Null hypothesis probability =   5.047396e-02

Photon flux (15-150 keV)    in 30.5 sec: 0.195292 ( -0.0250968  0.0250979 ) ph/cm2/s
Energy fluence (15-150 keV)             : 4.00276e-07 ( -6.20025e-08  6.37319e-08 ) ergs/cm2
Cutoff power-law model

Spectral model in the cutoff power-law:
------------------------------------------------------------
Parameters  : value       lower 90%   higher 90%
Photon index: 0.398613     ( -1.6368   1.15206 )
Epeak [keV] : 46.4798      ( -9.25609 36.4883 )
Norm@50keV  : 9.37339E-03    ( -0.0093832   0.0822495 )
------------------------------------------------------------
#Fit statistic : Chi-Squared =          71.13 using 59 PHA bins.
# Reduced chi-squared =          1.270 for     56 degrees of freedom
# Null hypothesis probability =   8.383613e-02

Photon flux (15-150 keV)    in 30.5 sec: 0.186359 ( -0.025887  0.026047 ) ph/cm2/s
Energy fluence (15-150 keV)             : 3.43897e-07 ( -6.53609e-08  7.59633e-08 ) ergs/cm2
Band function
Spectral model in the Band function:
------------------------------------------------------------
Parameters  : value       lower 90%   higher 90%
alpha       : 7.08850E-02   ( -1.41459   -0.0942821 )
beta        : -2.58837    ( 2.58542   0.739199 )
Epeak [keV] : 41.7573      ( -16.9286 28.0234 )
Norm@50keV   : 1.93872E-02    ( -0.0219128   43.348 )
------------------------------------------------------------
#Fit statistic : Chi-Squared =          70.05 using 59 PHA bins.
# Reduced chi-squared =          1.274 for     55 degrees of freedom
# Null hypothesis probability =   8.313453e-02

Photon flux (15-150 keV)    in 30.5 sec:  (    ) ph/cm2/s
Energy fluence (15-150 keV)             : 3.61767e-07 ( 0  0 ) ergs/cm2
S(25-50 keV) vs. S(50-100 keV) plot

S(25-50 keV)  = 3.46e-07
S(50-100 keV) = 3.86e-07
T90 vs. Hardness ratio plot
T90                                   = 112 sec.
Hardness ratio (energy fluence ratio) = 1.11561
Color vs. Color plot
Count Ratio  (25-50 keV) / (15-25 keV) = 1.2799
Count Ratio (50-100 keV) / (15-25 keV) = 0.686293
Mask shadow pattern
IMX = 2.021591177065915E-01, IMY = 3.311626777814657E-01
TIME vs. PHA plot around the trigger time
Blue+Cyan dotted lines: Time interval of the scaled map
From 0.000000 to 64.000000
TIME vs. DetID plot around the trigger time
Blue+Cyan dotted lines: Time interval of the scaled map
From 0.000000 to 64.000000
100 us light curve (15-350 keV)

Blue+Cyan dotted lines: Time interval of the scaled map
From 0.000000 to 64.000000
Spacecraft aspect plot
Bright source in the pre-burst/pre-slew/post-slew images
Pre-burst image of 15-350 keV band
Time interval of the image:
Pre-slew background subtracted image of 15-350 keV band
Time interval of the image:
-13.499370 17.000000

# RAcent  DECcent POSerr Theta    Phi  PeakCts   SNR AngSep     Name
#  [deg]    [deg]    ['] [deg]  [deg]                   [']
264.7285 -44.4868    3.5  45.4  -48.5  -0.5296  -3.4    2.3	4U 1735-44
275.9577 -30.2676   15.5  52.7  -28.4   0.1423   0.7    6.2	H1820-303
285.1157 -24.8337    5.3  53.8  -16.3  -0.3317  -2.2    6.8	HT1900.1-2455
290.5431 -64.6003    1.0  21.2  -58.6   0.6764  11.1 ------	UNKNOWN
136.8990 -73.0535    1.9  40.9 -137.0   0.6201   6.2 ------	UNKNOWN
Post-slew image of 15-350 keV band
Time interval of the image:
117.500580 963.104500

# RAcent  DECcent POSerr Theta    Phi  PeakCts   SNR AngSep     Name
#  [deg]    [deg]    ['] [deg]  [deg]                   [']
170.3283 -60.6230   10.2  47.1 -147.0  -1.5124  -1.1    0.4	Cen X-3
186.7058 -62.8382    2.9  40.8 -139.7   3.8424   3.9    4.3	GX 301-2
255.9826 -37.8334    1.6  33.6  -56.4   6.1469   7.2    0.7	4U 1700-377
256.5008 -36.5927    7.6  34.5  -54.8   1.3472   1.5   10.7	GX 349+2
263.1345 -24.7628    6.2  43.6  -39.7   1.7945   1.9    6.9	GX 1+4
264.5424 -44.4131    5.7  24.8  -50.6   1.2479   2.0    8.9	4U 1735-44
270.3234 -25.0655    3.4  41.6  -30.5   2.9060   3.5    2.3	GX 5-1
270.2706 -25.7615    3.1  41.0  -30.8   2.9405   3.7    2.1	GRS 1758-258
273.8255 -14.1622    0.0  51.7  -23.2  -0.3939  -0.3   12.9	GX 17+2
275.8392 -30.4105    3.4  35.4  -24.5   2.4012   3.4    5.2	H1820-303
285.1378 -25.0766    0.0  39.7  -10.0  -0.1396  -0.2   10.9	HT1900.1-2455
263.0287 -33.7009    6.7  35.1  -44.2   1.2792   1.7    8.3	GX 354-0
 12.7092 -87.7282    3.7  25.2  172.3   2.0682   3.2 ------	UNKNOWN
284.4920  -7.5570    3.7  57.2   -9.5   7.3270   3.1 ------	UNKNOWN
137.5530 -63.2217    3.1  50.6 -167.0   5.6863   3.7 ------	UNKNOWN
259.0799 -20.5949    2.4  48.7  -42.9   8.4299   4.8 ------	UNKNOWN
Plot creation:
Sat May 30 15:20:38 EDT 2015