Special notes of this burst
Image
Pre-slew 15.0-350.0 keV image (Event data)

#   RAcent    DECcent   POSerr    Theta     Phi              Peak Cts       SNR   Name
  144.4731    44.2622   0.0151    28.2521    82.6909         1.7513642     12.700 TRIG_00575754

Foreground time interval of the image:
 -8.280  49.909 (delta_t =  58.189 [sec])
Background time interval of the image:
-239.592  -8.280 (delta_t = 231.312 [sec])
Lightcurves
Notes:
- 1) The mask-weighted light curves are using the flight position.
- 2) Multiple plots of different time binning/intervals are shown to cover all scenarios of short/long GRBs, rate/image triggers, and real/false positives.
- 3) For all the mask-weighted lightcurves, the y-axis units are counts/sec/det where a det is 0.4 x 0.4 = 0.16 sq cm.
- 4) The verticle lines correspond to following: green dotted lines are T50 interval, black dotted lines are T90 interval, blue solid line(s) is a spacecraft slew start time, and orange solid line(s) is a spacecraft slew end time.
- 5) Time of each bin is in the middle of the bin.
1 s binning
From T0-310 s to T0+310 s

From T100_start - 20 s to T100_end + 30 s

Full time interval

64 ms binning
Full time interval
From T100_start to T100_end

From T0-5 sec to T0+5 sec

16 ms binning
From T100_start-5 s to T100_start+5 s

8 ms binning
From T100_start-3 s to T100_start+3 s
2 ms binning
From T100_start-1 s to T100_start+1 s

SN=5 or 10 sec. binning (whichever binning is satisfied first)

SN=5 or 10 sec. binning (T < 200 sec)

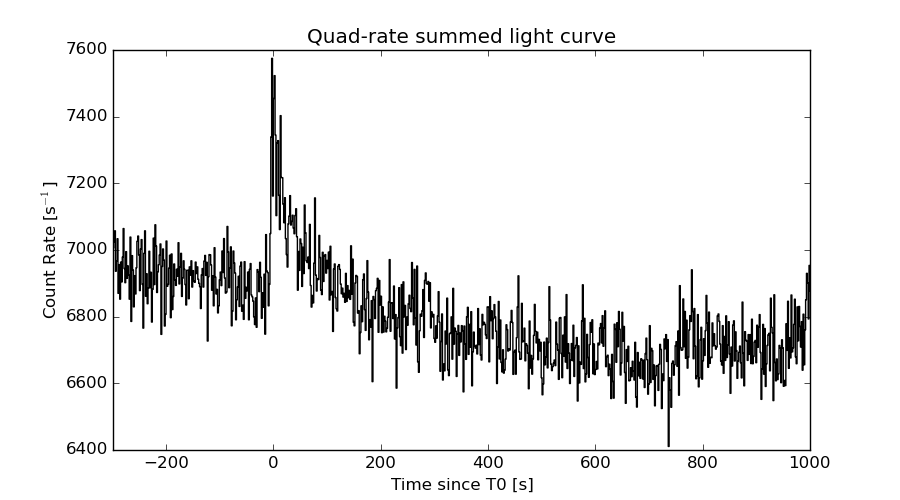
Quad-rate summed light curves (from T0-300s to T0+1000s)
Spectral Evolution

Spectra
Notes:
- 1) The fitting includes the systematic errors.
- 2) When the burst includes telescope slew time periods, the fitting uses an average response file made from multiple 5-s response files through out the slew time plus single time preiod for the non-slew times, and weighted by the total counts in the corresponding time period using addrmf. An average response file is needed becuase a spectral fit using the pre-slew DRM will introduce some errors in both a spectral shape and a normalization if the PHA file contains a lot of the slew/post-slew time interval.
- 3) For fits to more complicated models (e.g. a power-law over a cutoff power-law), the BAT team has decided to require a chi-square improvement of more than 6 for each extra dof.
Time averaged spectrum fit using the average DRM
Power-law model
Time interval is from   -8.280 sec. to  101.016 sec.

Spectral model in power-law:
------------------------------------------------------------
Parameters  : value       lower 90%   higher 90%
Photon index: 0.998425     ( -0.221691   0.21367 )
Norm@50keV  : 1.23326E-03    ( -0.000147436   0.000146264 )
------------------------------------------------------------
#Fit statistic : Chi-Squared =          64.08 using 59 PHA bins.
# Reduced chi-squared =          1.124 for     57 degrees of freedom
# Null hypothesis probability =   2.421515e-01

Photon flux (15-150 keV)    in 109.3 sec: 0.142004 ( -0.0172043  0.0172259 ) ph/cm2/s
Energy fluence (15-150 keV)             : 1.45839e-06 ( -1.8169e-07  1.8279e-07 ) ergs/cm2
Cutoff power-law model
Time interval is from   -8.280 sec. to  101.016 sec.
Spectral model in the cutoff power-law:
------------------------------------------------------------
Parameters  : value       lower 90%   higher 90%
Photon index: 0.865488     ( -1.02249   0.328737 )
Epeak [keV] : 515.821      ( -515.455 -515.455 )
Norm@50keV  : 1.40257E-03    ( -0.000282279   0.00213721 )
------------------------------------------------------------
#Fit statistic : Chi-Squared =          64.01 using 59 PHA bins.
# Reduced chi-squared =          1.143 for     56 degrees of freedom
# Null hypothesis probability =   2.159280e-01

Photon flux (15-150 keV)    in 109.3 sec: 0.140978 ( -0.018595  0.009048 ) ph/cm2/s
Energy fluence (15-150 keV)             : 1.45132e-06 ( -9.60419e-08  1.88215e-07 ) ergs/cm2
Band function

Time interval is from   -8.280 sec. to  101.016 sec.

Spectral model in the Band function:
------------------------------------------------------------
Parameters  : value       lower 90%   higher 90%
alpha       : -0.860812   ( 0.860813   0.860813 )
beta        : -0.998425    ( -0.213564   0.222005 )
Epeak [keV] : 34.6485      ( -34.6484 -34.6484 )
Norm@50keV   : 1.99094E-03    ( -0.000902305   0 )
------------------------------------------------------------
#Fit statistic : Chi-Squared =          64.08 using 59 PHA bins.
# Reduced chi-squared =          1.165 for     55 degrees of freedom
# Null hypothesis probability =   1.880625e-01

Photon flux (15-150 keV)    in 109.3 sec:  (    ) ph/cm2/s
Energy fluence (15-150 keV)             : 0 ( 0  0 ) ergs/cm2
Single BB

Spectral model blackbody:
------------------------------------------------------------
Parameters  : value    Lower 90%  Upper 90%
kT [keV]    : 23.7597  (-3.40271  4.38519)
R^2/D10^2   : 3.96871E-03  (-0.00161134   0.00249971)
(R is the radius in km and D10 is the distance to the source in units of 10 kpc)
------------------------------------------------------------
#Fit statistic : Chi-Squared =          72.87 using 59 PHA bins.
# Reduced chi-squared =          1.278 for     57 degrees of freedom
# Null hypothesis probability =   7.663085e-02

Energy  Fluence     90% Error
[keV]   [erg/cm2]   [erg/cm2]
15- 25  4.367e-08   1.089e-08
25- 50  2.412e-07   5.192e-08
50-150  1.015e-06   1.994e-07
15-150  1.300e-06   2.534e-07
Thermal bremsstrahlung (OTTB)

Spectral model: thermal bremsstrahlung
------------------------------------------------------------
Parameters  : value         Lower 90%    Upper 90%
kT [keV]    : 200.000       (      )
Norm        : 0.589559       (-0.0715754     0.0715679)
------------------------------------------------------------
#Fit statistic : Chi-Squared =          83.19 using 59 PHA bins.
# Reduced chi-squared =          1.459 for     57 degrees of freedom
# Null hypothesis probability =   1.340193e-02

Energy  Fluence     90% Error
[keV]   [erg/cm2]   [erg/cm2]
15- 25  1.605e-07   9.039e-08
25- 50  3.088e-07   1.691e-07
50-150  6.772e-07   3.767e-07
15-150  1.146e-06   6.268e-07
Double BB

Spectral model: bbodyrad<1> + bbodyrad<2>
------------------------------------------------------------
Parameters  : value         Lower 90%    Upper 90%
kT1 [keV]   : 3.69555        (-1.30419      2.15613)
R1^2/D10^2  : 1.39664        (-1.23358      14.729)
kT2 [keV]   : 27.2517        (-4.45762      6.52618)
R2^2/D10^2  : 2.48622E-03    (-0.00118451   0.00186708)
------------------------------------------------------------
#Fit statistic : Chi-Squared =          59.38 using 59 PHA bins.
# Reduced chi-squared =          1.080 for     55 degrees of freedom
# Null hypothesis probability =   3.191880e-01

Energy  Fluence     90% Error
[keV]   [erg/cm2]   [erg/cm2]
15- 25  1.268e-07   6.367e-08
25- 50  2.245e-07   6.577e-08
50-150  1.071e-06   2.817e-07
15-150  1.422e-06   3.417e-07
Peak spectrum fit
Power-law model

Time interval is from    1.036 sec. to    2.036 sec.

Spectral model in power-law:
------------------------------------------------------------
Parameters  : value       lower 90%   higher 90%
Photon index: 0.570049     ( -0.444178   0.394375 )
Norm@50keV  : 6.68617E-03    ( -0.0019029   0.00184873 )
------------------------------------------------------------
#Fit statistic : Chi-Squared =          73.27 using 59 PHA bins.
# Reduced chi-squared =          1.285 for     57 degrees of freedom
# Null hypothesis probability =   7.213927e-02

Photon flux (15-150 keV)    in 1 sec: 0.783512 ( -0.198336  0.202045 ) ph/cm2/s
Energy fluence (15-150 keV)             : 8.67633e-08 ( -2.12683e-08  2.13833e-08 ) ergs/cm2
Cutoff power-law model

Time interval is from    1.036 sec. to    2.036 sec.
Spectral model in the cutoff power-law:
------------------------------------------------------------
Parameters  : value       lower 90%   higher 90%
Photon index: -5.76314     (     )
Epeak [keV] : 85.1771      ( -12.0534 40.2544 )
Norm@50keV  : 0.793973    (     )
------------------------------------------------------------
#Fit statistic : Chi-Squared =          65.05 using 59 PHA bins.
# Reduced chi-squared =          1.162 for     56 degrees of freedom
# Null hypothesis probability =   1.907907e-01

Photon flux (15-150 keV)    in 1 sec: 0.646077 ( -0.173465  0.205923 ) ph/cm2/s
Energy fluence (15-150 keV)             : 7.55138e-08 ( -2.15577e-08  2.37234e-08 ) ergs/cm2
Band function

Time interval is from    1.036 sec. to    2.036 sec.

Spectral model in the Band function:
------------------------------------------------------------
Parameters  : value       lower 90%   higher 90%
alpha       : 4.29984   ( -0.850046   0.499119 )
beta        : -10.0000    ( 10   3.55271e-15 )
Epeak [keV] : 88.3174      ( -12.2617 39.1044 )
Norm@50keV   : 0.310855    ( -0.309155   0.422548 )
------------------------------------------------------------
#Fit statistic : Chi-Squared =          65.20 using 59 PHA bins.
# Reduced chi-squared =          1.185 for     55 degrees of freedom
# Null hypothesis probability =   1.633893e-01

Photon flux (15-150 keV)    in 1 sec:  (    ) ph/cm2/s
Energy fluence (15-150 keV)             : 0 ( 0  0 ) ergs/cm2
Single BB

Spectral model blackbody:
------------------------------------------------------------
Parameters  : value    Lower 90%  Upper 90%
kT [keV]    : 28.2136  (-6.25465  10.3886)
R^2/D10^2   : 1.57876E-02  (-0.00938576   0.017819)
(R is the radius in km and D10 is the distance to the source in units of 10 kpc)
------------------------------------------------------------
#Fit statistic : Chi-Squared =          67.46 using 59 PHA bins.
# Reduced chi-squared =          1.183 for     57 degrees of freedom
# Null hypothesis probability =   1.618793e-01

Energy  Fluence     90% Error
[keV]   [erg/cm2]   [erg/cm2]
15- 25  2.040e-09   1.146e-09
25- 50  1.226e-08   5.758e-09
50-150  7.042e-08   3.775e-08
15-150  8.472e-08   4.715e-08
Thermal bremsstrahlung (OTTB)
Spectral model: thermal bremsstrahlung
------------------------------------------------------------
Parameters  : value         Lower 90%    Upper 90%
kT [keV]    : 200.000       (      )
Norm        : 2.97291       (-0.867465     0.867391)
------------------------------------------------------------
#Fit statistic : Chi-Squared =          88.49 using 59 PHA bins.
# Reduced chi-squared =          1.552 for     57 degrees of freedom
# Null hypothesis probability =   4.750340e-03

Energy  Fluence     90% Error
[keV]   [erg/cm2]   [erg/cm2]
15- 25  7.401e-09   4.601e-09
25- 50  1.424e-08   8.845e-09
50-150  3.122e-08   1.957e-08
15-150  5.286e-08   3.284e-08
Double BB

Spectral model: bbodyrad<1> + bbodyrad<2>
------------------------------------------------------------
Parameters  : value         Lower 90%    Upper 90%
kT1 [keV]   : 0.101956        (-0.101956      7.77295)
R1^2/D10^2  : 5.04525E+12        (-5.05712e+12      -5.05712e+12)
kT2 [keV]   : 28.3481        (-6.25573      10.3874)
R2^2/D10^2  : 1.55378E-02    (-0.00938406   0.0178357)
------------------------------------------------------------
#Fit statistic : Chi-Squared =          67.46 using 59 PHA bins.
# Reduced chi-squared =          1.227 for     55 degrees of freedom
# Null hypothesis probability =   1.208204e-01

Energy  Fluence     90% Error
[keV]   [erg/cm2]   [erg/cm2]
15- 25  2.021e-09   3.245e+06
25- 50  1.217e-08   2.757e+07
50-150  7.049e-08   6.715e+08
15-150  8.468e-08   7.025e+08
Pre-slew spectrum (Pre-slew PHA with pre-slew DRM)
Power-law model

Spectral model in power-law:
------------------------------------------------------------
Parameters  : value       lower 90%   higher 90%
Photon index: 0.862905     ( -0.229147   0.216822 )
Norm@50keV  : 1.74630E-03    ( -0.000230597   0.00022735 )
------------------------------------------------------------
#Fit statistic : Chi-Squared =          50.34 using 59 PHA bins.
# Reduced chi-squared =         0.8832 for     57 degrees of freedom
# Null hypothesis probability =   7.211837e-01

Photon flux (15-150 keV)    in 58.19 sec: 0.200432 ( -0.0260307  0.0262019 ) ph/cm2/s
Energy fluence (15-150 keV)             : 1.15721e-06 ( -1.49407e-07  1.50133e-07 ) ergs/cm2
Cutoff power-law model

Spectral model in the cutoff power-law:
------------------------------------------------------------
Parameters  : value       lower 90%   higher 90%
Photon index: -6.80790E-02     ( -1.36644   0.98807 )
Epeak [keV] : 137.268      ( -46.1722 -137.263 )
Norm@50keV  : 4.15178E-03    ( -0.00204431   0.00902579 )
------------------------------------------------------------
#Fit statistic : Chi-Squared =          47.85 using 59 PHA bins.
# Reduced chi-squared =         0.8545 for     56 degrees of freedom
# Null hypothesis probability =   7.723956e-01

Photon flux (15-150 keV)    in 58.19 sec: 0.191504 ( -0.028097  0.028022 ) ph/cm2/s
Energy fluence (15-150 keV)             : 1.1161e-06 ( -1.61786e-07  1.59609e-07 ) ergs/cm2
Band function

Spectral model in the Band function:
------------------------------------------------------------
Parameters  : value       lower 90%   higher 90%
alpha       : 6.70215E-02   ( -0.920689   1.16836 )
beta        : -10.0000    ( 10   1.06581e-14 )
Epeak [keV] : 137.332      ( -31.9684 356.717 )
Norm@50keV   : 4.14827E-03    ( -0.00245934   0.00902393 )
------------------------------------------------------------
#Fit statistic : Chi-Squared =          47.85 using 59 PHA bins.
# Reduced chi-squared =         0.8701 for     55 degrees of freedom
# Null hypothesis probability =   7.418314e-01

Photon flux (15-150 keV)    in 58.19 sec:  (    ) ph/cm2/s
Energy fluence (15-150 keV)             : 0 ( 0  0 ) ergs/cm2
S(25-50 keV) vs. S(50-100 keV) plot

S(25-50 keV)  = 2.70e-07
S(50-100 keV) = 5.40e-07
T90 vs. Hardness ratio plot
T90                                   = 96.8160000443459 sec.
Hardness ratio (energy fluence ratio) = 2
Color vs. Color plot

Count Ratio  (25-50 keV) / (15-25 keV) = 0.991245
Count Ratio (50-100 keV) / (15-25 keV) = 1.84514
Mask shadow pattern
IMX = 6.836518183555379E-02, IMY = -5.329999211614854E-01
TIME vs. PHA plot around the trigger time

TIME vs. DetID plot around the trigger time

100 us light curve (15-350 keV)

Spacecraft aspect plot

Bright source in the pre-burst/pre-slew/post-slew images
Pre-burst image of 15-350 keV band
Time interval of the image:
-239.592000 -8.280000

# RAcent  DECcent POSerr Theta    Phi  PeakCts   SNR AngSep     Name
#  [deg]    [deg]    ['] [deg]  [deg]                   [']
196.6204  71.9814    2.7  46.1  139.1   3.2029   4.3 ------	UNKNOWN
Pre-slew background subtracted image of 15-350 keV band
Time interval of the image:
-8.280000 49.908590

# RAcent  DECcent POSerr Theta    Phi  PeakCts   SNR AngSep     Name
#  [deg]    [deg]    ['] [deg]  [deg]                   [']
144.4731  44.2622    0.9  28.3   82.7   1.7514  12.7 ------	UNKNOWN
181.6487   1.7540    2.1  27.2  -69.7   0.5959   5.4 ------	UNKNOWN
151.2967 -20.5758    2.3  52.7  -24.8   1.3054   5.0 ------	UNKNOWN
149.3349 -22.0792    2.1  54.8  -23.6   1.6362   5.5 ------	UNKNOWN
Post-slew image of 15-350 keV band
Time interval of the image:
99.708580 720.508620

# RAcent  DECcent POSerr Theta    Phi  PeakCts   SNR AngSep     Name
#  [deg]    [deg]    ['] [deg]  [deg]                   [']
206.3526  76.0735    2.7  40.7  172.9   2.4521   4.2 ------	UNKNOWN
145.1234  31.7362    2.7  12.5  -28.8   1.4402   4.2 ------	UNKNOWN
Plot creation:
Wed Jun 10 13:03:10 EDT 2015