Click here for the BAT GCN circular template
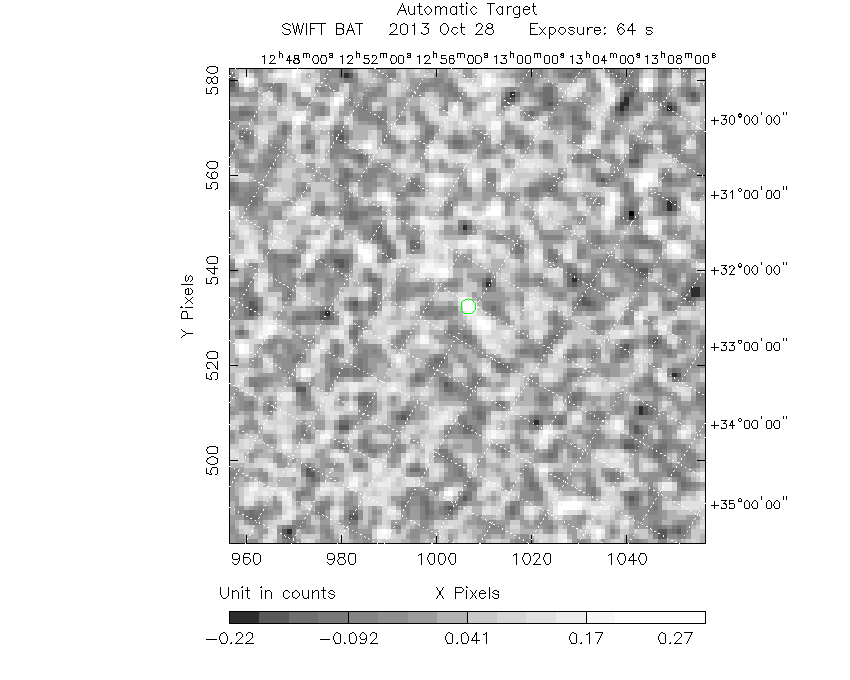
Image
Pre-slew 15-350 keV image (Event data; bkg subtracted)
#   RAcent  DECcent POSerr  Theta    Phi     Peak Cts     SNR  Name
  188.9058 +27.8495 0.0540   16.3 -156.3       0.2679     3.6  TRIG_00576064
------------------------------------------

Foreground time interval of the image:
  0.000  64.000 (delta_t =  64.000 [sec])
Background time interval of the image:
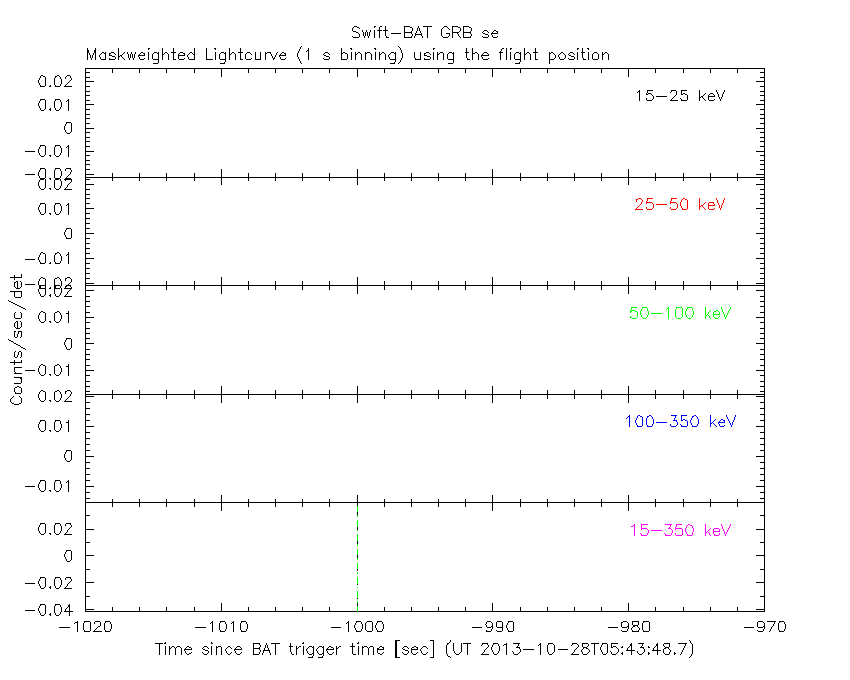
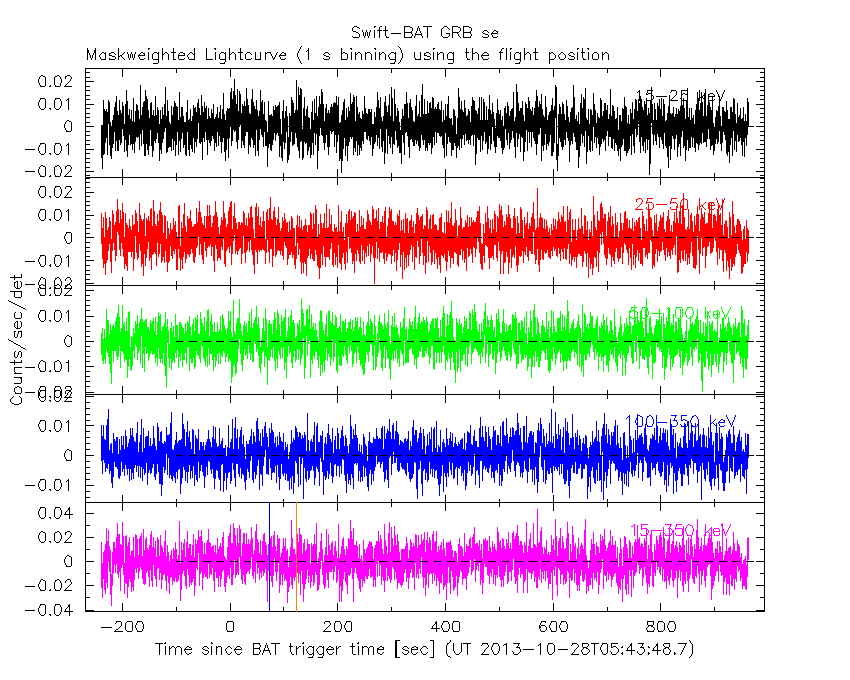
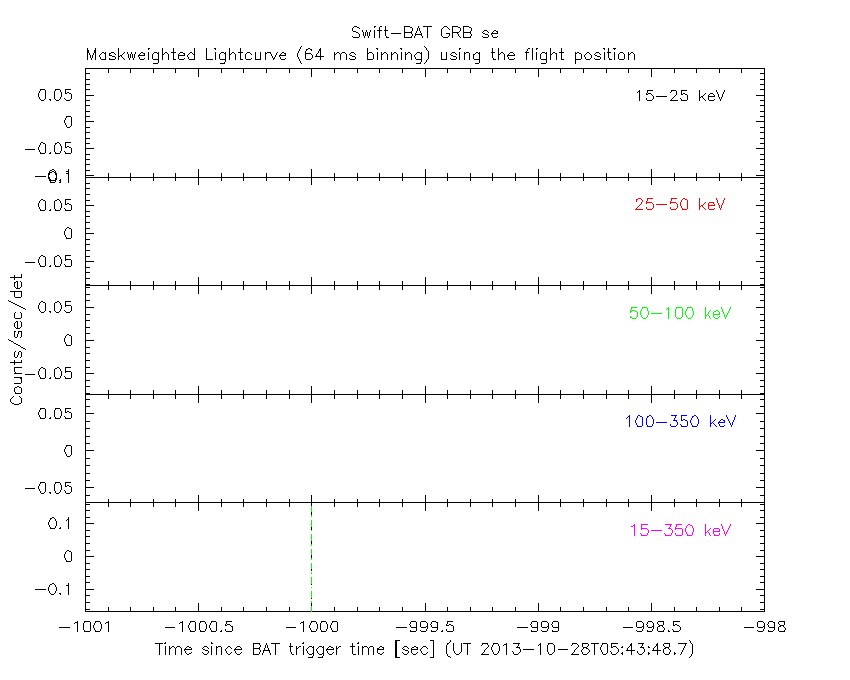
Lightcurves
Notes:
- 1) All plots contain as much data as has been downloaded to date.
- 2) The mask-weighted light curves are using the flight position.
- 3) Multiple plots of different time binning/intervals are shown to cover all scenarios of short/long GRBs, rate/image triggers, and real/false positives.
- 4) For all the mask-weighted lightcurves, the y-axis units are counts/sec/det where a det is 0.4 x 0.4 = 0.16 sq cm.
- 5) The verticle lines correspond to following: green dotted lines are T50 interval, black dotted lines are T90 interval, blue solid line(s) is a spacecraft slew start time, and orange solid line(s) is a spacecraft slew end time.
- 6) Time of each bin is in the middle of the bin.
1 s binning
From T0-310 s to T0+310 s

From T100_start - 20 s to T100_end + 30 s
Full time interval
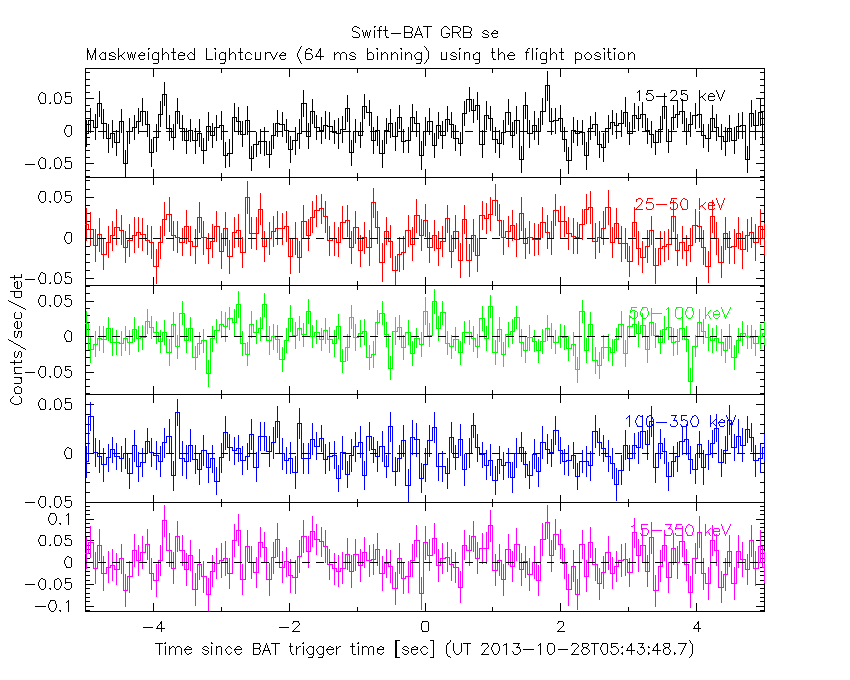
64 ms binning
Full time interval

From T100_start to T100_end
From T0-5 sec to T0+5 sec
16 ms binning
From T100_start-5 s to T100_start+5 s

Blue+Cyan dotted lines: Time interval of the scaled map
From 0.000000 to 64.000000
8 ms binning
From T100_start-3 s to T100_start+3 s

Blue+Cyan dotted lines: Time interval of the scaled map
From 0.000000 to 64.000000
2 ms binning
From T100_start-1 s to T100_start+1 s
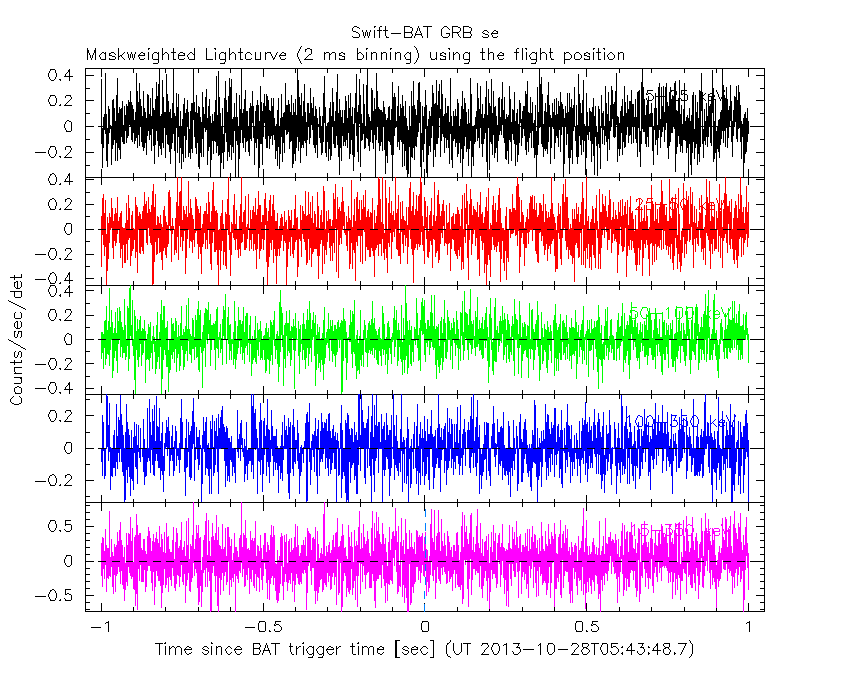
Blue+Cyan dotted lines: Time interval of the scaled map
From 0.000000 to 64.000000
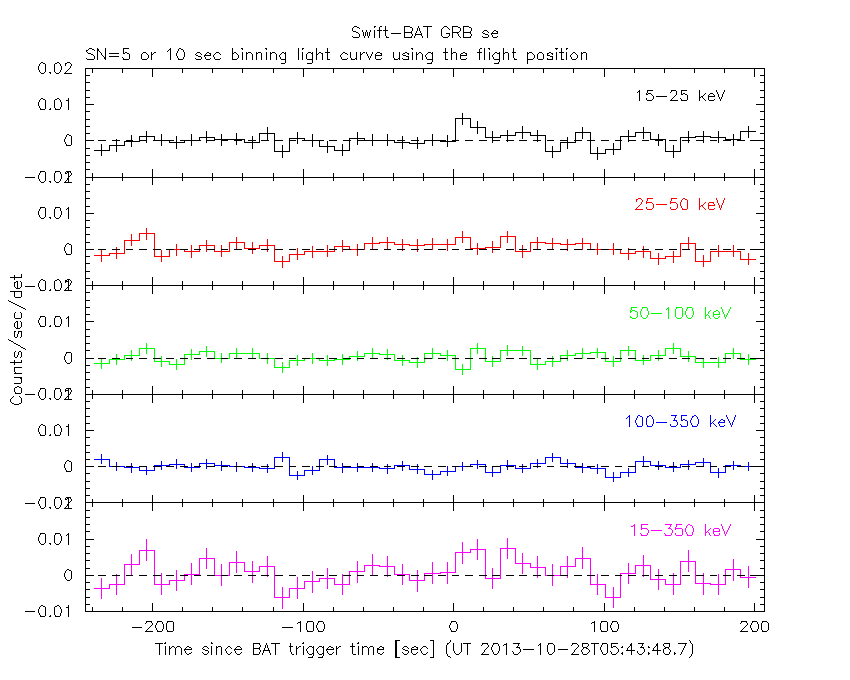
SN=5 or 10 sec. binning (whichever binning is satisfied first)

SN=5 or 10 sec. binning (T < 200 sec)
The mask-weighted light curves based on cleaned DPHs

Spectra
Notes:
- 1) The fitting includes the systematic errors.
- 2) For long bursts, a spectral fit of the pre-slew DRM will introduce some errors in both a spectral shape and a normalization if the PHA file contains a lot of the slew/post-slew time interval.
- 3) For fits to more complicated models (e.g. a power-law over a cutoff power-law), the BAT team has decided to require a chi-square improvement of more than 6 for each extra dof.
- 4) For short bursts (T90<1sec), the specrtum is also fit with Blackbody, OTTB, and Double Blackbody.
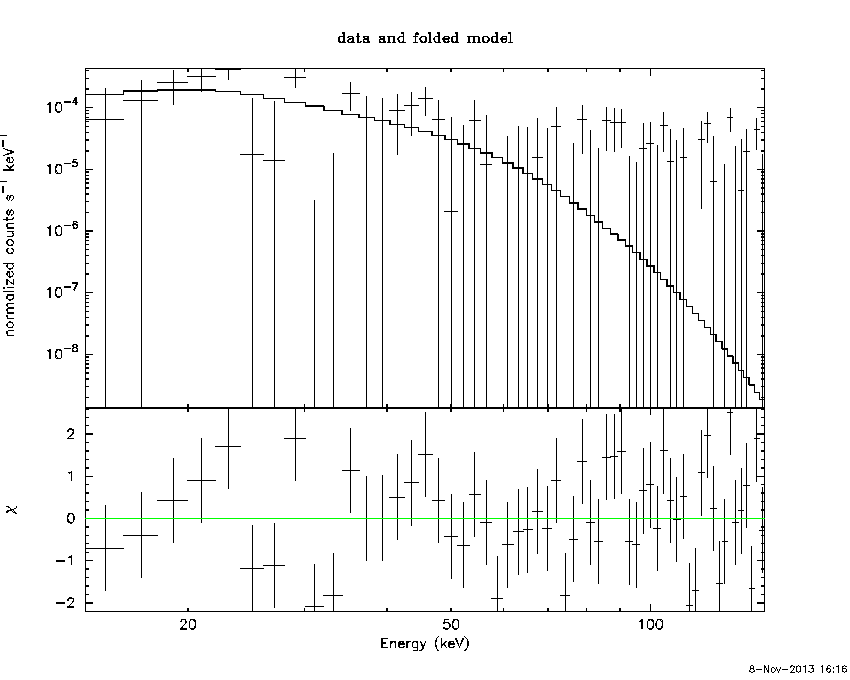
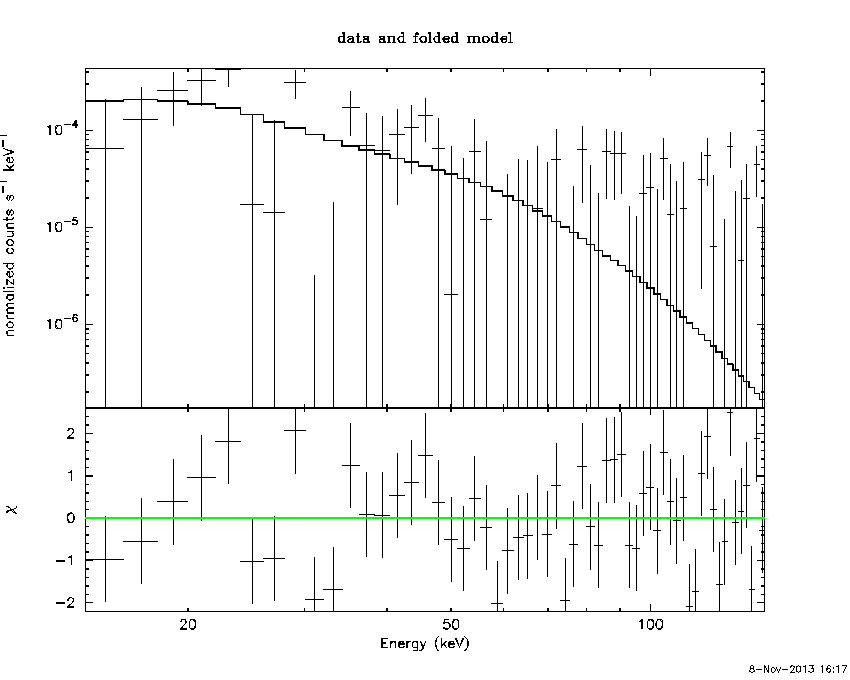
Time averaged spectrum fit using the pre-slew DRM
Power-law model

Time interval is from    0.000 sec. to   64.000 sec.

Spectral model in power-law:
------------------------------------------------------------
Parameters  : value       lower 90%   higher 90%
Photon index: 2.09605     ( -0.679464   0.835462 )
Norm@50keV  : 2.38113E-04    ( -0.000127463   0.000125147 )
------------------------------------------------------------
#Fit statistic : Chi-Squared =          75.79 using 59 PHA bins.
# Reduced chi-squared =          1.330 for     57 degrees of freedom
# Null hypothesis probability =   4.864922e-02

Photon flux (15-150 keV)    in 64 sec: 3.73884E-02 ( -0.0139978  0.014022 ) ph/cm2/s
Energy fluence (15-150 keV)             : 1.41537e-07 ( -6.44934e-08  7.33472e-08 ) ergs/cm2
Cutoff power-law model
Time interval is from    0.000 sec. to   64.000 sec.
Spectral model in the cutoff power-law:
------------------------------------------------------------
Parameters  : value       lower 90%   higher 90%
Photon index: -0.641151     ( -8.18627   2.79315 )
Epeak [keV] : 29.9469      (   )
Norm@50keV  : 1.78523E-02    (     )
------------------------------------------------------------
#Fit statistic : Chi-Squared =          74.86 using 59 PHA bins.
# Reduced chi-squared =          1.337 for     56 degrees of freedom
# Null hypothesis probability =   4.694561e-02

Photon flux (15-150 keV)    in 64 sec: 3.49152E-02 ( -0.0129844  0.0134921 ) ph/cm2/s
Energy fluence (15-150 keV)             : 1.0312e-07 ( -4.2433e-08  9.57203e-08 ) ergs/cm2
Band function

Time interval is from    0.000 sec. to   64.000 sec.

Spectral model in the Band function:
------------------------------------------------------------
Parameters  : value       lower 90%   higher 90%
alpha       : 5.00000   ( -5   -5 )
beta        : -2.64058    ( 2.64142   0.985339 )
Epeak [keV] : 23.5739      ( -23.5691 9.05988 )
Norm@50keV   : 72.4949    ( -25.8497   547468 )
------------------------------------------------------------
#Fit statistic : Chi-Squared =          74.08 using 59 PHA bins.
# Reduced chi-squared =          1.347 for     55 degrees of freedom
# Null hypothesis probability =   4.406128e-02

Photon flux (15-150 keV)    in 64 sec:  (    ) ph/cm2/s
Energy fluence (15-150 keV)             : 0 ( 0  0 ) ergs/cm2
Single BB

Spectral model blackbody:
------------------------------------------------------------
Parameters  : value    Lower 90%  Upper 90%
kT [keV]    : 7.73117  (-2.43883  3.41214)
R^2/D10^2   : 4.97883E-02  (-0.0497883   0.175687)
(R is the radius in km and D10 is the distance to the source in units of 10 kpc)
------------------------------------------------------------
#Fit statistic : Chi-Squared =          74.85 using 59 PHA bins.
# Reduced chi-squared =          1.313 for     57 degrees of freedom
# Null hypothesis probability =   5.656215e-02

Energy  Fluence     90% Error
[keV]   [erg/cm2]   [erg/cm2]
15- 25  3.354e-08   2.136e-08
25- 50  5.527e-08   3.517e-08
50-150  1.295e-08   1.083e-08
15-150  1.018e-07   6.477e-08
Thermal bremsstrahlung (OTTB)

Spectral model: thermal bremsstrahlung
------------------------------------------------------------
Parameters  : value         Lower 90%    Upper 90%
kT [keV]    : 43.3354       (-26.2437      -43.3354)
Norm        : 0.231900       (-0.117109     0.276298)
------------------------------------------------------------
#Fit statistic : Chi-Squared =          75.41 using 59 PHA bins.
# Reduced chi-squared =          1.323 for     57 degrees of freedom
# Null hypothesis probability =   5.171909e-02

Energy  Fluence     90% Error
[keV]   [erg/cm2]   [erg/cm2]
15- 25  3.495e-08   2.335e-08
25- 50  4.755e-08   3.054e-08
50-150  4.007e-08   3.315e-08
15-150  1.226e-07   8.275e-08
Double BB

------------------------------------------------------------
Parameters  : value         Lower 90%    Upper 90%
kT1 [keV]   : 199.359        (      )
R1^2/D10^2  : 2.80453E-06        (-3.09103e-06      0.000386525)
kT2 [keV]   : 7.23925        (-2.46062      3.18297)
R2^2/D10^2  : 6.15848E-02    (-0.0481616   0.299044)
------------------------------------------------------------
#Fit statistic : Chi-Squared =          74.81 using 59 PHA bins.
#Fit statistic : Chi-Squared =          73.71 using 59 PHA bins.
# Reduced chi-squared =          1.360 for     55 degrees of freedom
# Reduced chi-squared =          1.340 for     55 degrees of freedom
# Null hypothesis probability =   3.899172e-02
# Null hypothesis probability =   4.685750e-02

Energy  Fluence     90% Error
[keV]   [erg/cm2]   [erg/cm2]
15- 25  3.433e-08   1.936e-07
25- 50  5.401e-08   7.229e-07
50-150  1.560e-08   9.149e-07
15-150  1.039e-07   1.266e-06
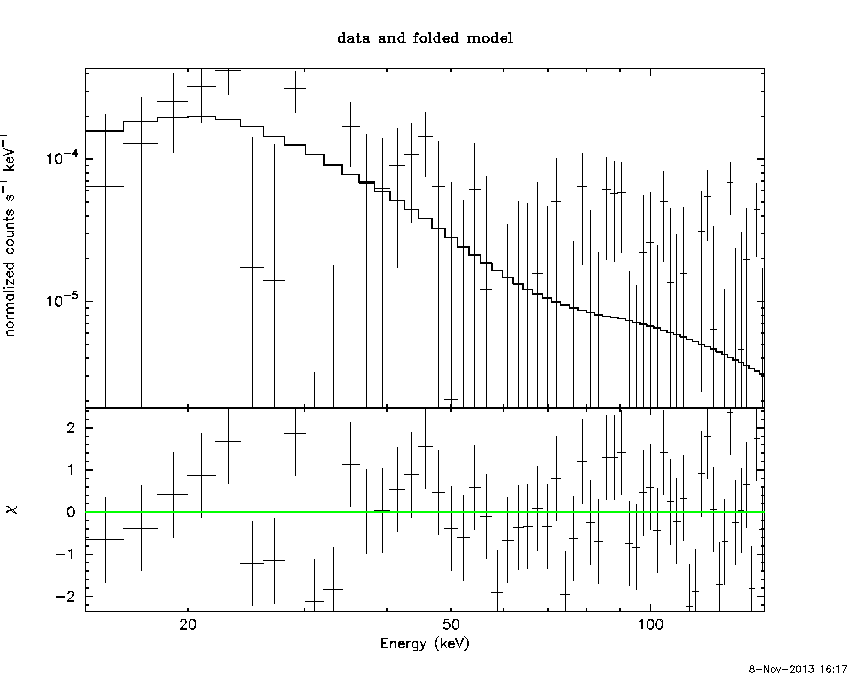
Peak spectrum fit
Power-law model

Time interval is from    0.000 sec. to   64.000 sec.

Spectral model in power-law:
------------------------------------------------------------
Parameters  : value       lower 90%   higher 90%
Photon index: 2.09605     ( -0.679464   0.835462 )
Norm@50keV  : 2.38113E-04    ( -0.000127463   0.000125147 )
------------------------------------------------------------
#Fit statistic : Chi-Squared =          75.79 using 59 PHA bins.
# Reduced chi-squared =          1.330 for     57 degrees of freedom
# Null hypothesis probability =   4.864922e-02

Photon flux (15-150 keV)    in 64 sec: 3.73884E-02 ( -0.0139978  0.014022 ) ph/cm2/s
Energy fluence (15-150 keV)             : 1.41537e-07 ( -6.44934e-08  7.33472e-08 ) ergs/cm2
Cutoff power-law model

Time interval is from    0.000 sec. to   64.000 sec.
Spectral model in the cutoff power-law:
------------------------------------------------------------
Parameters  : value       lower 90%   higher 90%
Photon index: -0.641151     ( -8.18627   2.79315 )
Epeak [keV] : 29.9469      (   )
Norm@50keV  : 1.78523E-02    (     )
------------------------------------------------------------
#Fit statistic : Chi-Squared =          74.86 using 59 PHA bins.
# Reduced chi-squared =          1.337 for     56 degrees of freedom
# Null hypothesis probability =   4.694561e-02

Photon flux (15-150 keV)    in 64 sec: 3.49152E-02 ( -0.0129844  0.0134921 ) ph/cm2/s
Energy fluence (15-150 keV)             : 1.0312e-07 ( -4.2433e-08  9.57203e-08 ) ergs/cm2
Band function

Time interval is from    0.000 sec. to   64.000 sec.

Spectral model in the Band function:
------------------------------------------------------------
Parameters  : value       lower 90%   higher 90%
alpha       : 5.00000   ( -5   -5 )
beta        : -2.64058    ( 2.64142   0.985339 )
Epeak [keV] : 23.5739      ( -23.5691 9.05988 )
Norm@50keV   : 72.4949    ( -25.8497   547468 )
------------------------------------------------------------
#Fit statistic : Chi-Squared =          74.08 using 59 PHA bins.
# Reduced chi-squared =          1.347 for     55 degrees of freedom
# Null hypothesis probability =   4.406128e-02

Photon flux (15-150 keV)    in 64 sec:  (    ) ph/cm2/s
Energy fluence (15-150 keV)             : 0 ( 0  0 ) ergs/cm2
Single BB

Spectral model blackbody:
------------------------------------------------------------
Parameters  : value    Lower 90%  Upper 90%
kT [keV]    : 7.73117  (-2.43883  3.41214)
R^2/D10^2   : 4.97883E-02  (-0.0497883   0.175687)
(R is the radius in km and D10 is the distance to the source in units of 10 kpc)
------------------------------------------------------------
#Fit statistic : Chi-Squared =          74.85 using 59 PHA bins.
# Reduced chi-squared =          1.313 for     57 degrees of freedom
# Null hypothesis probability =   5.656215e-02

Energy  Fluence     90% Error
[keV]   [erg/cm2]   [erg/cm2]
15- 25  3.354e-08   2.084e-08
25- 50  5.527e-08   3.574e-08
50-150  1.295e-08   1.120e-08
15-150  1.018e-07   6.646e-08
Thermal bremsstrahlung (OTTB)
Spectral model: thermal bremsstrahlung
------------------------------------------------------------
Parameters  : value         Lower 90%    Upper 90%
kT [keV]    : 43.3354       (-26.2437      -43.3354)
Norm        : 0.231900       (-0.117109     0.276298)
------------------------------------------------------------
#Fit statistic : Chi-Squared =          75.41 using 59 PHA bins.
# Reduced chi-squared =          1.323 for     57 degrees of freedom
# Null hypothesis probability =   5.171909e-02

Energy  Fluence     90% Error
[keV]   [erg/cm2]   [erg/cm2]
15- 25  3.495e-08   2.250e-08
25- 50  4.755e-08   3.101e-08
50-150  4.007e-08   3.213e-08
15-150  1.226e-07   8.458e-08
Double BB
------------------------------------------------------------
Parameters  : value         Lower 90%    Upper 90%
kT1 [keV]   : 199.359        (      )
R1^2/D10^2  : 2.80453E-06        (-3.09103e-06      0.000386276)
kT2 [keV]   : 7.23925        (-2.46062      3.18297)
R2^2/D10^2  : 6.15848E-02    (-0.0481355   0.322797)
------------------------------------------------------------
#Fit statistic : Chi-Squared =          74.81 using 59 PHA bins.
#Fit statistic : Chi-Squared =          73.71 using 59 PHA bins.
# Reduced chi-squared =          1.360 for     55 degrees of freedom
# Reduced chi-squared =          1.340 for     55 degrees of freedom
# Null hypothesis probability =   3.899172e-02
# Null hypothesis probability =   4.685750e-02

Energy  Fluence     90% Error
[keV]   [erg/cm2]   [erg/cm2]
15- 25  3.433e-08   2.198e-07
25- 50  5.401e-08   5.802e-07
50-150  1.560e-08   3.510e-07
15-150  1.039e-07   2.052e-06
Pre-slew spectrum (Pre-slew PHA with pre-slew DRM)
Power-law model

Spectral model in power-law:
------------------------------------------------------------
Parameters  : value       lower 90%   higher 90%
Photon index: 2.09605     ( -0.679464   0.835462 )
Norm@50keV  : 2.38113E-04    ( -0.000127463   0.000125147 )
------------------------------------------------------------
#Fit statistic : Chi-Squared =          75.79 using 59 PHA bins.
# Reduced chi-squared =          1.330 for     57 degrees of freedom
# Null hypothesis probability =   4.864922e-02

Photon flux (15-150 keV)    in 64 sec: 3.73884E-02 ( -0.0139978  0.014022 ) ph/cm2/s
Energy fluence (15-150 keV)             : 1.41537e-07 ( -6.44934e-08  7.33472e-08 ) ergs/cm2
Cutoff power-law model

Spectral model in the cutoff power-law:
------------------------------------------------------------
Parameters  : value       lower 90%   higher 90%
Photon index: -0.641151     ( -8.18627   2.79315 )
Epeak [keV] : 29.9469      (   )
Norm@50keV  : 1.78523E-02    (     )
------------------------------------------------------------
#Fit statistic : Chi-Squared =          74.86 using 59 PHA bins.
# Reduced chi-squared =          1.337 for     56 degrees of freedom
# Null hypothesis probability =   4.694561e-02

Photon flux (15-150 keV)    in 64 sec: 3.49152E-02 ( -0.0129844  0.0134921 ) ph/cm2/s
Energy fluence (15-150 keV)             : 1.0312e-07 ( -4.2433e-08  9.57203e-08 ) ergs/cm2
Band function

Spectral model in the Band function:
------------------------------------------------------------
Parameters  : value       lower 90%   higher 90%
alpha       : 5.00000   ( -5   -5 )
beta        : -2.64058    ( 2.64142   0.985339 )
Epeak [keV] : 23.5739      ( -23.5691 9.05988 )
Norm@50keV   : 72.4949    ( -25.8497   547468 )
------------------------------------------------------------
#Fit statistic : Chi-Squared =          74.08 using 59 PHA bins.
# Reduced chi-squared =          1.347 for     55 degrees of freedom
# Null hypothesis probability =   4.406128e-02

Photon flux (15-150 keV)    in 64 sec:  (    ) ph/cm2/s
Energy fluence (15-150 keV)             : 0 ( 0  0 ) ergs/cm2
S(25-50 keV) vs. S(50-100 keV) plot
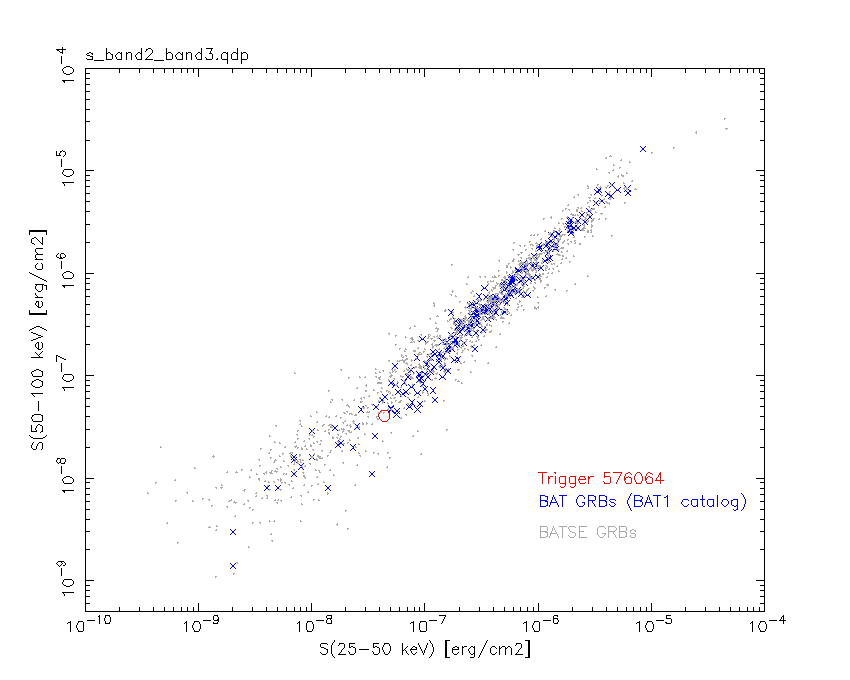
S(25-50 keV)  = 4.37453e-08
S(50-100 keV) = 4.09287e-08
T90 vs. Hardness ratio plot
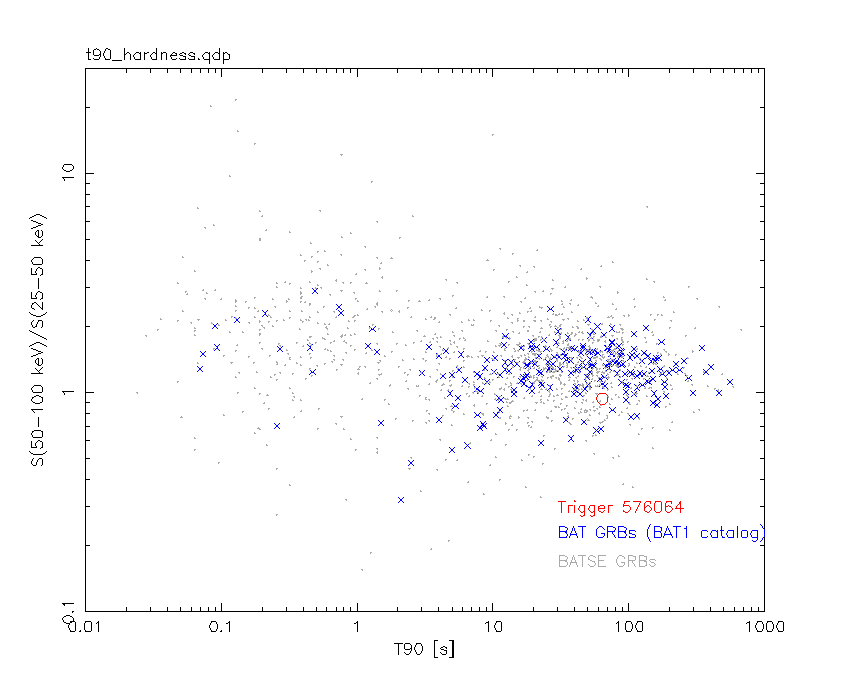
T90                                   = 64 sec.
Hardness ratio (energy fluence ratio) = 0.935614
Color vs. Color plot

Count Ratio  (25-50 keV) / (15-25 keV) = 0.592548
Count Ratio (50-100 keV) / (15-25 keV) = 0.107806
Mask shadow pattern

IMX = -2.669765312934396E-01, IMY = 1.171922632888540E-01
TIME vs. PHA plot around the trigger time

Blue+Cyan dotted lines: Time interval of the scaled map
From 0.000000 to 64.000000
TIME vs. DetID plot around the trigger time

Blue+Cyan dotted lines: Time interval of the scaled map
From 0.000000 to 64.000000
100 us light curve (15-350 keV)
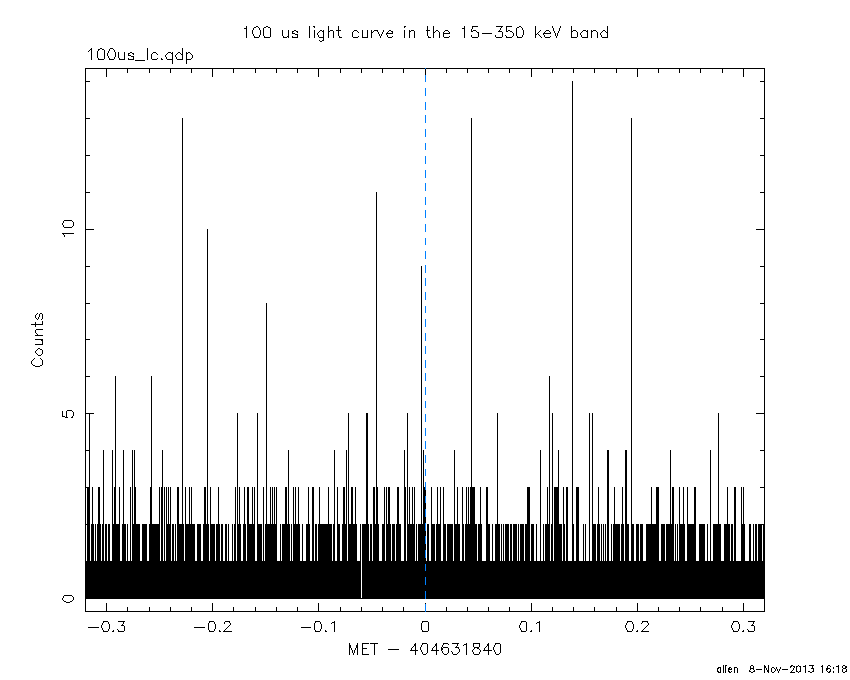
Blue+Cyan dotted lines: Time interval of the scaled map
From 0.000000 to 64.000000
Spacecraft aspect plot

Bright source in the pre-burst/pre-slew/post-slew images
Pre-burst image of 15-350 keV band
Time interval of the image:
Pre-slew background subtracted image of 15-350 keV band
Time interval of the image:
0.000000 64.000000

# RAcent  DECcent POSerr Theta    Phi  PeakCts   SNR AngSep     Name
#  [deg]    [deg]    ['] [deg]  [deg]                   [']
143.1369  16.2892    2.5  30.5   66.7   0.6340   4.7 ------	UNKNOWN
206.7581  55.7069    2.2  44.9  179.4   0.7405   5.2 ------	UNKNOWN
179.6343  26.7448    2.6   9.9  178.9   0.3236   4.5 ------	UNKNOWN
221.6825  35.8318    2.8  44.9 -148.7   0.6400   4.2 ------	UNKNOWN
176.0135 -34.9519    1.7  52.7  -26.4   1.6330   6.9 ------	UNKNOWN
190.3124 -22.4675    2.4  42.9  -46.3   0.8670   4.8 ------	UNKNOWN
Post-slew image of 15-350 keV band
Time interval of the image:
124.300590 963.054200

# RAcent  DECcent POSerr Theta    Phi  PeakCts   SNR AngSep     Name
#  [deg]    [deg]    ['] [deg]  [deg]                   [']
254.4380  35.4291   11.5  55.3 -172.9  -1.7428  -1.0    5.3	Her X-1
176.1305  31.9210    2.5  11.8   55.9   1.8716   4.6 ------	UNKNOWN
144.3071  -2.0704    3.1  52.2    5.2   4.5069   3.7 ------	UNKNOWN
244.8302  40.5496    3.1  47.2 -178.2   3.2225   3.8 ------	UNKNOWN
166.5308   1.3295    3.0  34.1  -14.6   1.9704   3.8 ------	UNKNOWN
234.0036   6.0756    2.4  47.9 -129.0   9.6785   4.7 ------	UNKNOWN
Plot creation:
Fri Nov  8 16:19:00 EST 2013