Special notes of this burst
Image
Pre-slew 15.0-350.0 keV image (Event data)

#   RAcent    DECcent   POSerr    Theta     Phi              Peak Cts       SNR   Name
  345.0743    -5.3791   0.0027    32.5726   132.5131        31.5073645     72.082 TRIG_00576238

Foreground time interval of the image:
 -5.504  12.085 (delta_t =  17.589 [sec])
Background time interval of the image:
-184.915  -5.504 (delta_t = 179.411 [sec])
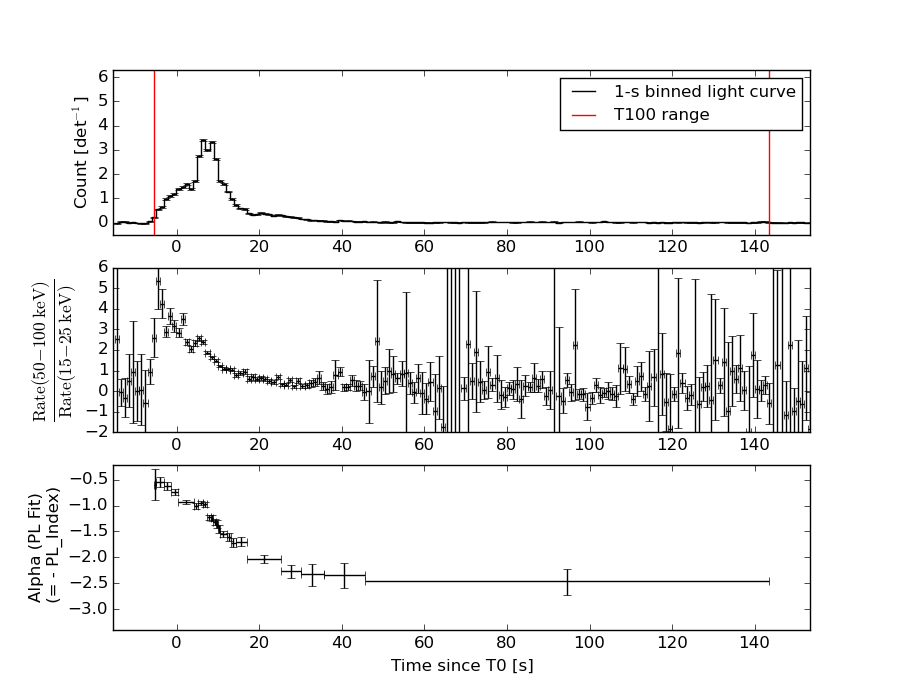
Lightcurves
Notes:
- 1) The mask-weighted light curves are using the flight position.
- 2) Multiple plots of different time binning/intervals are shown to cover all scenarios of short/long GRBs, rate/image triggers, and real/false positives.
- 3) For all the mask-weighted lightcurves, the y-axis units are counts/sec/det where a det is 0.4 x 0.4 = 0.16 sq cm.
- 4) The verticle lines correspond to following: green dotted lines are T50 interval, black dotted lines are T90 interval, blue solid line(s) is a spacecraft slew start time, and orange solid line(s) is a spacecraft slew end time.
- 5) Time of each bin is in the middle of the bin.
1 s binning
From T0-310 s to T0+310 s

From T100_start - 20 s to T100_end + 30 s

Full time interval
64 ms binning
Full time interval

From T100_start to T100_end

From T0-5 sec to T0+5 sec

16 ms binning
From T100_start-5 s to T100_start+5 s

Blue+Cyan dotted lines: Time interval of the scaled map
From 0.000000 to 1.024000
8 ms binning
From T100_start-3 s to T100_start+3 s

Blue+Cyan dotted lines: Time interval of the scaled map
From 0.000000 to 1.024000
2 ms binning
From T100_start-1 s to T100_start+1 s

Blue+Cyan dotted lines: Time interval of the scaled map
From 0.000000 to 1.024000
SN=5 or 10 sec. binning (whichever binning is satisfied first)

SN=5 or 10 sec. binning (T < 200 sec)
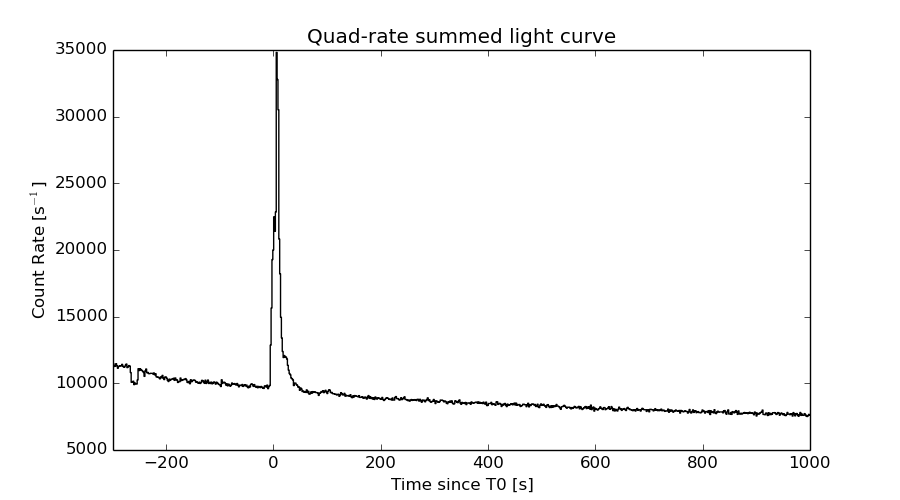
Quad-rate summed light curves (from T0-300s to T0+1000s)
The mask-weighted light curves based on cleaned DPHs

Spectral Evolution
Spectra
Notes:
- 1) The fitting includes the systematic errors.
- 2) When the burst includes telescope slew time periods, the fitting uses an average response file made from multiple 5-s response files through out the slew time plus single time preiod for the non-slew times, and weighted by the total counts in the corresponding time period using addrmf. An average response file is needed becuase a spectral fit using the pre-slew DRM will introduce some errors in both a spectral shape and a normalization if the PHA file contains a lot of the slew/post-slew time interval.
- 3) For fits to more complicated models (e.g. a power-law over a cutoff power-law), the BAT team has decided to require a chi-square improvement of more than 6 for each extra dof.
Time averaged spectrum fit using the average DRM
Power-law model
Time interval is from   -5.504 sec. to  143.368 sec.

Spectral model in power-law:
------------------------------------------------------------
Parameters  : value       lower 90%   higher 90%
Photon index: 1.29237     ( -0.0270263   0.0269513 )
Norm@50keV  : 1.97692E-02    ( -0.000291084   0.000290653 )
------------------------------------------------------------
#Fit statistic : Chi-Squared =          36.43 using 59 PHA bins.
# Reduced chi-squared =         0.6391 for     57 degrees of freedom
# Null hypothesis probability =   9.845989e-01

Photon flux (15-150 keV)    in 148.9 sec: 2.35524 ( -0.0398744  0.0400134 ) ph/cm2/s
Energy fluence (15-150 keV)             : 2.9143e-05 ( -4.08253e-07  4.08285e-07 ) ergs/cm2
Cutoff power-law model

Time interval is from   -5.504 sec. to  143.368 sec.
Spectral model in the cutoff power-law:
------------------------------------------------------------
Parameters  : value       lower 90%   higher 90%
Photon index: 1.16190     ( -0.112743   0.110075 )
Epeak [keV] : 404.562      ( -156.46 1542.23 )
Norm@50keV  : 2.22737E-02    ( -0.0020841   0.00236119 )
------------------------------------------------------------
#Fit statistic : Chi-Squared =          32.37 using 59 PHA bins.
# Reduced chi-squared =         0.5780 for     56 degrees of freedom
# Null hypothesis probability =   9.952403e-01

Photon flux (15-150 keV)    in 148.9 sec: 2.32813 ( -0.04518  0.04548 ) ph/cm2/s
Energy fluence (15-150 keV)             : 2.90035e-05 ( -4.29428e-07  4.28534e-07 ) ergs/cm2
Band function

Time interval is from   -5.504 sec. to  143.368 sec.

Spectral model in the Band function:
------------------------------------------------------------
Parameters  : value       lower 90%   higher 90%
alpha       : -1.16190   ( 0.840035   5.57435 )
beta        : -10.00000    ( 10   20 )
Epeak [keV] : 404.508      ( -126.788 1540.5 )
Norm@50keV   : 2.22710E-02    ( -0.000309314   0.0023534 )
------------------------------------------------------------
#Fit statistic : Chi-Squared =          32.37 using 59 PHA bins.
# Reduced chi-squared =         0.5885 for     55 degrees of freedom
# Null hypothesis probability =   9.935923e-01

Photon flux (15-150 keV)    in 148.9 sec:  (    ) ph/cm2/s
Energy fluence (15-150 keV)             : 0 ( 0  0 ) ergs/cm2
Single BB

Spectral model blackbody:
------------------------------------------------------------
Parameters  : value    Lower 90%  Upper 90%
kT [keV]    : 21.4772  (  )
R^2/D10^2   : 8.08852E-02  (   )
(R is the radius in km and D10 is the distance to the source in units of 10 kpc)
------------------------------------------------------------
#Fit statistic : Chi-Squared =         910.14 using 59 PHA bins.
# Reduced chi-squared =         15.967 for     57 degrees of freedom
# Null hypothesis probability =  5.388604e-154

Energy  Fluence     90% Error
[keV]   [erg/cm2]   [erg/cm2]
15- 25  1.039e-06   3.417e-08
25- 50  5.417e-06   1.295e-07
50-150  1.865e-05   3.499e-07
15-150  2.511e-05   3.946e-07
Thermal bremsstrahlung (OTTB)
Spectral model: thermal bremsstrahlung
------------------------------------------------------------
Parameters  : value         Lower 90%    Upper 90%
kT [keV]    : 199.363       (      )
Norm        : 10.3186       (     )
------------------------------------------------------------
#Fit statistic : Chi-Squared =         428.23 using 59 PHA bins.
# Reduced chi-squared =         7.5128 for     57 degrees of freedom
# Null hypothesis probability =   2.539502e-58

Energy  Fluence     90% Error
[keV]   [erg/cm2]   [erg/cm2]
15- 25  3.826e-06   7.296e-08
25- 50  7.360e-06   1.251e-07
50-150  1.614e-05   2.755e-07
15-150  2.733e-05   4.839e-07
Double BB

Spectral model: bbodyrad<1> + bbodyrad<2>
------------------------------------------------------------
Parameters  : value         Lower 90%    Upper 90%
kT1 [keV]   : 8.44437        (-0.53414      0.563669)
R1^2/D10^2  : 1.07907        (-0.207448      0.270262)
kT2 [keV]   : 33.1550        (-1.71574      2.03359)
R2^2/D10^2  : 1.61340E-02    (-0.00296243   0.00326171)
------------------------------------------------------------
#Fit statistic : Chi-Squared =          46.23 using 59 PHA bins.
# Reduced chi-squared =         0.8405 for     55 degrees of freedom
# Null hypothesis probability =   7.941809e-01

Energy  Fluence     90% Error
[keV]   [erg/cm2]   [erg/cm2]
15- 25  2.538e-06   1.519e-07
25- 50  6.611e-06   1.906e-07
50-150  1.973e-05   5.286e-07
15-150  2.888e-05   6.403e-07
Peak spectrum fit
Power-law model

Time interval is from    6.400 sec. to    7.400 sec.

Spectral model in power-law:
------------------------------------------------------------
Parameters  : value       lower 90%   higher 90%
Photon index: 0.959001     ( -0.0450581   0.0448149 )
Norm@50keV  : 0.244432    ( -0.00641878   0.00640943 )
------------------------------------------------------------
#Fit statistic : Chi-Squared =          83.40 using 59 PHA bins.
# Reduced chi-squared =          1.463 for     57 degrees of freedom
# Null hypothesis probability =   1.289297e-02

Photon flux (15-150 keV)    in 1 sec: 28.0911 ( -0.748128  0.748619 ) ph/cm2/s
Energy fluence (15-150 keV)             : 2.68266e-06 ( -7.3729e-08  7.37075e-08 ) ergs/cm2
Cutoff power-law model

Time interval is from    6.400 sec. to    7.400 sec.
Spectral model in the cutoff power-law:
------------------------------------------------------------
Parameters  : value       lower 90%   higher 90%
Photon index: 0.584711     ( -0.190692   0.183153 )
Epeak [keV] : 229.293      ( -56.7641 153.248 )
Norm@50keV  : 0.351735    ( -0.0560478   0.0692424 )
------------------------------------------------------------
#Fit statistic : Chi-Squared =          70.76 using 59 PHA bins.
# Reduced chi-squared =          1.264 for     56 degrees of freedom
# Null hypothesis probability =   8.853009e-02

Photon flux (15-150 keV)    in 1 sec: 27.6834 ( -0.7698  0.7708 ) ph/cm2/s
Energy fluence (15-150 keV)             : 2.65529e-06 ( 0  0 ) ergs/cm2
Band function

Time interval is from    6.400 sec. to    7.400 sec.

Spectral model in the Band function:
------------------------------------------------------------
Parameters  : value       lower 90%   higher 90%
alpha       : -0.883813   ( 0.883763   0.883763 )
beta        : -0.958830    ( -0.0448026   0.0450742 )
Epeak [keV] : 13.1567      (   )
Norm@50keV   : 0.370373    (     )
------------------------------------------------------------
#Fit statistic : Chi-Squared =          83.40 using 59 PHA bins.
# Reduced chi-squared =          1.516 for     55 degrees of freedom
# Null hypothesis probability =   8.039099e-03

Photon flux (15-150 keV)    in 1 sec:  (    ) ph/cm2/s
Energy fluence (15-150 keV)             : 0 ( 0  0 ) ergs/cm2
Single BB
Spectral model blackbody:
------------------------------------------------------------
Parameters  : value    Lower 90%  Upper 90%
kT [keV]    : 23.4800  (  )
R^2/D10^2   : 0.841295  (   )
(R is the radius in km and D10 is the distance to the source in units of 10 kpc)
------------------------------------------------------------
#Fit statistic : Chi-Squared =         266.99 using 59 PHA bins.
# Reduced chi-squared =         4.6841 for     57 degrees of freedom
# Null hypothesis probability =   6.518544e-29

Energy  Fluence     90% Error
[keV]   [erg/cm2]   [erg/cm2]
15- 25  8.321e-08   4.485e-09
25- 50  4.567e-07   1.730e-08
50-150  1.879e-06   6.800e-08
15-150  2.419e-06   7.300e-08
Thermal bremsstrahlung (OTTB)

Spectral model: thermal bremsstrahlung
------------------------------------------------------------
Parameters  : value         Lower 90%    Upper 90%
kT [keV]    : 199.363       (      )
Norm        : 114.783       (     )
------------------------------------------------------------
#Fit statistic : Chi-Squared =         549.60 using 59 PHA bins.
# Reduced chi-squared =         9.6420 for     57 degrees of freedom
# Null hypothesis probability =   1.039176e-81

Energy  Fluence     90% Error
[keV]   [erg/cm2]   [erg/cm2]
15- 25  2.858e-07   7.650e-09
25- 50  5.498e-07   1.440e-08
50-150  1.206e-06   3.350e-08
15-150  2.041e-06   5.700e-08
Double BB
Spectral model: bbodyrad<1> + bbodyrad<2>
------------------------------------------------------------
Parameters  : value         Lower 90%    Upper 90%
kT1 [keV]   : 9.73428        (-1.13418      1.24346)
R1^2/D10^2  : 6.47866        (-1.77551      2.71132)
kT2 [keV]   : 37.4038        (-3.71673      5.27841)
R2^2/D10^2  : 0.168244    (-0.0570161   0.0682316)
------------------------------------------------------------
#Fit statistic : Chi-Squared =          65.44 using 59 PHA bins.
# Reduced chi-squared =          1.190 for     55 degrees of freedom
# Null hypothesis probability =   1.584089e-01

Energy  Fluence     90% Error
[keV]   [erg/cm2]   [erg/cm2]
15- 25  1.557e-07   1.590e-08
25- 50  5.090e-07   4.270e-08
50-150  2.011e-06   1.540e-07
15-150  2.675e-06   1.905e-07
Pre-slew spectrum (Pre-slew PHA with pre-slew DRM)
Power-law model

Spectral model in power-law:
------------------------------------------------------------
Parameters  : value       lower 90%   higher 90%
Photon index: 1.07582     ( -0.0243333   0.024232 )
Norm@50keV  : 0.125838    ( -0.00182517   0.00182144 )
------------------------------------------------------------
#Fit statistic : Chi-Squared =          48.55 using 59 PHA bins.
# Reduced chi-squared =         0.8518 for     57 degrees of freedom
# Null hypothesis probability =   7.795917e-01

Photon flux (15-150 keV)    in 17.59 sec: 14.5641 ( -0.22513  0.225609 ) ph/cm2/s
Energy fluence (15-150 keV)             : 2.33243e-05 ( -3.1088e-07  3.10865e-07 ) ergs/cm2
Cutoff power-law model

Spectral model in the cutoff power-law:
------------------------------------------------------------
Parameters  : value       lower 90%   higher 90%
Photon index: 0.793311     ( -0.105205   0.103005 )
Epeak [keV] : 279.083      ( -57.2563 117.569 )
Norm@50keV  : 0.161732    ( -0.0138525   0.0154064 )
------------------------------------------------------------
#Fit statistic : Chi-Squared =          26.06 using 59 PHA bins.
# Reduced chi-squared =         0.4654 for     56 degrees of freedom
# Null hypothesis probability =   9.997875e-01

Photon flux (15-150 keV)    in 17.59 sec: 14.3095 ( -0.2391  0.2402 ) ph/cm2/s
Energy fluence (15-150 keV)             : 2.32248e-05 ( 0  0 ) ergs/cm2
Band function

Spectral model in the Band function:
------------------------------------------------------------
Parameters  : value       lower 90%   higher 90%
alpha       : -0.541180   ( -0.334809   1.02885 )
beta        : -1.18786    ( 1.18894   0.0665274 )
Epeak [keV] : 142.961      ( -86.8022 229.308 )
Norm@50keV   : 0.220735    ( -0.0675329   0.403043 )
------------------------------------------------------------
#Fit statistic : Chi-Squared =          25.41 using 59 PHA bins.
# Reduced chi-squared =         0.4620 for     55 degrees of freedom
# Null hypothesis probability =   9.997856e-01

Photon flux (15-150 keV)    in 17.59 sec:  (    ) ph/cm2/s
Energy fluence (15-150 keV)             : 0 ( 0  0 ) ergs/cm2
S(25-50 keV) vs. S(50-100 keV) plot

S(25-50 keV)  = 6.46e-06
S(50-100 keV) = 1.05e-05
T90 vs. Hardness ratio plot
T90                                   = 39.4239999651909 sec.
Hardness ratio (energy fluence ratio) = 1.62539
Color vs. Color plot
Count Ratio  (25-50 keV) / (15-25 keV) = 1.55646
Count Ratio (50-100 keV) / (15-25 keV) = 1.44869
Mask shadow pattern

IMX = -4.317096005067170E-01, IMY = -4.709127232910389E-01
TIME vs. PHA plot around the trigger time
Blue+Cyan dotted lines: Time interval of the scaled map
From 0.000000 to 1.024000
TIME vs. DetID plot around the trigger time
Blue+Cyan dotted lines: Time interval of the scaled map
From 0.000000 to 1.024000
100 us light curve (15-350 keV)

Blue+Cyan dotted lines: Time interval of the scaled map
From 0.000000 to 1.024000
Spacecraft aspect plot
Bright source in the pre-burst/pre-slew/post-slew images
Pre-burst image of 15-350 keV band
Time interval of the image:
-184.915400 -5.504000

# RAcent  DECcent POSerr Theta    Phi  PeakCts   SNR AngSep     Name
#  [deg]    [deg]    ['] [deg]  [deg]                   [']
288.7967  10.9656    1.0  29.0  -83.2   3.2781  11.4    1.2	GRS 1915+105
299.7585  35.2146    3.7  27.4  -25.9   0.6775   3.1    8.3	Cyg X-1
308.1193  40.9394    1.4  28.8   -7.6   1.8057   8.2    0.9	Cyg X-3
326.1099  38.4276    3.3  25.8   22.6   0.7707   3.5    7.0	Cyg X-2
358.5619   6.1894    2.0  40.2  105.2   4.4192   5.7  381.2	UNKNOWN
313.0938  58.2277    2.0  44.8    4.7   2.0440   5.8 ------	UNKNOWN
317.8845 -34.7115    2.6  48.3 -170.8   1.7114   4.4 ------	UNKNOWN
297.3943  30.2143    1.0  25.5  -37.3   2.5002  12.1 ------	UNKNOWN
276.5581  10.4018    2.7  41.0  -81.1   3.6728   4.3 ------	UNKNOWN
286.2437 -24.1716    2.9  49.1 -131.4   3.7785   3.9 ------	UNKNOWN
Pre-slew background subtracted image of 15-350 keV band
Time interval of the image:
-5.504000 12.084600

# RAcent  DECcent POSerr Theta    Phi  PeakCts   SNR AngSep     Name
#  [deg]    [deg]    ['] [deg]  [deg]                   [']
288.6737  10.8187   32.1  29.2  -83.5  -0.0950  -0.4   10.6	GRS 1915+105
299.6769  35.1359    9.0  27.4  -26.2  -0.3193  -1.3    5.8	Cyg X-1
308.0805  40.9057   66.1  28.8   -7.7   0.0441   0.2    3.1	Cyg X-3
326.2459  38.1768   43.9  25.6   23.1  -0.0710  -0.3    9.4	Cyg X-2
347.0646 -20.2714    3.0  44.1  148.3   2.8106   3.9 ------	UNKNOWN
345.0743  -5.3791    0.2  32.6  132.5  31.5048  72.1 ------	UNKNOWN
304.3306  61.1017    2.8  48.6   -0.4   2.0369   4.1 ------	UNKNOWN
287.7227  57.8495    3.2  49.9  -12.1   1.6778   3.7 ------	UNKNOWN
289.0871 -29.7443    2.8  51.7 -138.6   3.2246   4.1 ------	UNKNOWN
279.3776  -0.2760    4.5  41.1  -97.9   2.0880   2.6 ------	UNKNOWN
Post-slew image of 15-350 keV band
Time interval of the image:
67.284660 963.079300

# RAcent  DECcent POSerr Theta    Phi  PeakCts   SNR AngSep     Name
#  [deg]    [deg]    ['] [deg]  [deg]                   [']
299.6048  35.1610    3.9  58.9  -20.8  10.9263   3.0    2.5	Cyg X-1
308.1618  41.0038    4.3  57.4  -10.4   7.9868   2.7    3.9	Cyg X-3
326.2341  38.2690    5.7  47.0    1.9   2.2096   2.0    4.3	Cyg X-2
 16.9506  15.9820    2.5  38.1   77.5   9.2021   4.6 ------	UNKNOWN
  6.2787  23.0788    2.5  35.2   57.4   5.1988   4.5 ------	UNKNOWN
345.0583  -5.4278    2.3   0.1 -155.9   2.8339   5.0 ------	UNKNOWN
336.2429 -53.7329    3.0  48.9 -150.9   5.9247   3.8 ------	UNKNOWN
306.7380 -23.5614    3.9  41.1  -98.0  11.2085   3.0 ------	UNKNOWN
Plot creation:
Sat May 30 15:16:03 EDT 2015